
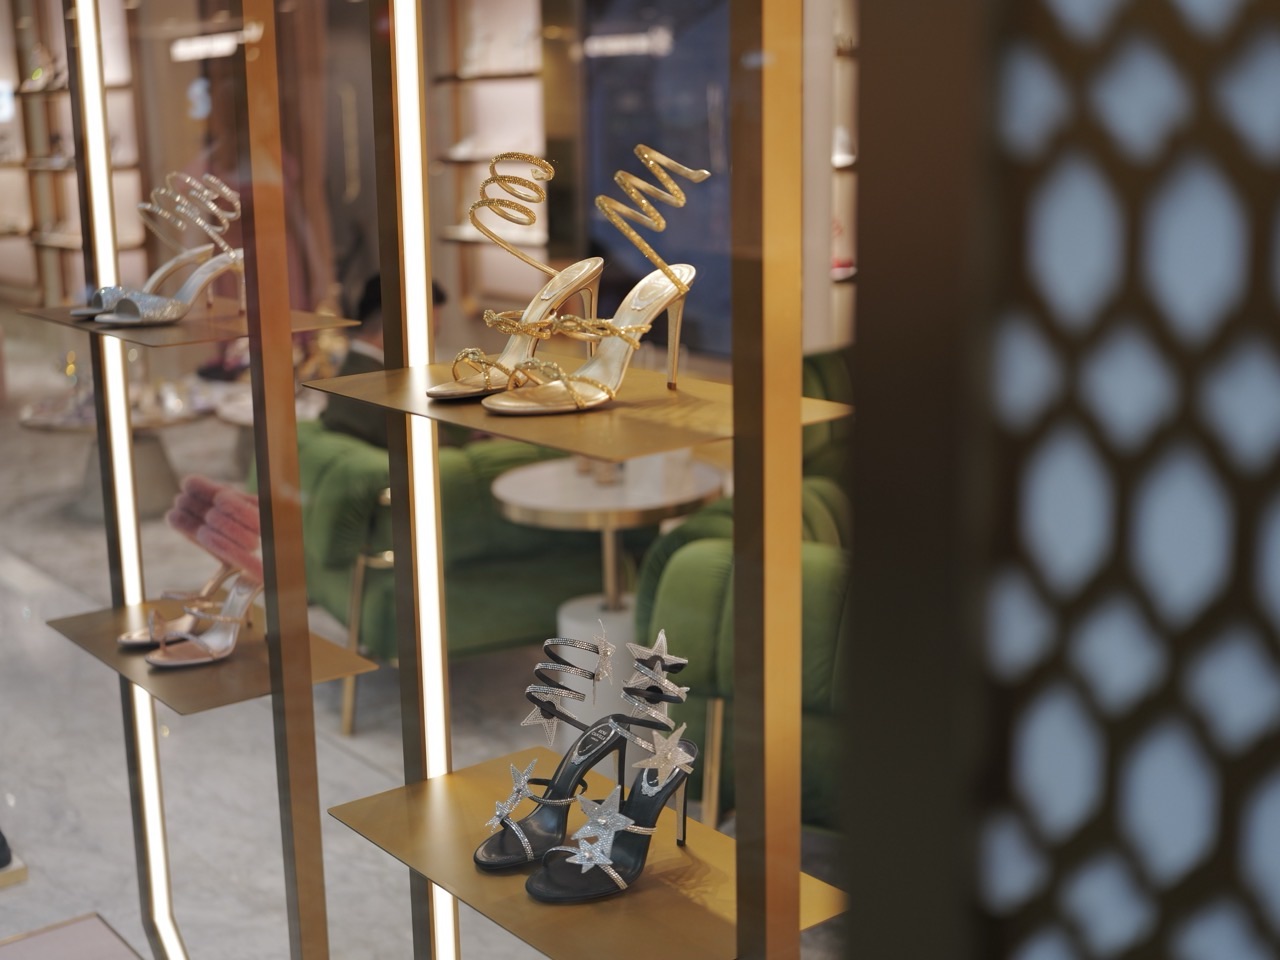
Why is mathematics important in shoe sizing? A size label compresses a complicated three-dimensional fit problem into one short code. Feet have length, width, girth, arch shape and asymmetry; shoes are built around lasts with their own geometry; materials bend and stretch; and sizing systems use different starting points and increments. Mathematics explains why two shoes carrying “the same size” can fit differently—and why a measured foot length cannot be converted into a guaranteed purchase with one universal formula.
This guide is educational, not medical, podiatric or purchasing advice. Pain, injury, numbness, skin change or persistent fit problems deserve assessment by an appropriate professional. Children’s growth, sports demands, workplace protection and medical conditions add requirements that a general article cannot determine. The worked examples are illustrative and should be checked against the actual brand, model and fitting guidance.
Quick route: begin with foot measurements, compare sizing scales, understand lasts, study tolerances, or jump to the FAQ.
A Foot Is More Than One Length
Foot length is usually measured from a defined heel reference to the longest toe while the person stands under specified conditions. Even that sentence contains variables: load, posture, sock thickness, time of day, surface, measuring tool and which toe is longest. A measurement without method is less comparable than it appears.
Width adds another dimension, but a single straight width does not capture girth. Ball girth follows a path around the forefoot; instep girth passes around a different section. Heel width, arch length and toe shape affect fit independently of overall length. Two people can share a 260 mm foot length and need different shoe shapes.
| Quantity | Simplified mathematical type | Why it matters |
|---|---|---|
| Foot length | Linear distance | Starting coordinate for size selection |
| Ball width | Linear distance | Forefoot space across a chosen section |
| Ball girth | Curved perimeter | Volume around the forefoot |
| Arch length | Landmark-to-landmark distance | Alignment of flex region and structure |
| Heel width | Linear distance | Rearfoot hold and shape |
| Toe profile | Curve or point set | Space distribution across toes |
The table explains why “my foot is 26 centimetres” is incomplete. It is useful data, but the fitting model requires several dimensions and the intended use. A running shoe, formal shoe and safety boot solve different constraint sets.
Did You Know? The longer foot is not always the only important one
Many people have asymmetry. One foot may be longer while the other is wider or has greater girth. Selecting only the longer length can still leave a width problem. A useful record keeps left and right measurements separate instead of averaging them into a foot that no one actually has.
Suppose left and right lengths are 258 and 262 mm. Their mean is 260 mm, but choosing around the mean could make the longer foot short of space. In contrast, a width-sensitive design might be constrained by the other foot. Maximums must be taken by relevant dimension, not by declaring one foot universally “larger.”
Measurement Uncertainty and Repeatability
Every measurement has uncertainty. A heel may not contact the reference consistently; toes move; a ruler has finite markings; a traced outline adds pencil thickness. If three repeated lengths are 261, 262 and 261 mm, reporting 261.33333 mm suggests more knowledge than the method provides.
The mean is 261.3 mm, the range 1 mm and sample standard deviation about 0.58 mm. These statistics describe short-term repeatability under those conditions. They do not include systematic effects such as a tilted device or a posture that shifts every reading.
A repeatable method uses the same unit, reference and load. Measurements are often more meaningful later in the day or after normal activity for some fitting contexts because feet can change, but the correct protocol depends on the purpose and professional guidance. What mathematics contributes is documentation: date, conditions, left and right, socks and tool.
Precision is not the same as accuracy
Five measurements can cluster within 0.2 mm and all be wrong by 4 mm if the zero point is displaced. Precision describes closeness among repeated values; accuracy concerns closeness to an appropriate reference. Calibration and method address accuracy, while repetition characterises random variation.
This distinction transfers directly to science experiments, manufacturing and school assessments. A calculator can produce many decimals from biased input; it cannot repair the input.
Shoe Size Is a Coordinate System, Not a Universal Measure
Sizing systems assign labels according to rules. A label may be based on last length, foot length or another defined quantity, and increments differ. Systems may start from different zero points. Therefore a conversion chart is a mapping between conventions, not a law of nature.
A simplified linear scale can be written S = aL + b, where L is a defined length, a sets size increments and b sets the origin. If another system uses S₂ = cL + d, conversion proceeds through the shared length definition: solve L = (S₁−b)/a and substitute into the second equation. Converting label-to-label without definitions can hide rounding and category differences.
Real charts may distinguish children, adults, women’s, men’s or unisex ranges; brands may use proprietary lasts and recommendations. Half sizes may not change every shoe dimension by half of a width size or half the internal volume. The mapping should be treated as approximate evidence for a starting point.
Step Sizes, Rounding and Boundary Effects
Suppose an illustrative sizing scale advances one label for every 6.67 mm of defined length. A foot-length estimate plus the system’s allowance might fall at 269.9 mm, just below a rounding boundary, while another reading of 270.2 mm falls above it. A 0.3 mm measurement difference could change the suggested label even though the physical feet are effectively the same for the method.
This is quantisation: a continuous measurement is assigned to a discrete category. Values near boundaries are sensitive to small errors. Reporting both the measurement and candidate sizes is more informative than pretending the category is exact.
Rounding direction should follow purpose. Rounding to the nearest category minimises average numerical error, but fitting may use asymmetric consequences: too short and too long are not equally acceptable. Brand guidance, intended activity and professional assessment matter more than a generic rounding rule.
Half size does not mean half a shoe
A half-size label usually represents an intermediate step in one system. It is not 50% of anything and does not imply every dimension is halfway between adjacent lasts. The phrase is ordinal shorthand, not a fraction of a physical object.
The Last Is a Three-Dimensional Model
A shoe last is the form around which footwear is designed or constructed. It represents intended internal shape and production needs, not a scan of one individual foot. Last geometry includes toe spring, heel shape, waist, instep, bottom curvature and cross-sections.
If two lasts have equal overall length but different toe profiles, their usable toe space differs. A pointed last allocates length ahead of the toes in a narrow region; a broad anatomical shape distributes volume differently. Comparing only bounding-box length ignores the cross-sectional constraints.
A three-dimensional last can be modelled as a surface mesh: vertices with x, y and z coordinates connected into faces. Cross-sections at selected positions produce closed curves. Their areas and perimeters describe local volume and girth. Digital design can compare surfaces point by point, but interpretation still requires anatomical and manufacturing knowledge.
The official abstract for ISO 19409:2022 confirms that basic last dimensions may be measured physically on a real last or virtually on a digital 3D model, and cautions that last dimensions do not necessarily correspond to anatomical foot positions. That distinction supports the careful language used here.
Scaling a last uniformly is usually too simple
Uniform scaling multiplies every coordinate by one factor. If length grows 2%, width and height also grow 2%, area grows about 4.04% and volume about 6.12%. Human dimensional changes across size ranges do not necessarily follow that similarity rule.
Grading therefore may use different increments by direction and region. A toe point might move forward more than it moves upward; a heel seat might change little in width; girth may follow a separate rule. This is related to pattern grading but belongs to a three-dimensional form and a distinct fit intent.
Cross-Sections, Girth and Area
Imagine a forefoot cross-section approximated by an ellipse with semi-axes a = 45 mm and b = 25 mm. Its area is πab ≈ 3534 mm². The perimeter has no simple elementary formula, but Ramanujan’s approximation gives a useful estimate. The ellipse is an idealisation; a real foot or last section is asymmetric and irregular.
If both semi-axes grow 2%, area grows by 1.02² = 1.0404, about 4.04%. This shows why a small linear change can create a larger cross-sectional area change. Internal volume may change even more because length also changes.
Yet more area does not guarantee comfort. The area could be located where it is not needed while pressure remains elsewhere. Shape matching is spatial: distribution matters as much as total.
Toe Shape and Curve Comparison
Toe outlines can be represented by coordinates sampled around a boundary. Two outlines can share area and maximum width while differing in curvature. One may taper early toward the big toe; another remain wide across several toes.
A simple comparison aligns heel and centre axes, normalises the intended reference length and measures distances between corresponding points. Alignment choices matter. If one outline is shifted 3 mm, pointwise differences may reflect the shift rather than shape. Registration should be defined before comparison.
Hausdorff distance, root-mean-square point distance and area overlap are possible mathematical summaries. Each emphasises something different. A single maximum distance is sensitive to one outlier; mean distance can hide a local pressure point. Good metrics are chosen for the question.
Arch Length and Flex Alignment
Overall length alone does not locate anatomical landmarks. Heel-to-ball length can differ among feet of equal heel-to-toe length. Shoe flex zones, support structures and upper seams may interact with those landmarks.
Represent the foot axis as a coordinate from 0 at heel to 1 at the longest toe. A ball landmark at 0.68 means 68% of that defined length from the heel. A shoe flex feature at 0.62 is six percentage points earlier. In a 260 mm coordinate, the separation is 0.06 × 260 = 15.6 mm.
Normalising positions helps compare sizes, but it assumes proportional relevance. Absolute distance may matter too. The example supports observation and fitting discussion; it does not diagnose gait or prescribe support.
Allowance Is Not Empty Space Everywhere
Footwear needs space beyond a static foot measurement, but “add 10 mm” is not a universal rule. Allowances depend on shoe type, last, toe shape, material, socks, movement, age and fitting practice. Added last length may include stylistic toe extension that does not become usable toe-box width.
Mathematically, internal length can be expressed as foot length plus a defined allowance, but every term needs a definition. Is length measured along the insole, last bottom, centreline or straight chord? Is the allowance total or concentrated at the toe? Does the measurement include removable liners?
A responsible comparison follows the brand’s measurement method and evaluates the actual model. General internet tables are starting references, not guarantees.
Fit Is a Chain of Allowances and Tolerances
Tolerance is permitted variation around a target. Manufacturing variation can enter last dimensions, cutting, stitching, lasting, sole moulding and material response. Measurement variation enters when the foot and shoe are assessed. The fit result is a chain, not one number.
Suppose a simplified internal-length target is 275.0 mm with manufacturing tolerance ±1.5 mm, while the foot measurement is 263.0 ±1.0 mm. The nominal difference is 12.0 mm. In a worst-case arithmetic comparison, difference could range from (273.5−264.0) = 9.5 mm to (276.5−262.0) = 14.5 mm.
This interval describes the simplified dimension chain, not acceptable fit. It shows why a nominal 12 mm difference does not exist as one exact physical gap. Systematic bias and shape mismatch can dominate.
Worst case and statistical variation answer different questions
Worst-case analysis sums limits in the most unfavourable direction. Statistical root-sum-square may describe likely variation when errors are independent, centred and characterised by standard deviations. It must not be used merely to make a tolerance look smaller.
If two standard uncertainties are 1.5 and 1.0 mm and independent, combined standard uncertainty is √(1.5²+1.0²) ≈ 1.80 mm. If both share a measurement calibration bias, independence fails. Document the model before calculating.
Width Labels and Multidimensional Categories
Width letters or descriptors add another discrete category, but their physical meaning varies by size, brand and market. A width code is not a universal number of millimetres. It may relate to last girth, bottom width or a company-specific grading system.
Length and width cannot always be adjusted independently. Choosing a longer size to gain width moves flex points and heel position as well as increasing space. Choosing a wider last may alter heel and instep differently depending on design. This is a coupled optimisation problem.
A two-dimensional size grid can represent candidate length and width categories. The best candidate minimises a fit-loss function across several measurements, but the weights are personal and task-specific. Pain at one location cannot be averaged away by generous space elsewhere.
Socks, Liners and Internal Volume
Socks and removable liners occupy volume. A sock 1 mm thicker around both sides of a simplified foot cross-section can reduce effective clearance by roughly 2 mm across that direction. Compression means the real change is not a rigid subtraction, but the geometry shows why sock choice matters.
If an insole is replaced with one 3 mm thicker, vertical volume decreases and the heel sits higher. Consequences depend on collar shape and shoe construction. A seemingly small layer can influence several fit regions because the foot’s coordinate within the shoe changes.
Record fitting conditions. Comparing one shoe barefoot and another with thick socks confounds the shoe difference with the sock difference.
Growth and Longitudinal Data
Children’s feet change, but growth is not a fixed monthly rate that supports automatic size forecasting. Measurements taken over time form a longitudinal dataset. Plotting left and right length against date can reveal trend and measurement scatter.
If measurements are 205, 208 and 211 mm six months apart, a straight-line fit suggests about 1 mm per month across that year. Extrapolating another year assumes the rate continues, which may be false. Growth can be uneven, and fit needs depend on width and shape too.
The safe use of the graph is retrospective: it organises evidence and suggests when remeasurement may be sensible. It should not justify buying far-ahead sizes or ignoring a child’s current comfort and professional guidance.
Dynamic Fit and Time-Series Measurement
Feet and shoes deform during movement. Pressure and shape change through a gait cycle. A static outline is one frame of a time series. Sensors may sample pressure at many locations and times, producing a matrix or heat map.
Peak pressure, pressure-time integral and centre-of-pressure path are distinct quantities. Peak records a maximum at one instant; integral combines magnitude and duration; path describes how a weighted location moves. None is a complete definition of comfort or injury risk.
Sampling rate matters. A device measuring too slowly may miss brief peaks. Spatial resolution matters too: a coarse sensor averages pressure over a larger cell. More coloured pixels do not guarantee greater accuracy unless the sensor is calibrated and the metric validated.
Size Conversion as an Interval Problem
Rather than map one label to exactly one label, treat a source size as an interval of underlying measurement values. If system A rounds every 6.67 mm and system B every 8.47 mm, one A category can overlap parts of two B categories.
This explains why charts sometimes show ranges or two possible equivalents. The honest result is a candidate set, not a mathematical failure. A person near a boundary should consult model-specific guidance and try the footwear under relevant conditions when possible.
Rounding a converted label twice can introduce error. Convert through the defined measurement and round once at the destination. This is the same principle used in currency, unit conversion and digital image resampling.
A Worked Comparison Example
Suppose a student records left length 257 mm and right length 260 mm, with estimated measurement uncertainty ±1 mm. Ball widths are 99 and 97 mm. A brand chart places a certain candidate range around 260 mm, but two models use different lasts.
Model A has broader toe cross-sections and lower instep volume; Model B is narrower at the toes and higher over the instep. A label conversion alone cannot choose. The relevant comparison includes the longer right foot for length, the wider left foot for forefoot width, instep conditions, socks and intended activity.
If candidate internal-length targets are 272 and 278 mm, nominal differences from the longer foot are 12 and 18 mm. Those values are not “toe gaps” without knowing measurement paths and last extension. The student should report them as model-defined length differences and follow fitting guidance.
The example demonstrates a mature conclusion: arithmetic narrows questions but does not pretend to feel the shoe.
Common Misconceptions and Better Replacements
- “Foot length determines the one correct shoe size.” It provides one coordinate; width, girth, shape, use and model matter.
- “Size 8 means the same length everywhere.” Sizing systems and brand lasts differ.
- “A half size changes every dimension halfway.” It is a label step, not a universal geometric fraction.
- “Average the two feet.” Keep left and right data; different dimensions may constrain fit.
- “Longer always fixes wider.” Extra length also shifts landmarks and may not add space where needed.
- “A conversion chart guarantees fit.” It supplies candidate labels under stated conventions.
- “More internal volume is always better.” Distribution, hold, movement and purpose matter.
- “A static measurement predicts dynamic comfort.” Movement, materials and time add variables.
Safe Mathematics Activities
Activity 1: Repeat a paper measurement
Using a teacher-approved classroom method, measure a cardboard shape five times from the same heel line to toe point. Change the observer, calculate mean and range, and discuss systematic versus random effects. Do not use the activity to diagnose a person.
Activity 2: Build two sizing scales
Define fictional systems A and B with different increments and zero points. Convert twenty random lengths through both, then plot A label against B label. Highlight places where one A category maps to two possible B categories.
Activity 3: Compare toe outlines
Draw two shapes with equal maximum length and width but different taper. Estimate their area on graph paper and overlay them. Identify locations where one provides more space even if total area is similar.
Activity 4: Scale a paper last section
Draw an ellipse and enlarge linear axes by 2%, 5% and 10%. Calculate area factors and compare with a design that enlarges width but not height. Explain why uniform scaling and directional grading differ.
Activity 5: Make a tolerance chain
Use fictional foot, sock and shoe measurements with stated limits. Calculate nominal, minimum and maximum clearance under worst case. Then list assumptions that prevent the interval from becoming a fit verdict.
Activity 6: Track a harmless time series
Measure a foam model under three loads or use provided data. Plot length, width and girth across time. Separate actual change from measurement noise and avoid extrapolating beyond the observations.
How Students Can Build Transferable Skill
First, define the measurement path. “Length” is not enough; name endpoints and whether the path is straight or follows a curve. Second, keep coordinate systems visible. Left and right, medial and lateral, foot and last must not be silently swapped.
Third, separate continuous measurements from discrete labels. Categories simplify decisions but create boundaries and rounding. Fourth, test sensitivity: how much would the candidate label change if length shifted by 1 mm? A conclusion that flips with tiny input variation needs caution.
Fifth, keep models and outcomes separate. A calculated internal-length difference is a geometric result. Comfort is a human outcome influenced by more variables. This habit protects students from overclaiming in any data-rich field.
Three-Dimensional Scanning and Mesh Quality
A foot scanner samples surface points and reconstructs a digital mesh. Resolution, calibration, occlusion and posture affect the result. A dense cloud of points can still be inaccurate if the scanner coordinate system is distorted or the heel is hidden.
Mesh triangles approximate a smooth surface. Smaller triangles can represent local curvature more closely, but they increase file size and may capture noise. Smoothing reduces noise while risking loss of genuine features. Every processing step should be documented because two meshes created from the same scan can differ after filtering and hole filling.
Volume computed from a closed mesh depends on watertight geometry and consistent face orientation. If the mesh has gaps, software may invent a closure. That calculated volume is then partly a property of the repair algorithm. A responsible report names the scan method, processing and repeatability rather than presenting volume as an unquestionable body fact.
Alignment is also critical when comparing scans over time. An iterative closest-point algorithm can minimise average surface distance, but it may hide a true positional change by rotating or translating the model. Registration landmarks should match the study question.
Sampling Customers and Building Size Ranges
A manufacturer designing a size range may study measurements from many people. The sample must represent the intended users. A large dataset drawn from one age, region or activity group can be precise about the wrong population.
Percentiles summarise distributions. If a dimension is at the 95th percentile, about 95% of observations in that reference sample are at or below it. It does not mean the person is “95% of normal,” nor guarantee the same percentile in another population.
Designing to the 5th–95th percentile on every dimension simultaneously does not necessarily cover 90% of people. Length, width and girth are correlated but not identical, and a person can fall inside each separate range yet have an unusual combination. Multivariate methods cluster shapes or model covariance rather than treating dimensions independently.
Inclusive size systems also consider who was missing from the sample, how measurements were taken and whether the product’s constraints exclude users unnecessarily. Mathematics can reveal coverage gaps, but values and design choices determine what the company does about them.
Returns Data and the Danger of Easy Conclusions
Retail returns provide large datasets, but a return reason is not a laboratory measurement. “Too small” may refer to toe width, instep, length, socks, expectation or an ordering mistake. People who keep shoes are often not surveyed with equal detail, creating selection bias.
Suppose 18% of returned pairs are marked “too narrow.” This is not the percentage of all buyers who found the shoe too narrow unless the denominator includes every relevant sale and reporting is consistent. If 5000 pairs sold and 400 were returned, with 72 narrow returns, the overall recorded narrow-return rate is 72/5000 = 1.44%, while narrow’s share of returns is 72/400 = 18%.
Both percentages are correct but answer different questions. The first concerns sales; the second concerns return composition. Neither directly measures true fit prevalence because some customers exchange, tolerate discomfort or choose another reason code.
Model, size and region should be separated before acting. Aggregating across models can produce Simpson’s paradox: an overall pattern may reverse within each model because sales mix differs. A good dashboard keeps counts and denominators beside percentages.
Optimisation Has More Than One Objective
Footwear design balances fit coverage, style, weight, durability, manufacturability, cost and material use. These objectives can conflict. A last that maximises average geometric overlap with scans may not support the intended performance or construction.
Multi-objective optimisation produces a set of Pareto-efficient designs: improving one objective would worsen another. Decision-makers then choose among them using requirements and tests. Mathematics does not hide the trade-off inside one mysterious score.
Constraints define unacceptable regions. Protective-toe clearance, material thickness or machinery limits may be fixed. Comfort survey scores are observations with variability, not deterministic equations. A robust design remains acceptable across plausible variation instead of fitting only an average foot exactly.
This is a powerful lesson for students: optimisation is rarely “find the biggest number.” First define whose needs count, which constraints are absolute, which outcomes can trade and what uncertainty surrounds every input.
Good definitions protect decisions.
Guidance for Parents and Teachers
Use footwear as a way to discuss measurement, not as a reason to judge bodies. Feet naturally vary. Avoid framing one shape as mathematically “normal” and others as errors. The model should adapt to people, not the reverse.
Ask students why a size chart might disagree with experience. Product category, last, socks, time of measurement and rounding are productive hypotheses. Encourage them to test definitions before blaming the calculation.
For real purchases, observe the manufacturer’s fitting instructions, try both shoes under relevant conditions where possible and prioritise safety. Children, athletes and people with pain or medical concerns may need professional advice. School mathematics should support careful questions, not supply a diagnosis.
Careers and Learning Pathways
The mathematics of footwear connects product design, biomechanics, industrial design, podiatry, orthotics, sports engineering, manufacturing quality, 3D scanning, computer vision and retail data. A last engineer may work with surface geometry; a quality specialist with tolerance and sampling; a biomechanist with time-series pressure data.
Mathematics alone does not qualify someone for these roles or guarantee a comfortable product. Anatomy, materials, craft, ethics, regulation, user research and testing are essential. Mathematics contributes common language and traceable decisions.
Frequently Asked Questions
Why do shoes of the same labelled size fit differently?
Brands and models use different lasts, materials, construction and fit intentions. A label is a category within a system, not a complete geometric specification.
Should I choose based on the longer foot?
Length commonly needs to accommodate the longer foot, but the other foot may be wider or have greater girth. Consider both feet and model-specific guidance rather than average values.
Can I convert centimetres directly into a guaranteed size?
No. A chart can suggest candidates only when its measurement method and allowance are understood. Fit also depends on width, shape, socks, intended use and the actual model.
What is a shoe last?
It is a three-dimensional form used to design and manufacture the shoe. Its geometry helps define internal shape, proportions and style; it is not simply a foot replica.
Does a bigger size always provide more width?
It may change several dimensions, but the pattern depends on the grading system. Gaining width by adding length can misalign other features. A different width or last may be more relevant.
Can pressure maps diagnose a problem?
Not by themselves. They depend on sensor calibration, sampling, protocol and interpretation. Medical conclusions require qualified professional assessment.
Useful Next Reading
Why Mathematics? | Sports Statistics, Speed and Performance develops measurement and cautious interpretation in movement. Why Mathematics? | Wheel Alignment, Angles and Tyre Wear shows how geometry and tolerances affect contact, while Why Mathematics? | Comparing Percentages Fairly strengthens the denominator thinking used in growth and scale changes.
Shoe sizing is a memorable lesson in mathematical humility. A label is useful, a measurement is better, and a well-defined set of measurements is better still—but fit emerges from geometry, materials, movement and a person. Mathematics matters because it helps us organise those factors, recognise uncertainty and choose the next check without pretending that one number can speak for the whole foot.