
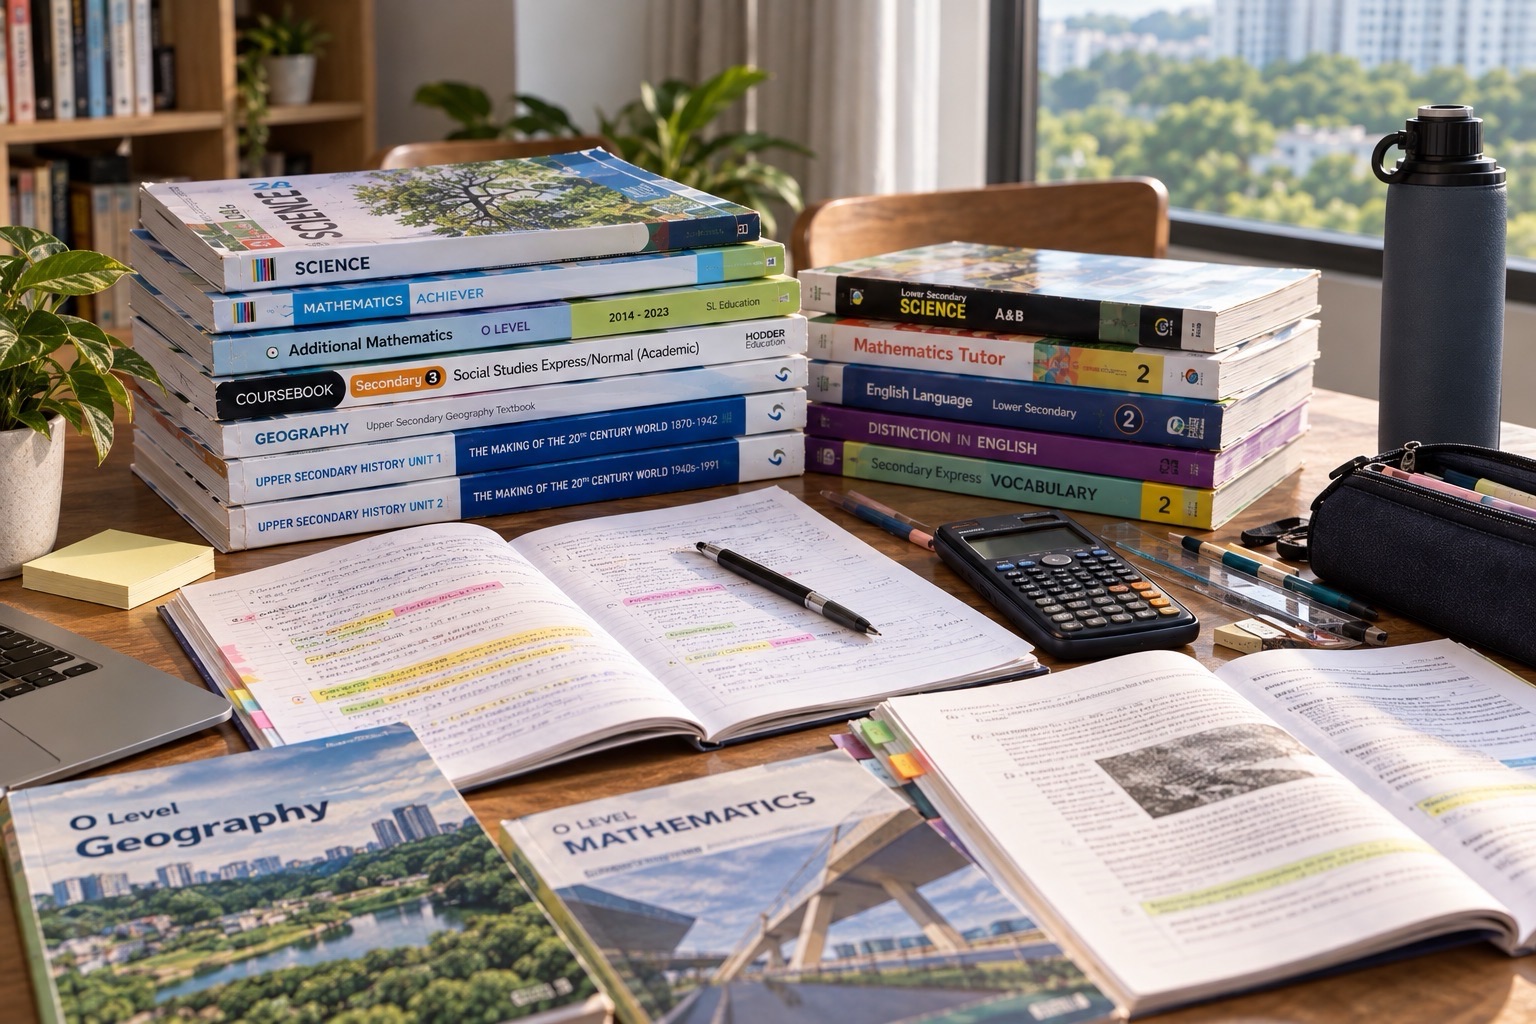
Did you know? A student can look at the same Bukit Timah street as everyone else and still see a different kind of question. Why are some pavements hot at noon? Why do people cluster near a sheltered crossing when rain begins? Why might an apparently successful tourism destination face pressure from the very visitors it attracts? These are geographical questions: they connect a place, a process, a pattern and the people who experience it.
This 2027 SEC Geography G2 and G3 guide for Bukit Timah families explains which Singapore-Cambridge Secondary Education Certificate syllabus to check, how to read maps and data, how to carry out responsible geographical inquiry, and how to write explanations that do more than describe what an image shows. It is for students, parents and tutors who want practical steps rather than a wall of unexplained terminology.
The short answer is that strong Geography work combines accurate observation, geographical concepts, evidence and a reasoned conclusion. A good learner asks what happened, where, why there, why it matters, and how confident the available evidence allows us to be. The exercises below are classroom illustrations, not predictions of exact 2027 examination questions.
Start with the correct 2027 Geography subject code
SEAB’s published 2027 school-candidate SEC lists identify G2 Geography as K226 and G3 Geography as K329. They also list Humanities combinations involving Social Studies and Geography: G2 K229 and G3 K335. A standalone Geography subject and a Humanities combination do not automatically involve the same paper structure, weightage or preparation materials. Your child’s actual subject-combination letter, school instructions and the relevant official syllabus take precedence over a generic tuition-centre checklist.
From 2027, the SEC replaces the separate N- and O-Level examinations and records the subject levels candidates take. G1, G2 and G3 describe subject levels, not a permanent label that should be applied to every subject the student studies. This is particularly useful for parents comparing guidebooks: two books with “2027 Geography” on the cover may address different syllabus codes and very different expected depth.
Read the official SEC overview, 2027 G2 school-candidate list and 2027 G3 school-candidate list. On the appropriate list, open the current Geography syllabus and verify the assessed content and components. This guide uses those official subject identities, while any local examples are explicitly illustrative.
What does it actually mean to think geographically?
A fact is not yet a geographical explanation. “There are several shaded walking routes in this area” is a description. “Shaded routes may attract more pedestrians in hot weather because they reduce direct sun exposure, although convenience and road crossings may matter as well” is the beginning of an explanation. It identifies a possible mechanism and makes room for other variables.
The subject asks students to move among scales. At a very local scale, a difference of twenty metres can change whether a person walks under trees or along exposed concrete. At a city scale, networks of housing, transport, economic activity and green space shape people’s options. At a global scale, climate and international tourism link decisions made in one country with outcomes elsewhere. Each scale contributes, but no single scale tells the whole story.
A useful five-question routine is: Where is the pattern? What process might produce it? Whose experience is being described? What evidence supports the claim? Which alternative explanation could matter? This routine helps students resist the temptation to copy a definition and stop. It is also a natural structure for parent-student conversations about neighbourhood observations.
- Location: Name the place, spatial unit or distribution actually being discussed.
- Pattern: Identify concentration, dispersion, gradient, sequence or change.
- Process: Explain the action or relationship capable of producing the pattern.
- Scale: Decide whether the evidence concerns a street, estate, city, region or world.
- Judgement: Consider uncertainty, consequences, stakeholders and feasible responses.
G2 and G3: depth is not the same as personal worth
Families sometimes speak as though a subject at a particular level measures intelligence. This is a poor way to plan learning. What matters is the actual Geography syllabus and the quality of the student’s reasoning within it. A student taking G2 needs to master the assessed knowledge and methods for that course. A student taking G3 needs to meet the depth, data demands and argumentative precision of the G3 paper. Materials should follow the relevant learning targets.
Suppose two students study urban weather. Both should distinguish temperature from rainfall and recognise that measurements depend on where and when they are taken. A more demanding task may require the learner to link several datasets, consider sampling limitations or evaluate interventions with competing constraints. The difference is not whether one student deserves interesting questions; it is how far the explanation must be developed and evidenced.
Good tutors therefore show the learning objective before the worksheet. They diagnose whether an error came from vocabulary, concept knowledge, graphical reading, causal reasoning or writing. Repeating a question at a higher difficulty does not automatically repair an earlier misunderstanding. Working back to the first unstable step often saves time.
Geography in everyday life: the best starting point
Bukit Timah provides familiar situations for practising geographical reasoning without claiming that particular current developments or local statistics have been verified. Imagine comparing two school-to-home routes. Route A is shorter but exposes the walker to several busy crossings; Route B is longer and shaded. Which is preferable? The answer depends on the objective: walking time, comfort, safety, accessibility or weather.
A student can map both routes, measure approximate distances, note crossing locations, observe shade at fixed times and write a clear evaluation. The geographical insight is that “best route” does not have a single meaning until the criterion is specified. A family with a stroller might value kerb ramps; someone walking in afternoon rain might prioritise shelter. Treat these as different viewpoints, not obstacles to finding an answer.
A second everyday example is a neighbourhood food shop. The number of customers may vary across lunch hours, school dismissal and weekends. Geography can examine accessibility, competing locations and the flow of people. But the observation “the shop is busy near a bus stop” does not prove the stop caused the crowd. A careful fieldworker considers prices, nearby employment, school calendars and observation time.
A third example is heat. The air under a tree may feel cooler than an exposed paved space, yet a responsible comparison requires instruments placed at sensible positions and measurements taken close together in time. If one reading was obtained after rain and the other on a dry afternoon, differences cannot be attributed simply to shade. This is the start of geographical method, not a nuisance added to the end.
Fieldwork is a chain of decisions, not just a day outdoors
Geographical inquiry teaches students to convert curiosity into a question that can be investigated. “Is Bukit Timah good for walking?” is broad and subjective. “How do students rate perceived walking comfort along two specified routes during one afternoon observation window?” is narrower. It names a place, population, variable and time. That allows a researcher to decide what evidence is required and what the limitations will be.
The first design step is to choose a research question or hypothesis and identify variables. A question about pedestrian comfort might involve route distance, shading, perceived heat, perceived safety or number of crossings. The next step is to choose a sampling method and a reasonable, safe data collection plan. Fieldwork can combine numerical observations with explanations supplied by participants; neither type should automatically be treated as more truthful than the other.
For a simple supervised classroom exercise, students could observe three authorised public locations at the same approximate time on different days, count passers-by for a fixed ten-minute period, and record weather conditions. The counts might differ substantially. Before drawing a conclusion, the group must ask whether school events, holidays, route closures, rainfall and observation errors affected the result.
Sampling creates another important limitation. If a survey asks only people who are already using a particular sheltered walkway whether they prefer sheltered paths, the sample has excluded many who chose other routes. Its result might tell us about those walkway users, not all residents. A more defensible study defines its target population, explains who was approached and records how the selection method affects interpretation.
Ethics and safety matter as much as calculation. Never pressure strangers to participate, collect unnecessary personal identifiers, enter restricted sites or obstruct accessibility routes. For children, use school-approved fieldwork procedures, appropriate supervision and anonymised data. Photographs of people should not become public classroom content merely because a street is publicly accessible.
A practical fieldwork write-up, step by step
- Question: State one sufficiently narrow investigation question.
- Purpose: Explain why it is geographically useful rather than merely interesting.
- Method: Describe where, when and how information was gathered.
- Evidence: Present a relevant table, graph, map or coded response summary.
- Explanation: Identify the observed pattern and plausible mechanism.
- Limitations: Discuss selection bias, sample size, timing and measurement accuracy.
- Conclusion: Answer the original question at the level supported by evidence.
- Improvement: Recommend a feasible, ethical change to strengthen future inquiry.
Notice how each stage builds on the previous one. A polished bar chart cannot repair a question that was never defined. A confident conclusion does not justify claiming that five observations represent an entire neighbourhood. The student’s strongest skill is to connect the stages honestly, even when the results are surprising.
Maps, graphs and photographs: three kinds of evidence
A map can show where something is. A graph can show quantities or change. A photograph can show selected details at a moment. These sources answer different questions. Students should ask what is missing from the representation before interpreting it. The choice of symbols, colour ranges, time period, spatial boundaries and viewpoint can all affect what readers notice first.
When reading a map, check the legend, north arrow where applicable, scale, title, date and boundary of the displayed area. When estimating a distance, use the scale rather than the apparent space between labels. When reading a choropleth map, distinguish an area with a high total number from an area with a high rate or proportion. Those are not interchangeable.
When reading a graph, first identify what the horizontal and vertical axes mean. A graph showing monthly average rainfall is not a graph of daily maximum rainfall. A temperature line chart may display degrees Celsius; a graph of change may instead display a difference from a baseline. These distinctions seem small until they reverse an argument about trends.
Photographs are useful for recording visible features, but they are not a neutral view of everything. The photographer may have chosen a particular angle, time and weather condition. A single image of a flooded path, for example, cannot tell us how often the path floods during the year. A good answer distinguishes what is visible from what must be established elsewhere.
Worked example 1: do two places really have different temperatures?
Consider a fictional fieldwork dataset. Three temperature measurements in a shaded location are 29.4°C, 29.7°C and 29.5°C. Three measurements along a nearby exposed path are 31.3°C, 31.1°C and 31.4°C. The arithmetic mean is approximately 29.53°C in the shaded setting and 31.27°C in the exposed setting, a difference of about 1.73°C. The data supports a difference during those observations; it does not establish a year-round average for either location.
A good explanation might say that differences in solar exposure and surrounding surfaces could contribute to the observed temperatures. But a careful student would also ask whether the sensors were equally calibrated, measured at the same height, shielded appropriately from direct sunlight and used within the same time window. Poorly controlled measurement could create part of the apparent pattern.
To improve the inquiry, repeat measurements across comparable days and times, document the instruments, and distinguish air temperature from surface temperature. Even then, say where the observations were collected and what remains uncertain. This is how Geography develops useful caution without becoming hesitant or vague.
Worked example 2: tourism success and its consequences
Imagine a hypothetical heritage district receiving more visitors after a popular event. A student writes, “Tourism is good because more tourists bring money.” That statement ignores who receives the money, the costs incurred and what occurs when visitors compete for limited space. A geographical approach traces visitor spending, work opportunities, transport pressure, waste, maintenance and the experience of local residents.
A stronger response can hold two ideas at once: visitors may support local services and appreciation of heritage, while concentrated foot traffic might increase congestion and wear on sensitive places. Whether the net impact is favourable depends on the type of tourism, distribution of benefits, the environment’s carrying capacity and management choices.
An appropriate recommendation could include visitor information, route design, protection of sensitive areas or careful scheduling. It should be evaluated against the actual issue described in the question. Simply listing every possible “sustainable tourism” measure creates the appearance of knowledge without an argument.
Why Geography matters beyond the examination
Good geographical thinking helps a person distinguish a neighbourhood preference from a measured trend, an individual story from a population pattern and a proposed solution from a proven result. It teaches students to ask how people and environments shape each other. These habits transfer to journalism, data interpretation, urban planning, engineering, social policy and ordinary decisions about where and how we live.
The examination goal is important, but it should not crowd out the larger learning goal. A student who can explain a rainfall chart accurately, acknowledge uncertainty and suggest a safer investigation has learned something more durable than a paragraph copied from a model answer.
Worked example 3: deciding whether a neighbourhood is walkable
Suppose a class is asked to evaluate the walkability of a hypothetical 800-metre route between a station and a library. Some students focus only on distance. A more defensible inquiry considers continuous pavements, step-free access, controlled crossings, lighting, exposure to weather, perceived safety and the needs of different users. Each variable should be defined: for example, “crossing count” means the number of road crossings actually encountered along the chosen route, not the number visible on a map.
The group might find that Route A takes eleven minutes and includes three crossings, while Route B takes thirteen minutes and includes one controlled crossing. No route is universally best. A student carrying heavy bags might prefer the shorter route; a younger pupil or a walker with mobility needs might care more about the quality of crossings and kerb ramps. The report should make these criteria explicit before giving a recommendation.
Now imagine the survey collected opinions from only five classmates on a single rainy afternoon. The study might be a useful pilot, but a conclusion about “all Bukit Timah residents” would be unjustified. Better future fieldwork might use different times of day, additional participant groups and repeated observations, subject to school approval. A careful conclusion can still be valuable: “Among the observed conditions and participants, Route B appeared to provide fewer road crossings, but the preference result is not representative.”
Worked example 4: reading a changing rainfall pattern
A teacher supplies a fictional chart of monthly rainfall totals: 110 mm, 145 mm, 160 mm and 125 mm for four consecutive months. Which month is wettest within this limited dataset? The third, at 160 mm. Did rainfall “increase continuously”? No: it rose for two intervals and then fell. Did the area experience more rainy days in the third month? The totals alone cannot answer that question, because more rain could have fallen on fewer, more intense days.
This kind of question protects students from the misleading shortcut “higher total means more frequent events”. Rainfall amount, rainy-day frequency and intensity are separate measures. If an accompanying photograph shows a deep puddle, that photograph may illustrate local drainage conditions at a moment, but it is not a direct measure of the entire area’s monthly rainfall.
A useful extension asks what other evidence would help explain the observations. Students could request daily rainfall records, storm timing, drainage conditions and the measurement location. They should not invent actual agency data to make an answer look scientific. Reliable data belongs to a specific source and date; when the question supplies fictional values, label them fictional.
Worked example 5: a geographical claim about sustainable tourism
A case-study prompt says a scenic walking trail may become crowded during school holidays. One proposal is to advertise a less-used route. Before agreeing, a student should ask whether the alternate route is safe, suitable for its expected users and environmentally robust enough for more visits. Redistributing visitors can solve a bottleneck or simply move damage to a more sensitive place.
Another proposal is to limit certain activities at peak times. That could improve habitat protection and visitor experience but also reduce convenience or revenue for some stakeholders. The learner should identify the precise environmental concern, what evidence could measure it and how the intervention’s benefits would be weighed against access and management costs.
An effective evaluation does not finish with a generic sentence such as “tourism has advantages and disadvantages”. It might conclude that visitor redistribution is sensible only where the alternate route has sufficient capacity and where monitoring can detect ecological damage. That conditional judgement shows the student understands both the process and the limits of the evidence.
A cause-and-effect chain that earns marks
Many weak answers jump from an observed pattern straight to a large conclusion. For example, “More greenery means a healthy city.” Greenery can provide important benefits, but the argument has skipped many details. What kind of greenery? Is it accessible? How is it maintained? Which outcome is meant by “healthy”? Does the available evidence measure that outcome?
A stronger chain could be: “A route with established trees may offer more shade, which can reduce exposure to direct sunlight during the walk, potentially improving perceived thermal comfort for some users. The effect will depend on weather, time of day and the route’s other features.” Each step has a job. The conclusion remains useful without claiming that a single observation proves a citywide health benefit.
For an assessment response, begin by naming the independent and dependent variables when they matter, then explain the mechanism in a small number of linked sentences. Add other conditions only if the question requires evaluation. Length is not a substitute for causal clarity. A paragraph with four correct moves can be stronger than two pages filled with adjacent facts.
Four weeks to build Geography confidence
Week 1: Find the exact error
Choose a recent Geography worksheet, school assessment or piece of fieldwork feedback. Divide the mistakes into location and map skills, concept knowledge, geographical processes, evidence selection, data interpretation and conclusion writing. Highlight which mistakes were due to not knowing content and which were due to knowing it but failing to use it.
Keep an error log that records the student’s original step, why it was mistaken and the corrected reasoning. “I got Question 4 wrong” gives little direction. “I described a rainfall total as the number of rainy days; next time I will check the axis and units first” creates a habit that can transfer to unseen questions.
Finish the week with five short oral explanations of different visuals. Ask what each map, chart or photograph definitely establishes, and what remains unclear. Avoid marking every cautious observation as weakness: the ability to recognise missing evidence is part of geographical competence.
Week 2: Rebuild fieldwork and data foundations
Work with a short, teacher-approved local observation exercise or a provided fictional dataset. Write a research question, name a variable, choose an appropriate way to record it and specify the sampling limitation. Repeat with a different question so the student can separate a reusable method from one memorised example.
Then practise drawing or reading a suitable graph. The student should check units, scales, titles and whether values represent totals, rates, means or percentages. Ask the student to write one sentence of observation and a second sentence explaining a possible cause. The distinction is small but decisive.
At the end of the week, review two weak conclusions and rewrite them so they do not claim more than the sample supports. A conclusion should return to the investigation question, not merely repeat a table. Add one practical improvement and explain how it would address a named weakness.
Week 3: Connect syllabus concepts with new settings
Select two topics currently taught at school, such as sustainable development, tourism or climate, according to the student’s level. For each, prepare a one-page concept map with key terms, a causal process, one relevant source type, a possible stakeholder difference and a limitation. Practise explaining the map without looking at it.
Transfer the same concept to a new hypothetical place. If a lesson describes tourist pressure in one city, ask how geography, accessibility or regulations might change the pattern in another. The goal is not to guess every destination’s true conditions; it is to see which variables could change the outcome.
Write two timed paragraphs based on supplied evidence. In the correction session, underline every claim that lacks an explanation or a link to the question. Rewrite that sentence with an explicit mechanism instead of adding a famous location or an unverified statistic.
Week 4: Practise under realistic conditions
Use the correct syllabus and an appropriate school-set or authorised specimen-style task. Do not borrow a G3 paper for a G2 student simply because it has the word “Geography” at the top. Practise the actual kinds of maps, data and explanation required by the student’s course.
After the timed work, compare the student’s original interpretation with the evidence. Were the units read correctly? Did the paragraph answer the command word? Was a causal chain supported? Did the evaluation compare meaningful constraints? Make the correction process visible, perhaps by colour-marking the claim, evidence and explanation.
Finish with delayed retrieval several days later. Ask the learner to solve a new problem without seeing the corrected answer. Repeating the exact model paragraph is not the same as being able to transfer the thinking. A successful revision plan measures that transfer.
The difference between description, explanation and evaluation
Description answers “what appears to be happening?”. For instance: “The recorded number of pedestrians rose between 7.30 a.m. and 8.00 a.m.” Explanation asks “why might it be happening?”. A cautious response could suggest that the period coincides with commuting and school travel, while noting that the available data does not prove the cause. Evaluation asks “how convincing is that explanation, and what else matters?”.
Students can rehearse all three with the same data. This is especially useful for those who repeatedly lose marks because they state trends when the question asks for reasons. The trick is not to insert the words “because” and “however” mechanically. Each part of the paragraph must add new reasoning tied to the evidence.
Seven errors that are worth correcting early
- Misreading scale: Confusing visual distance with actual distance on a map.
- Mixing totals and rates: Treating a large population count as proof of a high per-capita measure.
- Ignoring time: Comparing observations from different weather or travel conditions as though they were simultaneous.
- Overgeneralising: Treating a small convenience sample as representative of every resident.
- Inventing a cause: Declaring that two variables are causally linked because they move together.
- Unclear location: Writing “this place” when the map or text refers to multiple sites.
- Generic conclusion: Repeating “sustainable development is important” without evaluating the specified intervention.
A simple correction routine is to let the learner spot which one of these errors applies before a tutor provides the finished answer. That strengthens self-monitoring. The teacher then models the precise fix and asks the student to apply it on a fresh example.
How tutors can structure a 90-minute Geography tutorial
A useful session can begin with ten minutes of retrieval: one map-reading task, a short definition and a two-sentence inference. The next fifteen minutes diagnose the most damaging error. If it is graph interpretation, repair axes and units before moving to complex evaluation. If it is explanation, teach how to connect the observed pattern with a defensible process.
The middle of the session can involve guided analysis of a source or short case. The tutor asks the student to separate what is provided from what has been inferred, and to mark the evidence that supports the inference. Then the student attempts a similar but not identical task independently. The final part checks the correction and sets narrow practice for the week.
In a small group, students can compare interpretations without turning discussion into guessing the tutor’s preferred line. Invite one student to defend the geographical mechanism, another to identify an alternative variable, and a third to decide what evidence would distinguish the possibilities. This makes peer discussion an exercise in reasoning rather than competing for attention.
What parents can do in Bukit Timah without running a fieldwork expedition
Parents need not organise elaborate research outings. A ten-minute conversation on an ordinary journey can work: Why is this crossing easier to use? What might make a walking route feel hotter or safer? Which observation is a fact, and which is an opinion? The adult can model curiosity while avoiding unsupported claims about construction plans or neighbourhood statistics.
At home, choose a graph or photo already used by the teacher and ask the child three questions: What does it show? What might explain it? What further evidence would you want? If the student is unsure, return to the smallest observable detail rather than supplying a ready-made essay.
When shopping for learning materials, check the subject code first. When speaking with a tutor, ask how they distinguish content gaps from reasoning gaps and whether the practice includes corrections and transfer tasks. Progress is not merely the number of worksheets finished; it is the student’s improving ability to explain a new example independently.
Frequently asked questions for the 2027 SEC Geography student
Is Geography compulsory for every secondary student in 2027?
Do not assume a particular optional subject combination is universal. The SEC framework covers candidates at their subject levels, but individual students take the subjects offered or allocated through school arrangements. Check your child’s official school subject-combination information rather than relying on what another school does.
Is G2 Geography the same paper as G3 Geography?
No. SEAB lists separate syllabus codes K226 and K329. The codes matter because they direct you to the relevant content, specimen information where available and assessment details. Even when topics overlap, parents should not substitute one paper’s marking expectations for the other’s.
Is standalone Geography the same as Humanities with Social Studies and Geography?
No. SEAB lists separate codes for the Humanities combinations. In the 2027 lists, the combinations are G2 K229 and G3 K335. Students should study their actual syllabus rather than combining unrelated standalone tasks into a guessed exam pattern.
Can I use current events as Geography examples?
Yes, when the event is accurately described and relevant to the syllabus. Use dated, attributable sources, distinguish announced proposals from completed changes, and avoid memorising news stories with no connection to the required concept. A well-explained hypothetical case can be safer than an inaccurate real one.
Does fieldwork mean interviewing strangers?
Not necessarily. Geographical inquiry can use appropriately collected observations, measurements, maps, secondary datasets or authorised surveys. The method depends on the research question, school guidance, ethics and safety. Children should not be sent to approach strangers or enter unsafe sites on their own.
My child describes graphs correctly but cannot explain them. What should we fix?
Ask the learner to name one plausible mechanism behind a pattern, then identify a condition or other variable that could influence it. This turns “the line rose” into a causal explanation without forcing unearned certainty. Practise with several new datasets to build transfer.
Should every answer contain an example from Singapore?
Use the question, syllabus and teacher’s guidance. A relevant Singapore example can be useful, but forcing a local place into an answer that is about a different system may distract from the required process. Relevance, accuracy and explanation matter more than name-dropping.
Do longer answers always score better?
No. A long response can contain correct vocabulary and still fail to explain the requested relationship. Aim for an explicit claim, suitable evidence, mechanism and evaluation where required. Students should study the assessment expectations of their actual syllabus.
Can a student be good at Geography without being good at drawing?
Yes. Geography involves many kinds of evidence and analysis. Clear, labelled sketches and graphs are useful tools, but artistic decoration is not a substitute for geographical accuracy. Improve technical drawing requirements through focused practice rather than worrying about aesthetic talent.
What does a good improvement plan measure?
Instead of counting only grades or pages completed, measure whether the student reads units accurately, identifies relevant evidence, explains processes without prompting and recognises a study’s limitations. Check these skills on fresh material after a delay.
Useful related reading and authoritative documents
Start with SEAB’s 2027 G2 syllabus list and 2027 G3 syllabus list, and always verify the individual subject PDF appropriate to the student. For complementary training in reasoning from evidence, see 2027 SEC History: Better Source Answers and 2027 Literature in English: Read, Quote and Explain. The subjects are different but share the discipline of proving claims rather than repeating slogans.
For an example of eduKateSG’s close-feedback teaching structure, read the immutable Secondary 1 Mathematics Tutor Clementi — Small Groups Tutorials reference. This is an example of the teaching approach, not an assertion that a Geography class is offered under that Mathematics listing.
Editorial review: October 2026 for the 2027 SEC cycle. Syllabuses, school offerings and local conditions should be checked again when decisions are made. Numerical examples and fieldwork scenarios in this guide are fictional teaching illustrations, not reported research findings.