
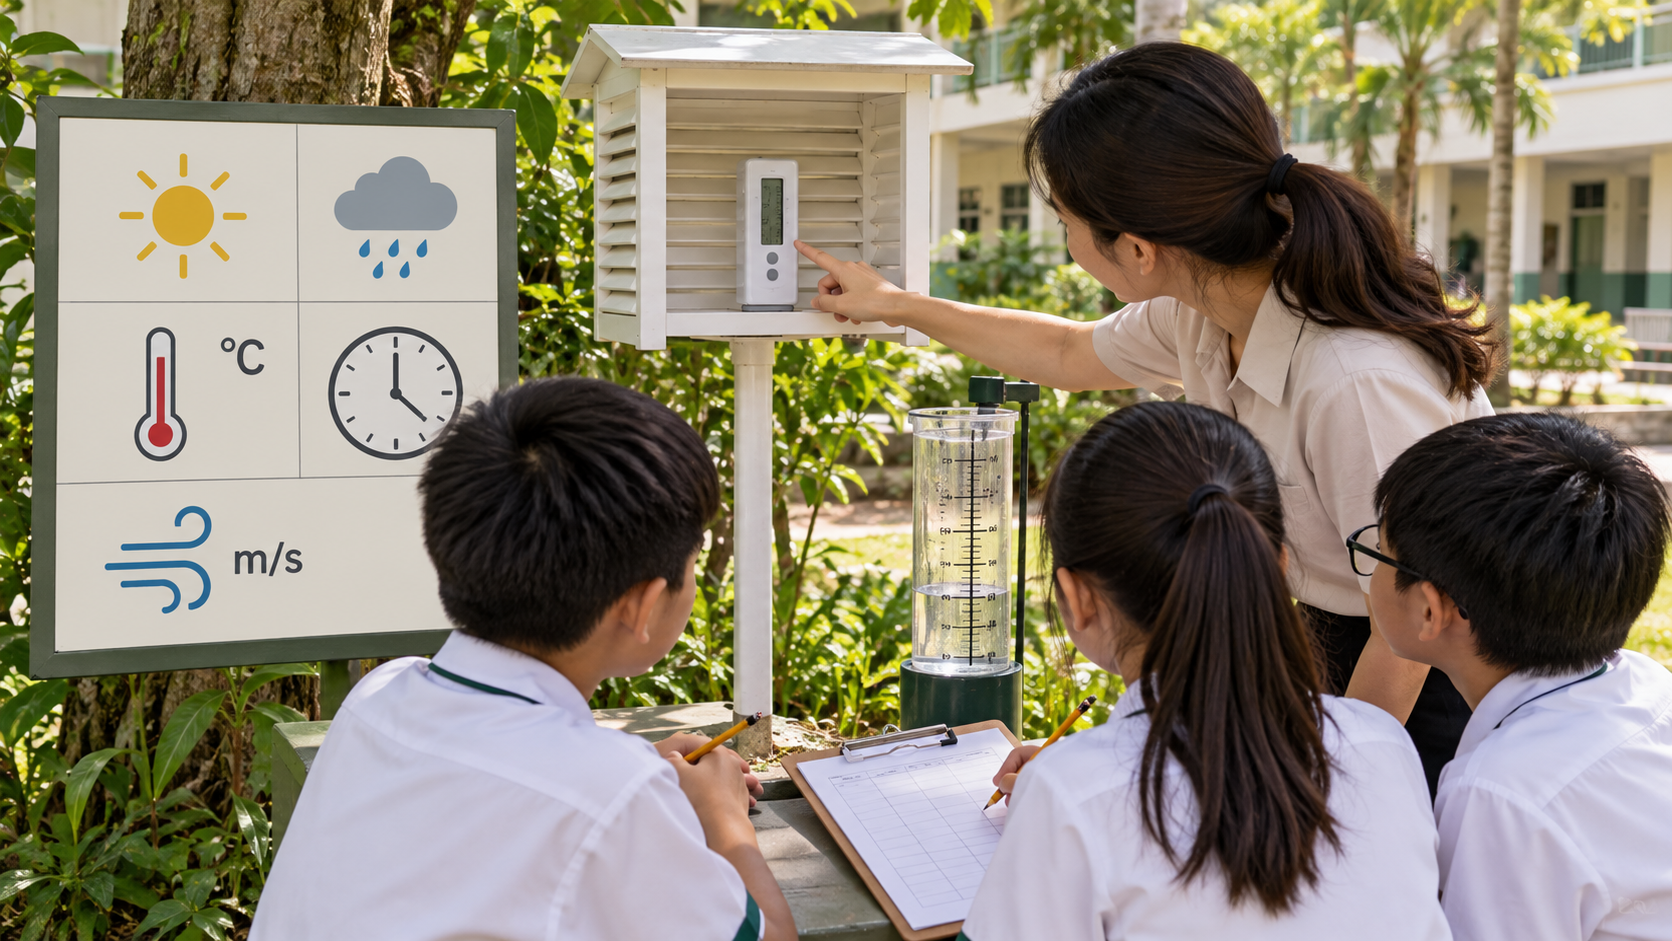
Did you know that a blank space in a pupil’s science table can be a sign of careful work rather than careless work? The temptation is to make the graph look complete. But an invented reading can quietly turn an honest experiment into an unreliable explanation.
A missed observation is a planned measurement that was not actually taken. Record its scheduled time and mark the value as not measured or missing; do not write zero, copy a neighbouring value, or insert a calculated estimate as though it were observed. Then find out why the reading was missed, decide what can still be concluded, and adjust the procedure for the next trial.
First diagnose the gap: what exactly is missing?
A timetable, a measured reading and a calculated estimate are three different things. The timetable says when a measurement was intended. The measured reading records what a person or instrument actually observed. A calculated estimate uses other numbers to suggest a possible value. None can silently substitute for another.
Before saying a pupil has ‘bad data’, ask four questions. Was the time recorded but the value omitted? Did the class forget the time entirely? Was the measuring tool unreadable? Or did the procedure change halfway through? The recovery step depends on that answer. A blank caused by a stopped timer is different from a genuine temperature reading of 0°C.
- Planned but not taken: keep the time and write ‘not measured’.
- Taken but unreadable: retain the time, describe the problem and label the value invalid or unreadable.
- Reading taken at a different time: preserve the actual time; never move it into the intended slot without saying so.
- Reading taken, then lost: record that the value is missing from the working record and explain what remains verifiable.
- Measured zero: use 0 only when the instrument really gave an interpretable zero in its proper units.
Worked example: the missing four-minute temperature reading
This is a fictional teaching example, not a report of a real student’s experiment. A teacher supervises a simple cooling-water demonstration with age-appropriate equipment. The class plans to read the thermometer every two minutes. The notes show: at 0 minutes, 42°C; at 2 minutes, 38°C; at 4 minutes, no reading was taken; at 6 minutes, 31°C; and at 8 minutes, 29°C.
A pupil notices that the temperature fell from 38°C at minute 2 to 31°C at minute 6. The observed drop is 7°C across four minutes, because 38 − 31 = 7 and 6 − 2 = 4. The average decrease over that interval is 7 ÷ 4 = 1.75°C per minute. But that average does not tell us that the thermometer would have shown exactly 34.5°C at minute 4.
A straight-line estimate between 38°C and 31°C would produce 34.5°C halfway through the interval, but cooling need not follow a straight line. That number is a model-based estimate, not a newly discovered observation. If the teacher deliberately wants an interpolation exercise, put the estimate in its own clearly labelled column and explain the assumption. In a primary observation table, keep minute 4 marked ‘not measured’.
How to draw the graph without hiding the missing point
Put elapsed minutes on the horizontal axis and temperature in °C on the vertical axis. Plot only the actual readings: (0, 42), (2, 38), (6, 31), and (8, 29). Note that a reading at 4 minutes is absent. A line joining minute 2 and minute 6 may visually suggest values between them, but it cannot convert them into measurements. If the exercise is specifically about measured observations, markers and a gap note make the limitation more obvious.
Students should read the assignment brief before choosing the display. A teacher may use an interpolating line to illustrate an estimated trend, but the legend or discussion must distinguish observed points from inferred values. A smooth curve is not evidence that the skipped temperature was known.
Five-minute recovery routine for the learner
- Preserve the original: keep the observation sheet, including the missed slot. Do not rewrite history to get an attractive table.
- Describe the interruption: say ‘minute 4 was not measured because the reader was checking another group’s thermometer’ only if that is what actually happened.
- Identify what remains reliable: the observations at minutes 0, 2, 6 and 8 can still be discussed within their limits.
- Check whether the conclusion depends on the gap: a general cooling trend might be supported; the exact temperature at minute 4 is not.
- Repair the procedure: assign a timer caller and a reader, set a quiet reminder, and trial the record sheet before repeating.
- Check independently: give the pupil a different data table with a missed measurement and ask for an honest graph and a restrained conclusion.
What parents and tutors can do without taking over
At home, a parent can use a familiar non-laboratory example: ‘We meant to write down the plant’s height on Wednesday, but we forgot. Should Wednesday be recorded as 0 cm?’ The useful answer is no. A zero would mean the plant’s measured height was zero, which is a different claim. A parent can ask the child to annotate the gap and decide what can be said from the other dates.
A tutor can check the real skill with two contrasting tables. One shows a recorded value of 0; the other shows a missing entry. Ask the student what each means and how the graph should differ. If the pupil treats both as the same, reteach the meaning of a measurement before assigning more graphing practice. That diagnose–explain–practise–check sequence matters more than polishing one worksheet.
Common mistakes, including one that looks sophisticated
The obvious mistake is entering zero. The less obvious mistake is substituting a computer-generated value without flagging it. Spreadsheet charts sometimes draw lines across empty cells; teachers and students should inspect what the software actually displays. Another mistake is calling a reading ‘missing at random’ after one interruption without evidence about the pattern of missingness. If readings disappear during rapid change or only when a sensor misbehaves, the remaining observations may misrepresent the full process.
Do not redraw a supposedly identical line from memory. Do not invent a reason for the missed measurement, either. If the class does not know why it was lost, ‘reason unknown’ is more accurate than a confident story. Equally, a single missed reading does not automatically invalidate every other observation. A sound conclusion identifies both the supported pattern and the unresolved interval.
What progress would look like
Progress is visible when the pupil stops asking, ‘What number should I put in the blank?’ and starts asking, ‘What does the blank mean?’ For a second demonstration, give observations at 1, 3, 5 and 7 minutes, with the 5-minute result unreadable rather than skipped. See whether the student distinguishes an invalid recorded attempt from no attempt at all.
Then ask for a one-sentence conclusion, a one-sentence limitation and a practical improvement. A successful independent answer might say: ‘The recorded temperatures fell across the observed times, but we do not know the missing reading; next time one pupil will call the times while another records.’ This is stronger evidence of understanding than a perfectly connected line.
Frequently asked questions
Can we calculate the missing temperature? You can estimate it for a clearly labelled modelling exercise, but not present it as an actual observation. State the model and its limitations.
Should we repeat the entire experiment? That depends on whether the gap prevents the question from being answered reliably. A repeat may help; it may not be necessary to describe the limited trend already observed.
Does an empty spreadsheet cell mean zero? No. Different software may display or calculate blanks differently. Confirm the settings and keep the original record.
What if the reading was taken ten seconds late? Record the actual time when feasible. Whether the difference matters depends on how quickly the measured quantity changes and what accuracy the task requires.
Further learning
This lesson connects with why a surprising blank control should be investigated and the wider How Education Works library. The eduKate Clementi Mathematics learning benchmark demonstrates why diagnosis, explanation, progressive practice and an independent check belong together. Here the same learning logic protects science data: notice the gap, explain its meaning, repair the procedure and check the learner’s judgement.
A missing result does not need an imaginary number. It needs an honest label, a thoughtful limitation and a better next attempt.