
Did you know? A forecast is not enough to protect a community. Useful warnings must be grounded in risk knowledge, carefully monitored, communicated through trusted channels and supported by appropriate preparedness. This is why claims about the end of a civilisation deserve evidence and careful distinctions rather than fear. The central question is whether people can preserve, restore and renew the capabilities that ordinary life requires.
How a Civilisation Might End | When Early Warnings and Disaster Coordination Fail is Part 18 of eduKate’s longform civilisation series for parents, tutors and students. The article follows the invented town of Signalport to make early warning, responsible risk communication and preparedness easier to understand using safe paper exercises. It does not predict that any society will collapse. A temporary interruption, long-term decline, social transformation and the disappearance of a historical political institution describe different possibilities.
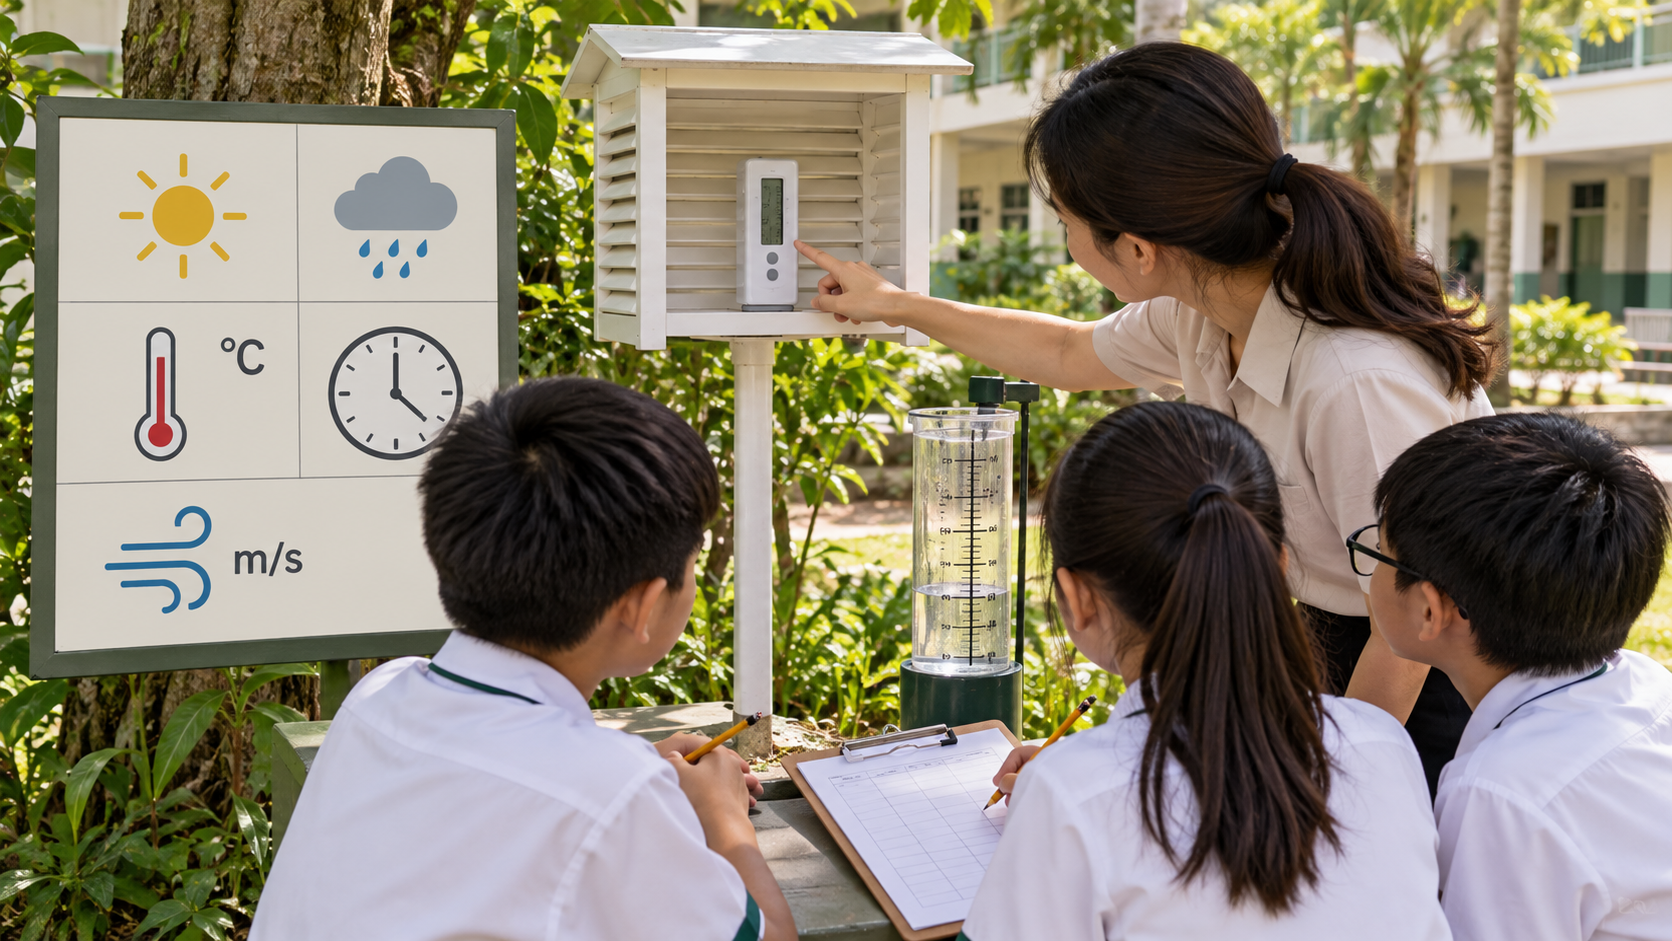
Featured image disclosure: Existing 2026 eduKate school weather-log artwork showing a supervised educational activity; not an official weather forecast or photograph of a disaster. An editorial illustration is not an authentic photograph of a real event and cannot itself prove a historical or scientific claim.
Scope and safeguarding: Do not use fictional exercises to decide real emergency actions, assess a building or interpret a live warning. Follow official current instructions. All diagrams, town examples, fictional families and classroom numbers are invented. The verified sources below provide background and have their own reported years, definitions, jurisdictions and limitations.
Quick answer: how could this weaken a civilisation?
A forecast is not enough to protect a community. Useful warnings must be grounded in risk knowledge, carefully monitored, communicated through trusted channels and supported by appropriate preparedness. Disruption can spread when a service depends on trained people, materials, fair rules, trustworthy information and access to other functioning services. Yet disruption is not automatic extinction. Communities can adapt, reconstruct institutions, preserve cultures, create replacements and improve the repair process. A credible analysis therefore identifies which function stopped, for whom, where and for how long, whether alternative pathways exist and what evidence would establish meaningful restoration.
- First: identify the actual service, right, resource or capability being studied.
- Second: separate a documented event from a conditional prediction.
- Third: trace dependencies without assuming that every failure cascades into the next.
- Fourth: check who can use the service and whose perspective is missing.
- Fifth: compare real outcomes with stated rules, targets or projections using clear units.
- Sixth: choose a proportionate remedy and a later test that measures real improvement.
What the authoritative evidence establishes
The UNDRR Early Warnings for All programme identifies four pillars and aims for universal early-warning protection by the end of 2027. WMO and UNDRR reported that 119 countries had reported multi-hazard early warning systems in their 2025 global status review; this is not the same as universal individual coverage. This background does not describe the paper town or determine the future of any community. Source dates and observation dates can differ, and statistical categories must be preserved. A widely cited global measure cannot be converted into a specific local safety, legal, health or environmental claim without appropriate additional evidence.
To learn from a published report, ask what question it was intended to answer. A demographic projection estimates possible population structure under stated assumptions. A statement of legal principle identifies a norm and must be distinguished from actual enforcement. A warning-system inventory is not proof that every message reached its intended person. A resource outlook may model conditional future demand rather than a fixed outcome. Careful readers identify the units, definitions and limitations rather than using the source as an ornament for a preconceived story.
Complete 29-chapter guide
- 1. A forecast alone cannot protect people
- 2. The four pillars of early warning
- 3. Understanding risk and exposure
- 4. Risks change across time
- 5. Monitoring systems and incomplete data
- 6. Forecast probability and uncertainty
- 7. Decision thresholds and false alarms
- 8. Trusted official warning sources
- 9. Language access and translation
- 10. Accessible formats and diverse needs
- 11. Backup communications and outages
- 12. Community organisations and trusted relay
- 13. Children, schools and safeguarding
- 14. Rumours and corrections
- 15. Preparedness rather than improvisation
- 16. Electricity and warning infrastructure
- 17. Transport coordination and access
- 18. Health services and communication
- 19. Coastal hazards and changing exposure
- 20. Heat and unequal exposure
- 21. Heavy rain and urban flooding
- 22. Regional storms and different local guidance
- 23. Haze, smoke and public information
- 24. Drought and drinking-water systems
- 25. Compound hazards and hidden interdependencies
- 26. After-action review and organisational learning
- 27. What global system counts really mean
- 28. Singapore’s Public Warning System
- 29. Advanced early-warning resilience
Each chapter begins with a practical idea, traces a possible mechanism, identifies evidence that could support or reject the interpretation, considers different residents, explains how a responsible institution could respond, and ends with a paper exercise that parents and tutors can adapt. The numbered examples do not have to be read in one sitting; use the chapter index to locate a particular need, then return to the sources when a factual claim matters.
1. A forecast alone cannot protect people
The clear explanation. Scientific prediction needs risk assessment, accessible communication and appropriate response capacity to be useful. This chapter looks at a concrete piece of early warning, responsible risk communication and preparedness rather than declaring that one problem necessarily ends an entire society. A civilisation is a network of people, accumulated skill, services, relationships and changing institutions. A local weakness deserves investigation even when the wider community remains able to function. It may be serious, but a serious event is not the same thing as the disappearance of a population or its culture.
How this part of the system works
Even an accurate forecast may not reach or help the people who need it. Imagine how this might appear in Signalport, a fictional community invented for this lesson. On a normal day, residents seldom think about every person, tool, record or process that makes the service possible. A visitor sees an open door, a printed rule or a functioning piece of equipment; behind it are less visible dependencies. If one element changes, the results depend on buffers, substitutes, qualified people and the surrounding institutions. Some services remain fully available, some continue at reduced capacity, and some need an orderly alternative.
A useful first move is to isolate one variable at a time. If people cannot complete an ordinary task, find the first confirmed point of difficulty. It may involve staff availability, instructions, a supply, an inaccessible route or a missing authorisation. A mistaken conclusion about cause can lead to the wrong remedy. Record the problem in observable terms and leave room for a competing explanation. For example, a service may have moved to a safer location while an old notice remained on display; that is an information failure, not necessarily a complete loss of capability.
To make the system visible, place five cards on the table in this order: input, trained people, agreed procedure, accessible service, and result for the user. Draw arrows only where a real logical dependency exists in the imagined setting. Then turn one card over and predict which results could change. Another group asks whether the effect must follow or is simply possible. A strong model leaves some arrows uncertain. It also includes a backup card representing alternatives or maintenance, because complex societies often have ways to keep going while one part is being repaired.
What an evidence-led investigation asks
Distinguish hazard prediction, authorised warning, receipt and verified protective outcomes. There is a big difference between observing an outcome and proving its cause. Start with source identity, observation date, location, definition, unit and relevant population. If numbers are reported, keep the denominator and distinguish a total stock from a yearly flow. A forecast describes assumptions and possible future outcomes, while a reported event describes a stated observation. An official policy tells us what is intended or required, but not necessarily whether every person received the promised result. This distinction protects pupils from repeating claims that sound certain but rest on incomplete information.
Consider three possible explanations: the service genuinely became weaker; the service remained similar but the way it was measured or reported changed; or the activity was reorganised and continues through another route. These explanations cannot always all be true. What record would discriminate among them? The responsible researcher asks for an appropriate comparison point instead of choosing the most exciting explanation. If the answer cannot be verified, write “not yet established” and name the evidence that would help. In history, geography and current public information, that is an intellectually valuable answer.
Source quality also depends on relevance. A global report can establish important context for early warning, responsible risk communication and preparedness without measuring every local neighbourhood. A photograph can show appearance without demonstrating policy effectiveness or causality. A student’s paper model can reveal a logical possibility but supplies no real data. A published figure may describe one year even when the page containing it was updated in a later year. Keep those dates separate. If a claim has practical safety or legal consequences, refer to current competent authorities and specialists rather than applying a classroom inference to real life.
Different people see different things
Think about a parent with a limited schedule. Their experience may expose a barrier that an aggregate service count does not show. Meanwhile, another resident may continue receiving the service without difficulty, and a professional may know of a safe workaround that is not publicly visible. A fair explanation asks how these perspectives can be checked and connected without deciding in advance that one person’s experience speaks for everyone. Inaccessible forms, confusing notices or poor coordination matter because public institutions exist to serve real people rather than only to produce good-looking dashboards.
A tutor can ask six respectful questions: Who needs the service? Who is missing from the published data? Is there another way to achieve the intended purpose? Are there relevant differences between users? Would the proposed remedy introduce a new barrier? How could a later reviewer know it worked? None of these questions requires asking a child to disclose private family circumstances, medical information, housing insecurity, legal disputes, employment status or exposure to real hazards. Use fictional characters with neutral descriptions and keep their personal identities entirely invented.
From diagnosis to a credible remedy
Design an end-to-end people-centred warning service. Begin by preserving things that already work and by recognising who has legitimate authority to act. Next, specify one practical improvement, the people affected, the resources it would require and what observation could verify progress. Do not confuse spending with results. An allocated budget is not a repaired road, a published service plan is not proof of access, and an attractive photograph is not evidence of a functioning institution. A defensible response includes trained people, maintenance, privacy and a way to revisit an error.
The correction cycle has four checkpoints. Observe: describe the issue precisely and record its time and scope. Check: use authoritative evidence and challenge the first hypothesis. Improve: choose a proportionate action within appropriate professional responsibility. Review: test whether the person or service is genuinely better off, including users with different access needs. If the later evidence contradicts an earlier conclusion, document the change rather than hiding it. The purpose of accountability is to help people continue living and learning, not to stage blame as a spectacle.
Imagine that the repair succeeded for the easiest cases but not for someone who needs an alternative format. These counterexamples show why good systems need follow-up, clear responsibilities and honesty about limits. They also reveal why a civilisation’s resilience is not simply the number of impressive buildings or digital tools it possesses. People need reliable capability and fair ways to identify problems and improve them.
Worked mathematics: an invented example with correct units
Use 48 coloured paper cards in a quiet paper library. Suppose 5 cards are flagged as requests requiring an additional check. The flagged proportion is 5 ÷ 48 × 100 = 10.4% when rounded to one decimal place. If the fictional clerk verifies that 3 flagged cards have been dealt with appropriately, 2 flagged cards remain open. All quantities are invented for teaching percentages. These cards are not real people, medical cases, court outcomes, hazardous events, risk probabilities or measurements of an actual place.
Now test whether this number tells the full story. Perhaps 48 represents only submitted requests, not everyone who needed help. Perhaps a change in reporting produces more flagged cards even while service quality improves. Perhaps the clerk recorded a closed case without checking whether the intended user was actually helped. A count, a resolution fraction, a waiting time and a meaningful outcome answer different questions. Ask learners to write the unit, denominator, observation date and the main limitation beside every number. They should resist the temptation to turn a neat calculation into a claim about an entire civilisation.
A safe, original activity for parents and tutors
Compare an invented forecast with a clear official-style notice. Use four paper sheets headed “observation”, “evidence”, “alternative explanation” and “follow-up”. The first student explains what is seen in the invented scenario; the second checks what would support the claim. A third seeks someone whose needs were not considered, and a fourth decides what later record could show improvement. The tutor corrects unwarranted certainty and invites pupils to revise their reasoning. This is a non-operational paper exercise, not a professional inspection, public-safety drill, legal opinion, clinical assessment or advice about real environmental conditions.
For young learners, work with one chapter and only three coloured cards. For upper-primary children, ask for a second possible explanation. For secondary pupils, add the percentage calculation and source validity checks. For advanced learners, introduce a system diagram with several dependencies, an explicit counterexample and a comparison across two periods. In every version, assess whether the student can explain in their own words what would make the intervention fair and what evidence is still missing. The ideal outcome is independent judgement and humane problem-solving, not perfect agreement or a dramatic prediction.
Test the explanation without looking back
- Define: Scientific prediction needs risk assessment, accessible communication and appropriate response capacity to be useful.
- Trace: Even an accurate forecast may not reach or help the people who need it.
- Check: Distinguish hazard prediction, authorised warning, receipt and verified protective outcomes.
- Correct: Design an end-to-end people-centred warning service.
- Practise: Compare an invented forecast with a clear official-style notice.
- Limit: Explain why the imaginary Signalport model cannot establish the fate of a real society.
Finish with a handover statement that can be understood by the next learner: “The issue I investigated is … . The first claim is … . My source would be … . One competing explanation is … . I would make the process fairer by … . I would know the remedy worked when … . An important remaining uncertainty is … .” A child who can produce such a statement is learning the habit that civilisations themselves require: keeping knowledge usable, correcting errors, protecting people and handing functioning systems to those who come next.
2. The four pillars of early warning
The clear explanation. Risk knowledge, monitoring, dissemination and preparedness have related but different functions. This chapter looks at a concrete piece of early warning, responsible risk communication and preparedness rather than declaring that one problem necessarily ends an entire society. A civilisation is a network of people, accumulated skill, services, relationships and changing institutions. A local weakness deserves investigation even when the wider community remains able to function. It may be serious, but a serious event is not the same thing as the disappearance of a population or its culture.
How this part of the system works
A strong technical forecast cannot compensate for a broken last-mile communication process. Imagine how this might appear in Signalport, a fictional community invented for this lesson. On a normal day, residents seldom think about every person, tool, record or process that makes the service possible. A visitor sees an open door, a printed rule or a functioning piece of equipment; behind it are less visible dependencies. If one element changes, the results depend on buffers, substitutes, qualified people and the surrounding institutions. Some services remain fully available, some continue at reduced capacity, and some need an orderly alternative.
Begin with a service user’s experience, not with a dramatic headline. If people cannot complete an ordinary task, find the first confirmed point of difficulty. It may involve staff availability, instructions, a supply, an inaccessible route or a missing authorisation. A mistaken conclusion about cause can lead to the wrong remedy. Record the problem in observable terms and leave room for a competing explanation. For example, a service may have moved to a safer location while an old notice remained on display; that is an information failure, not necessarily a complete loss of capability.
To make the system visible, place five cards on the table in this order: input, trained people, agreed procedure, accessible service, and result for the user. Draw arrows only where a real logical dependency exists in the imagined setting. Then turn one card over and predict which results could change. Another group asks whether the effect must follow or is simply possible. A strong model leaves some arrows uncertain. It also includes a backup card representing alternatives or maintenance, because complex societies often have ways to keep going while one part is being repaired.
What an evidence-led investigation asks
Use UNDRR’s definitions and check each pillar independently. There is a big difference between observing an outcome and proving its cause. Start with source identity, observation date, location, definition, unit and relevant population. If numbers are reported, keep the denominator and distinguish a total stock from a yearly flow. A forecast describes assumptions and possible future outcomes, while a reported event describes a stated observation. An official policy tells us what is intended or required, but not necessarily whether every person received the promised result. This distinction protects pupils from repeating claims that sound certain but rest on incomplete information.
Consider three possible explanations: the service genuinely became weaker; the service remained similar but the way it was measured or reported changed; or the activity was reorganised and continues through another route. These explanations cannot always all be true. What record would discriminate among them? The responsible researcher asks for an appropriate comparison point instead of choosing the most exciting explanation. If the answer cannot be verified, write “not yet established” and name the evidence that would help. In history, geography and current public information, that is an intellectually valuable answer.
Source quality also depends on relevance. A global report can establish important context for early warning, responsible risk communication and preparedness without measuring every local neighbourhood. A photograph can show appearance without demonstrating policy effectiveness or causality. A student’s paper model can reveal a logical possibility but supplies no real data. A published figure may describe one year even when the page containing it was updated in a later year. Keep those dates separate. If a claim has practical safety or legal consequences, refer to current competent authorities and specialists rather than applying a classroom inference to real life.
Different people see different things
Think about a student using a school service. Their experience may expose a barrier that an aggregate service count does not show. Meanwhile, another resident may continue receiving the service without difficulty, and a professional may know of a safe workaround that is not publicly visible. A fair explanation asks how these perspectives can be checked and connected without deciding in advance that one person’s experience speaks for everyone. Inaccessible forms, confusing notices or poor coordination matter because public institutions exist to serve real people rather than only to produce good-looking dashboards.
A tutor can ask six respectful questions: Who needs the service? Who is missing from the published data? Is there another way to achieve the intended purpose? Are there relevant differences between users? Would the proposed remedy introduce a new barrier? How could a later reviewer know it worked? None of these questions requires asking a child to disclose private family circumstances, medical information, housing insecurity, legal disputes, employment status or exposure to real hazards. Use fictional characters with neutral descriptions and keep their personal identities entirely invented.
From diagnosis to a credible remedy
Assign responsibility and test handovers between the functions. Begin by preserving things that already work and by recognising who has legitimate authority to act. Next, specify one practical improvement, the people affected, the resources it would require and what observation could verify progress. Do not confuse spending with results. An allocated budget is not a repaired road, a published service plan is not proof of access, and an attractive photograph is not evidence of a functioning institution. A defensible response includes trained people, maintenance, privacy and a way to revisit an error.
The correction cycle has four checkpoints. Observe: describe the issue precisely and record its time and scope. Check: use authoritative evidence and challenge the first hypothesis. Improve: choose a proportionate action within appropriate professional responsibility. Review: test whether the person or service is genuinely better off, including users with different access needs. If the later evidence contradicts an earlier conclusion, document the change rather than hiding it. The purpose of accountability is to help people continue living and learning, not to stage blame as a spectacle.
Suppose the fictional service now reports a faster average but a few users wait much longer than before. These counterexamples show why good systems need follow-up, clear responsibilities and honesty about limits. They also reveal why a civilisation’s resilience is not simply the number of impressive buildings or digital tools it possesses. People need reliable capability and fair ways to identify problems and improve them.
Worked mathematics: an invented example with correct units
Use 55 coloured paper cards in a fictional service desk. Suppose 8 cards are flagged as requests requiring an additional check. The flagged proportion is 8 ÷ 55 × 100 = 14.5% when rounded to one decimal place. If the fictional clerk verifies that 7 flagged cards have been dealt with appropriately, 1 flagged cards remain open. All quantities are invented for teaching percentages. These cards are not real people, medical cases, court outcomes, hazardous events, risk probabilities or measurements of an actual place.
Now test whether this number tells the full story. Perhaps 55 represents only submitted requests, not everyone who needed help. Perhaps a change in reporting produces more flagged cards even while service quality improves. Perhaps the clerk recorded a closed case without checking whether the intended user was actually helped. A count, a resolution fraction, a waiting time and a meaningful outcome answer different questions. Ask learners to write the unit, denominator, observation date and the main limitation beside every number. They should resist the temptation to turn a neat calculation into a claim about an entire civilisation.
A safe, original activity for parents and tutors
Make four cardboard cards and remove one dependency. Use four paper sheets headed “observation”, “evidence”, “alternative explanation” and “follow-up”. The first student explains what is seen in the invented scenario; the second checks what would support the claim. A third seeks someone whose needs were not considered, and a fourth decides what later record could show improvement. The tutor corrects unwarranted certainty and invites pupils to revise their reasoning. This is a non-operational paper exercise, not a professional inspection, public-safety drill, legal opinion, clinical assessment or advice about real environmental conditions.
For young learners, work with one chapter and only three coloured cards. For upper-primary children, ask for a second possible explanation. For secondary pupils, add the percentage calculation and source validity checks. For advanced learners, introduce a system diagram with several dependencies, an explicit counterexample and a comparison across two periods. In every version, assess whether the student can explain in their own words what would make the intervention fair and what evidence is still missing. The ideal outcome is independent judgement and humane problem-solving, not perfect agreement or a dramatic prediction.
Test the explanation without looking back
- Define: Risk knowledge, monitoring, dissemination and preparedness have related but different functions.
- Trace: A strong technical forecast cannot compensate for a broken last-mile communication process.
- Check: Use UNDRR’s definitions and check each pillar independently.
- Correct: Assign responsibility and test handovers between the functions.
- Practise: Make four cardboard cards and remove one dependency.
- Limit: Explain why the imaginary Signalport model cannot establish the fate of a real society.
Finish with a handover statement that can be understood by the next learner: “The issue I investigated is … . The first claim is … . My source would be … . One competing explanation is … . I would make the process fairer by … . I would know the remedy worked when … . An important remaining uncertainty is … .” A child who can produce such a statement is learning the habit that civilisations themselves require: keeping knowledge usable, correcting errors, protecting people and handing functioning systems to those who come next.
3. Understanding risk and exposure
The clear explanation. Hazard knowledge must consider where people, assets and services are exposed to potential harm. This chapter looks at a concrete piece of early warning, responsible risk communication and preparedness rather than declaring that one problem necessarily ends an entire society. A civilisation is a network of people, accumulated skill, services, relationships and changing institutions. A local weakness deserves investigation even when the wider community remains able to function. It may be serious, but a serious event is not the same thing as the disappearance of a population or its culture.
How this part of the system works
A region-wide map may miss vulnerable neighbourhoods or changing local conditions. Imagine how this might appear in Signalport, a fictional community invented for this lesson. On a normal day, residents seldom think about every person, tool, record or process that makes the service possible. A visitor sees an open door, a printed rule or a functioning piece of equipment; behind it are less visible dependencies. If one element changes, the results depend on buffers, substitutes, qualified people and the surrounding institutions. Some services remain fully available, some continue at reduced capacity, and some need an orderly alternative.
The most revealing question is often what people can still do. If people cannot complete an ordinary task, find the first confirmed point of difficulty. It may involve staff availability, instructions, a supply, an inaccessible route or a missing authorisation. A mistaken conclusion about cause can lead to the wrong remedy. Record the problem in observable terms and leave room for a competing explanation. For example, a service may have moved to a safer location while an old notice remained on display; that is an information failure, not necessarily a complete loss of capability.
To make the system visible, place five cards on the table in this order: input, trained people, agreed procedure, accessible service, and result for the user. Draw arrows only where a real logical dependency exists in the imagined setting. Then turn one card over and predict which results could change. Another group asks whether the effect must follow or is simply possible. A strong model leaves some arrows uncertain. It also includes a backup card representing alternatives or maintenance, because complex societies often have ways to keep going while one part is being repaired.
What an evidence-led investigation asks
Check boundary, scale, source, date and population assumptions. There is a big difference between observing an outcome and proving its cause. Start with source identity, observation date, location, definition, unit and relevant population. If numbers are reported, keep the denominator and distinguish a total stock from a yearly flow. A forecast describes assumptions and possible future outcomes, while a reported event describes a stated observation. An official policy tells us what is intended or required, but not necessarily whether every person received the promised result. This distinction protects pupils from repeating claims that sound certain but rest on incomplete information.
Consider three possible explanations: the service genuinely became weaker; the service remained similar but the way it was measured or reported changed; or the activity was reorganised and continues through another route. These explanations cannot always all be true. What record would discriminate among them? The responsible researcher asks for an appropriate comparison point instead of choosing the most exciting explanation. If the answer cannot be verified, write “not yet established” and name the evidence that would help. In history, geography and current public information, that is an intellectually valuable answer.
Source quality also depends on relevance. A global report can establish important context for early warning, responsible risk communication and preparedness without measuring every local neighbourhood. A photograph can show appearance without demonstrating policy effectiveness or causality. A student’s paper model can reveal a logical possibility but supplies no real data. A published figure may describe one year even when the page containing it was updated in a later year. Keep those dates separate. If a claim has practical safety or legal consequences, refer to current competent authorities and specialists rather than applying a classroom inference to real life.
Different people see different things
Think about a trained worker reviewing a record. Their experience may expose a barrier that an aggregate service count does not show. Meanwhile, another resident may continue receiving the service without difficulty, and a professional may know of a safe workaround that is not publicly visible. A fair explanation asks how these perspectives can be checked and connected without deciding in advance that one person’s experience speaks for everyone. Inaccessible forms, confusing notices or poor coordination matter because public institutions exist to serve real people rather than only to produce good-looking dashboards.
A tutor can ask six respectful questions: Who needs the service? Who is missing from the published data? Is there another way to achieve the intended purpose? Are there relevant differences between users? Would the proposed remedy introduce a new barrier? How could a later reviewer know it worked? None of these questions requires asking a child to disclose private family circumstances, medical information, housing insecurity, legal disputes, employment status or exposure to real hazards. Use fictional characters with neutral descriptions and keep their personal identities entirely invented.
From diagnosis to a credible remedy
Include local knowledge within qualified assessment. Begin by preserving things that already work and by recognising who has legitimate authority to act. Next, specify one practical improvement, the people affected, the resources it would require and what observation could verify progress. Do not confuse spending with results. An allocated budget is not a repaired road, a published service plan is not proof of access, and an attractive photograph is not evidence of a functioning institution. A defensible response includes trained people, maintenance, privacy and a way to revisit an error.
The correction cycle has four checkpoints. Observe: describe the issue precisely and record its time and scope. Check: use authoritative evidence and challenge the first hypothesis. Improve: choose a proportionate action within appropriate professional responsibility. Review: test whether the person or service is genuinely better off, including users with different access needs. If the later evidence contradicts an earlier conclusion, document the change rather than hiding it. The purpose of accountability is to help people continue living and learning, not to stage blame as a spectacle.
What if a cheaper short-term fix prevents the next group from maintaining the improvement? These counterexamples show why good systems need follow-up, clear responsibilities and honesty about limits. They also reveal why a civilisation’s resilience is not simply the number of impressive buildings or digital tools it possesses. People need reliable capability and fair ways to identify problems and improve them.
Worked mathematics: an invented example with correct units
Use 62 coloured paper cards in an invented town square. Suppose 11 cards are flagged as requests requiring an additional check. The flagged proportion is 11 ÷ 62 × 100 = 17.7% when rounded to one decimal place. If the fictional clerk verifies that 10 flagged cards have been dealt with appropriately, 1 flagged cards remain open. All quantities are invented for teaching percentages. These cards are not real people, medical cases, court outcomes, hazardous events, risk probabilities or measurements of an actual place.
Now test whether this number tells the full story. Perhaps 62 represents only submitted requests, not everyone who needed help. Perhaps a change in reporting produces more flagged cards even while service quality improves. Perhaps the clerk recorded a closed case without checking whether the intended user was actually helped. A count, a resolution fraction, a waiting time and a meaningful outcome answer different questions. Ask learners to write the unit, denominator, observation date and the main limitation beside every number. They should resist the temptation to turn a neat calculation into a claim about an entire civilisation.
A safe, original activity for parents and tutors
Draw two fictional maps with different denominators. Use four paper sheets headed “observation”, “evidence”, “alternative explanation” and “follow-up”. The first student explains what is seen in the invented scenario; the second checks what would support the claim. A third seeks someone whose needs were not considered, and a fourth decides what later record could show improvement. The tutor corrects unwarranted certainty and invites pupils to revise their reasoning. This is a non-operational paper exercise, not a professional inspection, public-safety drill, legal opinion, clinical assessment or advice about real environmental conditions.
For young learners, work with one chapter and only three coloured cards. For upper-primary children, ask for a second possible explanation. For secondary pupils, add the percentage calculation and source validity checks. For advanced learners, introduce a system diagram with several dependencies, an explicit counterexample and a comparison across two periods. In every version, assess whether the student can explain in their own words what would make the intervention fair and what evidence is still missing. The ideal outcome is independent judgement and humane problem-solving, not perfect agreement or a dramatic prediction.
Test the explanation without looking back
- Define: Hazard knowledge must consider where people, assets and services are exposed to potential harm.
- Trace: A region-wide map may miss vulnerable neighbourhoods or changing local conditions.
- Check: Check boundary, scale, source, date and population assumptions.
- Correct: Include local knowledge within qualified assessment.
- Practise: Draw two fictional maps with different denominators.
- Limit: Explain why the imaginary Signalport model cannot establish the fate of a real society.
Finish with a handover statement that can be understood by the next learner: “The issue I investigated is … . The first claim is … . My source would be … . One competing explanation is … . I would make the process fairer by … . I would know the remedy worked when … . An important remaining uncertainty is … .” A child who can produce such a statement is learning the habit that civilisations themselves require: keeping knowledge usable, correcting errors, protecting people and handing functioning systems to those who come next.
4. Risks change across time
The clear explanation. Environmental changes, settlement patterns and infrastructure can alter exposure. This chapter looks at a concrete piece of early warning, responsible risk communication and preparedness rather than declaring that one problem necessarily ends an entire society. A civilisation is a network of people, accumulated skill, services, relationships and changing institutions. A local weakness deserves investigation even when the wider community remains able to function. It may be serious, but a serious event is not the same thing as the disappearance of a population or its culture.
How this part of the system works
Old assumptions may no longer describe contemporary conditions. Imagine how this might appear in Signalport, a fictional community invented for this lesson. On a normal day, residents seldom think about every person, tool, record or process that makes the service possible. A visitor sees an open door, a printed rule or a functioning piece of equipment; behind it are less visible dependencies. If one element changes, the results depend on buffers, substitutes, qualified people and the surrounding institutions. Some services remain fully available, some continue at reduced capacity, and some need an orderly alternative.
Treat a disruption as a hypothesis about dependencies, not an automatic cascade. If people cannot complete an ordinary task, find the first confirmed point of difficulty. It may involve staff availability, instructions, a supply, an inaccessible route or a missing authorisation. A mistaken conclusion about cause can lead to the wrong remedy. Record the problem in observable terms and leave room for a competing explanation. For example, a service may have moved to a safer location while an old notice remained on display; that is an information failure, not necessarily a complete loss of capability.
To make the system visible, place five cards on the table in this order: input, trained people, agreed procedure, accessible service, and result for the user. Draw arrows only where a real logical dependency exists in the imagined setting. Then turn one card over and predict which results could change. Another group asks whether the effect must follow or is simply possible. A strong model leaves some arrows uncertain. It also includes a backup card representing alternatives or maintenance, because complex societies often have ways to keep going while one part is being repaired.
What an evidence-led investigation asks
Separate measured change from speculative future scenarios. There is a big difference between observing an outcome and proving its cause. Start with source identity, observation date, location, definition, unit and relevant population. If numbers are reported, keep the denominator and distinguish a total stock from a yearly flow. A forecast describes assumptions and possible future outcomes, while a reported event describes a stated observation. An official policy tells us what is intended or required, but not necessarily whether every person received the promised result. This distinction protects pupils from repeating claims that sound certain but rest on incomplete information.
Consider three possible explanations: the service genuinely became weaker; the service remained similar but the way it was measured or reported changed; or the activity was reorganised and continues through another route. These explanations cannot always all be true. What record would discriminate among them? The responsible researcher asks for an appropriate comparison point instead of choosing the most exciting explanation. If the answer cannot be verified, write “not yet established” and name the evidence that would help. In history, geography and current public information, that is an intellectually valuable answer.
Source quality also depends on relevance. A global report can establish important context for early warning, responsible risk communication and preparedness without measuring every local neighbourhood. A photograph can show appearance without demonstrating policy effectiveness or causality. A student’s paper model can reveal a logical possibility but supplies no real data. A published figure may describe one year even when the page containing it was updated in a later year. Keep those dates separate. If a claim has practical safety or legal consequences, refer to current competent authorities and specialists rather than applying a classroom inference to real life.
Different people see different things
Think about an older resident travelling to a service. Their experience may expose a barrier that an aggregate service count does not show. Meanwhile, another resident may continue receiving the service without difficulty, and a professional may know of a safe workaround that is not publicly visible. A fair explanation asks how these perspectives can be checked and connected without deciding in advance that one person’s experience speaks for everyone. Inaccessible forms, confusing notices or poor coordination matter because public institutions exist to serve real people rather than only to produce good-looking dashboards.
A tutor can ask six respectful questions: Who needs the service? Who is missing from the published data? Is there another way to achieve the intended purpose? Are there relevant differences between users? Would the proposed remedy introduce a new barrier? How could a later reviewer know it worked? None of these questions requires asking a child to disclose private family circumstances, medical information, housing insecurity, legal disputes, employment status or exposure to real hazards. Use fictional characters with neutral descriptions and keep their personal identities entirely invented.
From diagnosis to a credible remedy
Update documented risk assessment through responsible organisations. Begin by preserving things that already work and by recognising who has legitimate authority to act. Next, specify one practical improvement, the people affected, the resources it would require and what observation could verify progress. Do not confuse spending with results. An allocated budget is not a repaired road, a published service plan is not proof of access, and an attractive photograph is not evidence of a functioning institution. A defensible response includes trained people, maintenance, privacy and a way to revisit an error.
The correction cycle has four checkpoints. Observe: describe the issue precisely and record its time and scope. Check: use authoritative evidence and challenge the first hypothesis. Improve: choose a proportionate action within appropriate professional responsibility. Review: test whether the person or service is genuinely better off, including users with different access needs. If the later evidence contradicts an earlier conclusion, document the change rather than hiding it. The purpose of accountability is to help people continue living and learning, not to stage blame as a spectacle.
What happens when the person who designed the process is absent and no usable handover exists? These counterexamples show why good systems need follow-up, clear responsibilities and honesty about limits. They also reveal why a civilisation’s resilience is not simply the number of impressive buildings or digital tools it possesses. People need reliable capability and fair ways to identify problems and improve them.
Worked mathematics: an invented example with correct units
Use 69 coloured paper cards in a classroom model street. Suppose 14 cards are flagged as requests requiring an additional check. The flagged proportion is 14 ÷ 69 × 100 = 20.3% when rounded to one decimal place. If the fictional clerk verifies that 6 flagged cards have been dealt with appropriately, 8 flagged cards remain open. All quantities are invented for teaching percentages. These cards are not real people, medical cases, court outcomes, hazardous events, risk probabilities or measurements of an actual place.
Now test whether this number tells the full story. Perhaps 69 represents only submitted requests, not everyone who needed help. Perhaps a change in reporting produces more flagged cards even while service quality improves. Perhaps the clerk recorded a closed case without checking whether the intended user was actually helped. A count, a resolution fraction, a waiting time and a meaningful outcome answer different questions. Ask learners to write the unit, denominator, observation date and the main limitation beside every number. They should resist the temptation to turn a neat calculation into a claim about an entire civilisation.
A safe, original activity for parents and tutors
Compare imaginary maps with different revision dates. Use four paper sheets headed “observation”, “evidence”, “alternative explanation” and “follow-up”. The first student explains what is seen in the invented scenario; the second checks what would support the claim. A third seeks someone whose needs were not considered, and a fourth decides what later record could show improvement. The tutor corrects unwarranted certainty and invites pupils to revise their reasoning. This is a non-operational paper exercise, not a professional inspection, public-safety drill, legal opinion, clinical assessment or advice about real environmental conditions.
For young learners, work with one chapter and only three coloured cards. For upper-primary children, ask for a second possible explanation. For secondary pupils, add the percentage calculation and source validity checks. For advanced learners, introduce a system diagram with several dependencies, an explicit counterexample and a comparison across two periods. In every version, assess whether the student can explain in their own words what would make the intervention fair and what evidence is still missing. The ideal outcome is independent judgement and humane problem-solving, not perfect agreement or a dramatic prediction.
Test the explanation without looking back
- Define: Environmental changes, settlement patterns and infrastructure can alter exposure.
- Trace: Old assumptions may no longer describe contemporary conditions.
- Check: Separate measured change from speculative future scenarios.
- Correct: Update documented risk assessment through responsible organisations.
- Practise: Compare imaginary maps with different revision dates.
- Limit: Explain why the imaginary Signalport model cannot establish the fate of a real society.
Finish with a handover statement that can be understood by the next learner: “The issue I investigated is … . The first claim is … . My source would be … . One competing explanation is … . I would make the process fairer by … . I would know the remedy worked when … . An important remaining uncertainty is … .” A child who can produce such a statement is learning the habit that civilisations themselves require: keeping knowledge usable, correcting errors, protecting people and handing functioning systems to those who come next.
5. Monitoring systems and incomplete data
The clear explanation. Observations depend on reliable sensors, calibration, maintenance and responsible quality checking. This chapter looks at a concrete piece of early warning, responsible risk communication and preparedness rather than declaring that one problem necessarily ends an entire society. A civilisation is a network of people, accumulated skill, services, relationships and changing institutions. A local weakness deserves investigation even when the wider community remains able to function. It may be serious, but a serious event is not the same thing as the disappearance of a population or its culture.
How this part of the system works
Missing records can create false certainty if data gaps are not disclosed. Imagine how this might appear in Signalport, a fictional community invented for this lesson. On a normal day, residents seldom think about every person, tool, record or process that makes the service possible. A visitor sees an open door, a printed rule or a functioning piece of equipment; behind it are less visible dependencies. If one element changes, the results depend on buffers, substitutes, qualified people and the surrounding institutions. Some services remain fully available, some continue at reduced capacity, and some need an orderly alternative.
Consider how an official-looking notice can differ from the real service experience. If people cannot complete an ordinary task, find the first confirmed point of difficulty. It may involve staff availability, instructions, a supply, an inaccessible route or a missing authorisation. A mistaken conclusion about cause can lead to the wrong remedy. Record the problem in observable terms and leave room for a competing explanation. For example, a service may have moved to a safer location while an old notice remained on display; that is an information failure, not necessarily a complete loss of capability.
To make the system visible, place five cards on the table in this order: input, trained people, agreed procedure, accessible service, and result for the user. Draw arrows only where a real logical dependency exists in the imagined setting. Then turn one card over and predict which results could change. Another group asks whether the effect must follow or is simply possible. A strong model leaves some arrows uncertain. It also includes a backup card representing alternatives or maintenance, because complex societies often have ways to keep going while one part is being repaired.
What an evidence-led investigation asks
Examine instrument units, locations, timestamps and uncertainty. There is a big difference between observing an outcome and proving its cause. Start with source identity, observation date, location, definition, unit and relevant population. If numbers are reported, keep the denominator and distinguish a total stock from a yearly flow. A forecast describes assumptions and possible future outcomes, while a reported event describes a stated observation. An official policy tells us what is intended or required, but not necessarily whether every person received the promised result. This distinction protects pupils from repeating claims that sound certain but rest on incomplete information.
Consider three possible explanations: the service genuinely became weaker; the service remained similar but the way it was measured or reported changed; or the activity was reorganised and continues through another route. These explanations cannot always all be true. What record would discriminate among them? The responsible researcher asks for an appropriate comparison point instead of choosing the most exciting explanation. If the answer cannot be verified, write “not yet established” and name the evidence that would help. In history, geography and current public information, that is an intellectually valuable answer.
Source quality also depends on relevance. A global report can establish important context for early warning, responsible risk communication and preparedness without measuring every local neighbourhood. A photograph can show appearance without demonstrating policy effectiveness or causality. A student’s paper model can reveal a logical possibility but supplies no real data. A published figure may describe one year even when the page containing it was updated in a later year. Keep those dates separate. If a claim has practical safety or legal consequences, refer to current competent authorities and specialists rather than applying a classroom inference to real life.
Different people see different things
Think about a newcomer seeking clear information. Their experience may expose a barrier that an aggregate service count does not show. Meanwhile, another resident may continue receiving the service without difficulty, and a professional may know of a safe workaround that is not publicly visible. A fair explanation asks how these perspectives can be checked and connected without deciding in advance that one person’s experience speaks for everyone. Inaccessible forms, confusing notices or poor coordination matter because public institutions exist to serve real people rather than only to produce good-looking dashboards.
A tutor can ask six respectful questions: Who needs the service? Who is missing from the published data? Is there another way to achieve the intended purpose? Are there relevant differences between users? Would the proposed remedy introduce a new barrier? How could a later reviewer know it worked? None of these questions requires asking a child to disclose private family circumstances, medical information, housing insecurity, legal disputes, employment status or exposure to real hazards. Use fictional characters with neutral descriptions and keep their personal identities entirely invented.
From diagnosis to a credible remedy
Maintain observations and report quality limits transparently. Begin by preserving things that already work and by recognising who has legitimate authority to act. Next, specify one practical improvement, the people affected, the resources it would require and what observation could verify progress. Do not confuse spending with results. An allocated budget is not a repaired road, a published service plan is not proof of access, and an attractive photograph is not evidence of a functioning institution. A defensible response includes trained people, maintenance, privacy and a way to revisit an error.
The correction cycle has four checkpoints. Observe: describe the issue precisely and record its time and scope. Check: use authoritative evidence and challenge the first hypothesis. Improve: choose a proportionate action within appropriate professional responsibility. Review: test whether the person or service is genuinely better off, including users with different access needs. If the later evidence contradicts an earlier conclusion, document the change rather than hiding it. The purpose of accountability is to help people continue living and learning, not to stage blame as a spectacle.
Imagine that the first explanation was wrong but the institution has already announced a solution. These counterexamples show why good systems need follow-up, clear responsibilities and honesty about limits. They also reveal why a civilisation’s resilience is not simply the number of impressive buildings or digital tools it possesses. People need reliable capability and fair ways to identify problems and improve them.
Worked mathematics: an invented example with correct units
Use 76 coloured paper cards in a mock community timetable. Suppose 17 cards are flagged as requests requiring an additional check. The flagged proportion is 17 ÷ 76 × 100 = 22.4% when rounded to one decimal place. If the fictional clerk verifies that 10 flagged cards have been dealt with appropriately, 7 flagged cards remain open. All quantities are invented for teaching percentages. These cards are not real people, medical cases, court outcomes, hazardous events, risk probabilities or measurements of an actual place.
Now test whether this number tells the full story. Perhaps 76 represents only submitted requests, not everyone who needed help. Perhaps a change in reporting produces more flagged cards even while service quality improves. Perhaps the clerk recorded a closed case without checking whether the intended user was actually helped. A count, a resolution fraction, a waiting time and a meaningful outcome answer different questions. Ask learners to write the unit, denominator, observation date and the main limitation beside every number. They should resist the temptation to turn a neat calculation into a claim about an entire civilisation.
A safe, original activity for parents and tutors
Identify missing dates in an invented classroom weather log. Use four paper sheets headed “observation”, “evidence”, “alternative explanation” and “follow-up”. The first student explains what is seen in the invented scenario; the second checks what would support the claim. A third seeks someone whose needs were not considered, and a fourth decides what later record could show improvement. The tutor corrects unwarranted certainty and invites pupils to revise their reasoning. This is a non-operational paper exercise, not a professional inspection, public-safety drill, legal opinion, clinical assessment or advice about real environmental conditions.
For young learners, work with one chapter and only three coloured cards. For upper-primary children, ask for a second possible explanation. For secondary pupils, add the percentage calculation and source validity checks. For advanced learners, introduce a system diagram with several dependencies, an explicit counterexample and a comparison across two periods. In every version, assess whether the student can explain in their own words what would make the intervention fair and what evidence is still missing. The ideal outcome is independent judgement and humane problem-solving, not perfect agreement or a dramatic prediction.
Test the explanation without looking back
- Define: Observations depend on reliable sensors, calibration, maintenance and responsible quality checking.
- Trace: Missing records can create false certainty if data gaps are not disclosed.
- Check: Examine instrument units, locations, timestamps and uncertainty.
- Correct: Maintain observations and report quality limits transparently.
- Practise: Identify missing dates in an invented classroom weather log.
- Limit: Explain why the imaginary Signalport model cannot establish the fate of a real society.
Finish with a handover statement that can be understood by the next learner: “The issue I investigated is … . The first claim is … . My source would be … . One competing explanation is … . I would make the process fairer by … . I would know the remedy worked when … . An important remaining uncertainty is … .” A child who can produce such a statement is learning the habit that civilisations themselves require: keeping knowledge usable, correcting errors, protecting people and handing functioning systems to those who come next.
6. Forecast probability and uncertainty
The clear explanation. A forecast can express likelihood without asserting that one outcome will certainly occur. This chapter looks at a concrete piece of early warning, responsible risk communication and preparedness rather than declaring that one problem necessarily ends an entire society. A civilisation is a network of people, accumulated skill, services, relationships and changing institutions. A local weakness deserves investigation even when the wider community remains able to function. It may be serious, but a serious event is not the same thing as the disappearance of a population or its culture.
How this part of the system works
Media accounts may remove caveats and turn probability into an absolute claim. Imagine how this might appear in Signalport, a fictional community invented for this lesson. On a normal day, residents seldom think about every person, tool, record or process that makes the service possible. A visitor sees an open door, a printed rule or a functioning piece of equipment; behind it are less visible dependencies. If one element changes, the results depend on buffers, substitutes, qualified people and the surrounding institutions. Some services remain fully available, some continue at reduced capacity, and some need an orderly alternative.
A useful first move is to isolate one variable at a time. If people cannot complete an ordinary task, find the first confirmed point of difficulty. It may involve staff availability, instructions, a supply, an inaccessible route or a missing authorisation. A mistaken conclusion about cause can lead to the wrong remedy. Record the problem in observable terms and leave room for a competing explanation. For example, a service may have moved to a safer location while an old notice remained on display; that is an information failure, not necessarily a complete loss of capability.
To make the system visible, place five cards on the table in this order: input, trained people, agreed procedure, accessible service, and result for the user. Draw arrows only where a real logical dependency exists in the imagined setting. Then turn one card over and predict which results could change. Another group asks whether the effect must follow or is simply possible. A strong model leaves some arrows uncertain. It also includes a backup card representing alternatives or maintenance, because complex societies often have ways to keep going while one part is being repaired.
What an evidence-led investigation asks
Check issue time, forecast horizon, location and subsequent updates. There is a big difference between observing an outcome and proving its cause. Start with source identity, observation date, location, definition, unit and relevant population. If numbers are reported, keep the denominator and distinguish a total stock from a yearly flow. A forecast describes assumptions and possible future outcomes, while a reported event describes a stated observation. An official policy tells us what is intended or required, but not necessarily whether every person received the promised result. This distinction protects pupils from repeating claims that sound certain but rest on incomplete information.
Consider three possible explanations: the service genuinely became weaker; the service remained similar but the way it was measured or reported changed; or the activity was reorganised and continues through another route. These explanations cannot always all be true. What record would discriminate among them? The responsible researcher asks for an appropriate comparison point instead of choosing the most exciting explanation. If the answer cannot be verified, write “not yet established” and name the evidence that would help. In history, geography and current public information, that is an intellectually valuable answer.
Source quality also depends on relevance. A global report can establish important context for early warning, responsible risk communication and preparedness without measuring every local neighbourhood. A photograph can show appearance without demonstrating policy effectiveness or causality. A student’s paper model can reveal a logical possibility but supplies no real data. A published figure may describe one year even when the page containing it was updated in a later year. Keep those dates separate. If a claim has practical safety or legal consequences, refer to current competent authorities and specialists rather than applying a classroom inference to real life.
Different people see different things
Think about a person needing an accessible format. Their experience may expose a barrier that an aggregate service count does not show. Meanwhile, another resident may continue receiving the service without difficulty, and a professional may know of a safe workaround that is not publicly visible. A fair explanation asks how these perspectives can be checked and connected without deciding in advance that one person’s experience speaks for everyone. Inaccessible forms, confusing notices or poor coordination matter because public institutions exist to serve real people rather than only to produce good-looking dashboards.
A tutor can ask six respectful questions: Who needs the service? Who is missing from the published data? Is there another way to achieve the intended purpose? Are there relevant differences between users? Would the proposed remedy introduce a new barrier? How could a later reviewer know it worked? None of these questions requires asking a child to disclose private family circumstances, medical information, housing insecurity, legal disputes, employment status or exposure to real hazards. Use fictional characters with neutral descriptions and keep their personal identities entirely invented.
From diagnosis to a credible remedy
Communicate uncertainty clearly and tie actions to official guidance. Begin by preserving things that already work and by recognising who has legitimate authority to act. Next, specify one practical improvement, the people affected, the resources it would require and what observation could verify progress. Do not confuse spending with results. An allocated budget is not a repaired road, a published service plan is not proof of access, and an attractive photograph is not evidence of a functioning institution. A defensible response includes trained people, maintenance, privacy and a way to revisit an error.
The correction cycle has four checkpoints. Observe: describe the issue precisely and record its time and scope. Check: use authoritative evidence and challenge the first hypothesis. Improve: choose a proportionate action within appropriate professional responsibility. Review: test whether the person or service is genuinely better off, including users with different access needs. If the later evidence contradicts an earlier conclusion, document the change rather than hiding it. The purpose of accountability is to help people continue living and learning, not to stage blame as a spectacle.
Imagine that the repair succeeded for the easiest cases but not for someone who needs an alternative format. These counterexamples show why good systems need follow-up, clear responsibilities and honesty about limits. They also reveal why a civilisation’s resilience is not simply the number of impressive buildings or digital tools it possesses. People need reliable capability and fair ways to identify problems and improve them.
Worked mathematics: an invented example with correct units
Use 48 coloured paper cards in an imaginary town archive. Suppose 5 cards are flagged as requests requiring an additional check. The flagged proportion is 5 ÷ 48 × 100 = 10.4% when rounded to one decimal place. If the fictional clerk verifies that 4 flagged cards have been dealt with appropriately, 1 flagged cards remain open. All quantities are invented for teaching percentages. These cards are not real people, medical cases, court outcomes, hazardous events, risk probabilities or measurements of an actual place.
Now test whether this number tells the full story. Perhaps 48 represents only submitted requests, not everyone who needed help. Perhaps a change in reporting produces more flagged cards even while service quality improves. Perhaps the clerk recorded a closed case without checking whether the intended user was actually helped. A count, a resolution fraction, a waiting time and a meaningful outcome answer different questions. Ask learners to write the unit, denominator, observation date and the main limitation beside every number. They should resist the temptation to turn a neat calculation into a claim about an entire civilisation.
A safe, original activity for parents and tutors
Compare three fictional forecast bands. Use four paper sheets headed “observation”, “evidence”, “alternative explanation” and “follow-up”. The first student explains what is seen in the invented scenario; the second checks what would support the claim. A third seeks someone whose needs were not considered, and a fourth decides what later record could show improvement. The tutor corrects unwarranted certainty and invites pupils to revise their reasoning. This is a non-operational paper exercise, not a professional inspection, public-safety drill, legal opinion, clinical assessment or advice about real environmental conditions.
For young learners, work with one chapter and only three coloured cards. For upper-primary children, ask for a second possible explanation. For secondary pupils, add the percentage calculation and source validity checks. For advanced learners, introduce a system diagram with several dependencies, an explicit counterexample and a comparison across two periods. In every version, assess whether the student can explain in their own words what would make the intervention fair and what evidence is still missing. The ideal outcome is independent judgement and humane problem-solving, not perfect agreement or a dramatic prediction.
Test the explanation without looking back
- Define: A forecast can express likelihood without asserting that one outcome will certainly occur.
- Trace: Media accounts may remove caveats and turn probability into an absolute claim.
- Check: Check issue time, forecast horizon, location and subsequent updates.
- Correct: Communicate uncertainty clearly and tie actions to official guidance.
- Practise: Compare three fictional forecast bands.
- Limit: Explain why the imaginary Signalport model cannot establish the fate of a real society.
Finish with a handover statement that can be understood by the next learner: “The issue I investigated is … . The first claim is … . My source would be … . One competing explanation is … . I would make the process fairer by … . I would know the remedy worked when … . An important remaining uncertainty is … .” A child who can produce such a statement is learning the habit that civilisations themselves require: keeping knowledge usable, correcting errors, protecting people and handing functioning systems to those who come next.
7. Decision thresholds and false alarms
The clear explanation. Thresholds influence the balance between missed events and precautionary messages. This chapter looks at a concrete piece of early warning, responsible risk communication and preparedness rather than declaring that one problem necessarily ends an entire society. A civilisation is a network of people, accumulated skill, services, relationships and changing institutions. A local weakness deserves investigation even when the wider community remains able to function. It may be serious, but a serious event is not the same thing as the disappearance of a population or its culture.
How this part of the system works
An event not occurring does not necessarily mean the original precaution was irrational. Imagine how this might appear in Signalport, a fictional community invented for this lesson. On a normal day, residents seldom think about every person, tool, record or process that makes the service possible. A visitor sees an open door, a printed rule or a functioning piece of equipment; behind it are less visible dependencies. If one element changes, the results depend on buffers, substitutes, qualified people and the surrounding institutions. Some services remain fully available, some continue at reduced capacity, and some need an orderly alternative.
Begin with a service user’s experience, not with a dramatic headline. If people cannot complete an ordinary task, find the first confirmed point of difficulty. It may involve staff availability, instructions, a supply, an inaccessible route or a missing authorisation. A mistaken conclusion about cause can lead to the wrong remedy. Record the problem in observable terms and leave room for a competing explanation. For example, a service may have moved to a safer location while an old notice remained on display; that is an information failure, not necessarily a complete loss of capability.
To make the system visible, place five cards on the table in this order: input, trained people, agreed procedure, accessible service, and result for the user. Draw arrows only where a real logical dependency exists in the imagined setting. Then turn one card over and predict which results could change. Another group asks whether the effect must follow or is simply possible. A strong model leaves some arrows uncertain. It also includes a backup card representing alternatives or maintenance, because complex societies often have ways to keep going while one part is being repaired.
What an evidence-led investigation asks
Evaluate the information known at warning time, not only the eventual outcome. There is a big difference between observing an outcome and proving its cause. Start with source identity, observation date, location, definition, unit and relevant population. If numbers are reported, keep the denominator and distinguish a total stock from a yearly flow. A forecast describes assumptions and possible future outcomes, while a reported event describes a stated observation. An official policy tells us what is intended or required, but not necessarily whether every person received the promised result. This distinction protects pupils from repeating claims that sound certain but rest on incomplete information.
Consider three possible explanations: the service genuinely became weaker; the service remained similar but the way it was measured or reported changed; or the activity was reorganised and continues through another route. These explanations cannot always all be true. What record would discriminate among them? The responsible researcher asks for an appropriate comparison point instead of choosing the most exciting explanation. If the answer cannot be verified, write “not yet established” and name the evidence that would help. In history, geography and current public information, that is an intellectually valuable answer.
Source quality also depends on relevance. A global report can establish important context for early warning, responsible risk communication and preparedness without measuring every local neighbourhood. A photograph can show appearance without demonstrating policy effectiveness or causality. A student’s paper model can reveal a logical possibility but supplies no real data. A published figure may describe one year even when the page containing it was updated in a later year. Keep those dates separate. If a claim has practical safety or legal consequences, refer to current competent authorities and specialists rather than applying a classroom inference to real life.
Different people see different things
Think about a parent with a limited schedule. Their experience may expose a barrier that an aggregate service count does not show. Meanwhile, another resident may continue receiving the service without difficulty, and a professional may know of a safe workaround that is not publicly visible. A fair explanation asks how these perspectives can be checked and connected without deciding in advance that one person’s experience speaks for everyone. Inaccessible forms, confusing notices or poor coordination matter because public institutions exist to serve real people rather than only to produce good-looking dashboards.
A tutor can ask six respectful questions: Who needs the service? Who is missing from the published data? Is there another way to achieve the intended purpose? Are there relevant differences between users? Would the proposed remedy introduce a new barrier? How could a later reviewer know it worked? None of these questions requires asking a child to disclose private family circumstances, medical information, housing insecurity, legal disputes, employment status or exposure to real hazards. Use fictional characters with neutral descriptions and keep their personal identities entirely invented.
From diagnosis to a credible remedy
Build consistent professionally reviewed decision rules. Begin by preserving things that already work and by recognising who has legitimate authority to act. Next, specify one practical improvement, the people affected, the resources it would require and what observation could verify progress. Do not confuse spending with results. An allocated budget is not a repaired road, a published service plan is not proof of access, and an attractive photograph is not evidence of a functioning institution. A defensible response includes trained people, maintenance, privacy and a way to revisit an error.
The correction cycle has four checkpoints. Observe: describe the issue precisely and record its time and scope. Check: use authoritative evidence and challenge the first hypothesis. Improve: choose a proportionate action within appropriate professional responsibility. Review: test whether the person or service is genuinely better off, including users with different access needs. If the later evidence contradicts an earlier conclusion, document the change rather than hiding it. The purpose of accountability is to help people continue living and learning, not to stage blame as a spectacle.
Suppose the fictional service now reports a faster average but a few users wait much longer than before. These counterexamples show why good systems need follow-up, clear responsibilities and honesty about limits. They also reveal why a civilisation’s resilience is not simply the number of impressive buildings or digital tools it possesses. People need reliable capability and fair ways to identify problems and improve them.
Worked mathematics: an invented example with correct units
Use 55 coloured paper cards in a quiet paper library. Suppose 8 cards are flagged as requests requiring an additional check. The flagged proportion is 8 ÷ 55 × 100 = 14.5% when rounded to one decimal place. If the fictional clerk verifies that 7 flagged cards have been dealt with appropriately, 1 flagged cards remain open. All quantities are invented for teaching percentages. These cards are not real people, medical cases, court outcomes, hazardous events, risk probabilities or measurements of an actual place.
Now test whether this number tells the full story. Perhaps 55 represents only submitted requests, not everyone who needed help. Perhaps a change in reporting produces more flagged cards even while service quality improves. Perhaps the clerk recorded a closed case without checking whether the intended user was actually helped. A count, a resolution fraction, a waiting time and a meaningful outcome answer different questions. Ask learners to write the unit, denominator, observation date and the main limitation beside every number. They should resist the temptation to turn a neat calculation into a claim about an entire civilisation.
A safe, original activity for parents and tutors
Use coloured paper scores to discuss trade-offs. Use four paper sheets headed “observation”, “evidence”, “alternative explanation” and “follow-up”. The first student explains what is seen in the invented scenario; the second checks what would support the claim. A third seeks someone whose needs were not considered, and a fourth decides what later record could show improvement. The tutor corrects unwarranted certainty and invites pupils to revise their reasoning. This is a non-operational paper exercise, not a professional inspection, public-safety drill, legal opinion, clinical assessment or advice about real environmental conditions.
For young learners, work with one chapter and only three coloured cards. For upper-primary children, ask for a second possible explanation. For secondary pupils, add the percentage calculation and source validity checks. For advanced learners, introduce a system diagram with several dependencies, an explicit counterexample and a comparison across two periods. In every version, assess whether the student can explain in their own words what would make the intervention fair and what evidence is still missing. The ideal outcome is independent judgement and humane problem-solving, not perfect agreement or a dramatic prediction.
Test the explanation without looking back
- Define: Thresholds influence the balance between missed events and precautionary messages.
- Trace: An event not occurring does not necessarily mean the original precaution was irrational.
- Check: Evaluate the information known at warning time, not only the eventual outcome.
- Correct: Build consistent professionally reviewed decision rules.
- Practise: Use coloured paper scores to discuss trade-offs.
- Limit: Explain why the imaginary Signalport model cannot establish the fate of a real society.
Finish with a handover statement that can be understood by the next learner: “The issue I investigated is … . The first claim is … . My source would be … . One competing explanation is … . I would make the process fairer by … . I would know the remedy worked when … . An important remaining uncertainty is … .” A child who can produce such a statement is learning the habit that civilisations themselves require: keeping knowledge usable, correcting errors, protecting people and handing functioning systems to those who come next.
8. Trusted official warning sources
The clear explanation. Public notices need a clear issuer, timestamp, geographical scope and route to updated guidance. This chapter looks at a concrete piece of early warning, responsible risk communication and preparedness rather than declaring that one problem necessarily ends an entire society. A civilisation is a network of people, accumulated skill, services, relationships and changing institutions. A local weakness deserves investigation even when the wider community remains able to function. It may be serious, but a serious event is not the same thing as the disappearance of a population or its culture.
How this part of the system works
Rumours and undated screenshots can spread faster than properly checked information. Imagine how this might appear in Signalport, a fictional community invented for this lesson. On a normal day, residents seldom think about every person, tool, record or process that makes the service possible. A visitor sees an open door, a printed rule or a functioning piece of equipment; behind it are less visible dependencies. If one element changes, the results depend on buffers, substitutes, qualified people and the surrounding institutions. Some services remain fully available, some continue at reduced capacity, and some need an orderly alternative.
The most revealing question is often what people can still do. If people cannot complete an ordinary task, find the first confirmed point of difficulty. It may involve staff availability, instructions, a supply, an inaccessible route or a missing authorisation. A mistaken conclusion about cause can lead to the wrong remedy. Record the problem in observable terms and leave room for a competing explanation. For example, a service may have moved to a safer location while an old notice remained on display; that is an information failure, not necessarily a complete loss of capability.
To make the system visible, place five cards on the table in this order: input, trained people, agreed procedure, accessible service, and result for the user. Draw arrows only where a real logical dependency exists in the imagined setting. Then turn one card over and predict which results could change. Another group asks whether the effect must follow or is simply possible. A strong model leaves some arrows uncertain. It also includes a backup card representing alternatives or maintenance, because complex societies often have ways to keep going while one part is being repaired.
What an evidence-led investigation asks
Check the primary agency and live version before forwarding. There is a big difference between observing an outcome and proving its cause. Start with source identity, observation date, location, definition, unit and relevant population. If numbers are reported, keep the denominator and distinguish a total stock from a yearly flow. A forecast describes assumptions and possible future outcomes, while a reported event describes a stated observation. An official policy tells us what is intended or required, but not necessarily whether every person received the promised result. This distinction protects pupils from repeating claims that sound certain but rest on incomplete information.
Consider three possible explanations: the service genuinely became weaker; the service remained similar but the way it was measured or reported changed; or the activity was reorganised and continues through another route. These explanations cannot always all be true. What record would discriminate among them? The responsible researcher asks for an appropriate comparison point instead of choosing the most exciting explanation. If the answer cannot be verified, write “not yet established” and name the evidence that would help. In history, geography and current public information, that is an intellectually valuable answer.
Source quality also depends on relevance. A global report can establish important context for early warning, responsible risk communication and preparedness without measuring every local neighbourhood. A photograph can show appearance without demonstrating policy effectiveness or causality. A student’s paper model can reveal a logical possibility but supplies no real data. A published figure may describe one year even when the page containing it was updated in a later year. Keep those dates separate. If a claim has practical safety or legal consequences, refer to current competent authorities and specialists rather than applying a classroom inference to real life.
Different people see different things
Think about a student using a school service. Their experience may expose a barrier that an aggregate service count does not show. Meanwhile, another resident may continue receiving the service without difficulty, and a professional may know of a safe workaround that is not publicly visible. A fair explanation asks how these perspectives can be checked and connected without deciding in advance that one person’s experience speaks for everyone. Inaccessible forms, confusing notices or poor coordination matter because public institutions exist to serve real people rather than only to produce good-looking dashboards.
A tutor can ask six respectful questions: Who needs the service? Who is missing from the published data? Is there another way to achieve the intended purpose? Are there relevant differences between users? Would the proposed remedy introduce a new barrier? How could a later reviewer know it worked? None of these questions requires asking a child to disclose private family circumstances, medical information, housing insecurity, legal disputes, employment status or exposure to real hazards. Use fictional characters with neutral descriptions and keep their personal identities entirely invented.
From diagnosis to a credible remedy
Strengthen reliable distribution and public information literacy. Begin by preserving things that already work and by recognising who has legitimate authority to act. Next, specify one practical improvement, the people affected, the resources it would require and what observation could verify progress. Do not confuse spending with results. An allocated budget is not a repaired road, a published service plan is not proof of access, and an attractive photograph is not evidence of a functioning institution. A defensible response includes trained people, maintenance, privacy and a way to revisit an error.
The correction cycle has four checkpoints. Observe: describe the issue precisely and record its time and scope. Check: use authoritative evidence and challenge the first hypothesis. Improve: choose a proportionate action within appropriate professional responsibility. Review: test whether the person or service is genuinely better off, including users with different access needs. If the later evidence contradicts an earlier conclusion, document the change rather than hiding it. The purpose of accountability is to help people continue living and learning, not to stage blame as a spectacle.
What if a cheaper short-term fix prevents the next group from maintaining the improvement? These counterexamples show why good systems need follow-up, clear responsibilities and honesty about limits. They also reveal why a civilisation’s resilience is not simply the number of impressive buildings or digital tools it possesses. People need reliable capability and fair ways to identify problems and improve them.
Worked mathematics: an invented example with correct units
Use 62 coloured paper cards in a fictional service desk. Suppose 11 cards are flagged as requests requiring an additional check. The flagged proportion is 11 ÷ 62 × 100 = 17.7% when rounded to one decimal place. If the fictional clerk verifies that 4 flagged cards have been dealt with appropriately, 7 flagged cards remain open. All quantities are invented for teaching percentages. These cards are not real people, medical cases, court outcomes, hazardous events, risk probabilities or measurements of an actual place.
Now test whether this number tells the full story. Perhaps 62 represents only submitted requests, not everyone who needed help. Perhaps a change in reporting produces more flagged cards even while service quality improves. Perhaps the clerk recorded a closed case without checking whether the intended user was actually helped. A count, a resolution fraction, a waiting time and a meaningful outcome answer different questions. Ask learners to write the unit, denominator, observation date and the main limitation beside every number. They should resist the temptation to turn a neat calculation into a claim about an entire civilisation.
A safe, original activity for parents and tutors
Rewrite a fictional school closure message with source and date. Use four paper sheets headed “observation”, “evidence”, “alternative explanation” and “follow-up”. The first student explains what is seen in the invented scenario; the second checks what would support the claim. A third seeks someone whose needs were not considered, and a fourth decides what later record could show improvement. The tutor corrects unwarranted certainty and invites pupils to revise their reasoning. This is a non-operational paper exercise, not a professional inspection, public-safety drill, legal opinion, clinical assessment or advice about real environmental conditions.
For young learners, work with one chapter and only three coloured cards. For upper-primary children, ask for a second possible explanation. For secondary pupils, add the percentage calculation and source validity checks. For advanced learners, introduce a system diagram with several dependencies, an explicit counterexample and a comparison across two periods. In every version, assess whether the student can explain in their own words what would make the intervention fair and what evidence is still missing. The ideal outcome is independent judgement and humane problem-solving, not perfect agreement or a dramatic prediction.
Test the explanation without looking back
- Define: Public notices need a clear issuer, timestamp, geographical scope and route to updated guidance.
- Trace: Rumours and undated screenshots can spread faster than properly checked information.
- Check: Check the primary agency and live version before forwarding.
- Correct: Strengthen reliable distribution and public information literacy.
- Practise: Rewrite a fictional school closure message with source and date.
- Limit: Explain why the imaginary Signalport model cannot establish the fate of a real society.
Finish with a handover statement that can be understood by the next learner: “The issue I investigated is … . The first claim is … . My source would be … . One competing explanation is … . I would make the process fairer by … . I would know the remedy worked when … . An important remaining uncertainty is … .” A child who can produce such a statement is learning the habit that civilisations themselves require: keeping knowledge usable, correcting errors, protecting people and handing functioning systems to those who come next.
9. Language access and translation
The clear explanation. Warnings must be understandable to their intended audiences and use appropriate local terms. This chapter looks at a concrete piece of early warning, responsible risk communication and preparedness rather than declaring that one problem necessarily ends an entire society. A civilisation is a network of people, accumulated skill, services, relationships and changing institutions. A local weakness deserves investigation even when the wider community remains able to function. It may be serious, but a serious event is not the same thing as the disappearance of a population or its culture.
How this part of the system works
A literal translation may not convey the practical meaning of an official statement. Imagine how this might appear in Signalport, a fictional community invented for this lesson. On a normal day, residents seldom think about every person, tool, record or process that makes the service possible. A visitor sees an open door, a printed rule or a functioning piece of equipment; behind it are less visible dependencies. If one element changes, the results depend on buffers, substitutes, qualified people and the surrounding institutions. Some services remain fully available, some continue at reduced capacity, and some need an orderly alternative.
Treat a disruption as a hypothesis about dependencies, not an automatic cascade. If people cannot complete an ordinary task, find the first confirmed point of difficulty. It may involve staff availability, instructions, a supply, an inaccessible route or a missing authorisation. A mistaken conclusion about cause can lead to the wrong remedy. Record the problem in observable terms and leave room for a competing explanation. For example, a service may have moved to a safer location while an old notice remained on display; that is an information failure, not necessarily a complete loss of capability.
To make the system visible, place five cards on the table in this order: input, trained people, agreed procedure, accessible service, and result for the user. Draw arrows only where a real logical dependency exists in the imagined setting. Then turn one card over and predict which results could change. Another group asks whether the effect must follow or is simply possible. A strong model leaves some arrows uncertain. It also includes a backup card representing alternatives or maintenance, because complex societies often have ways to keep going while one part is being repaired.
What an evidence-led investigation asks
Test clarity with qualified translators and relevant readers. There is a big difference between observing an outcome and proving its cause. Start with source identity, observation date, location, definition, unit and relevant population. If numbers are reported, keep the denominator and distinguish a total stock from a yearly flow. A forecast describes assumptions and possible future outcomes, while a reported event describes a stated observation. An official policy tells us what is intended or required, but not necessarily whether every person received the promised result. This distinction protects pupils from repeating claims that sound certain but rest on incomplete information.
Consider three possible explanations: the service genuinely became weaker; the service remained similar but the way it was measured or reported changed; or the activity was reorganised and continues through another route. These explanations cannot always all be true. What record would discriminate among them? The responsible researcher asks for an appropriate comparison point instead of choosing the most exciting explanation. If the answer cannot be verified, write “not yet established” and name the evidence that would help. In history, geography and current public information, that is an intellectually valuable answer.
Source quality also depends on relevance. A global report can establish important context for early warning, responsible risk communication and preparedness without measuring every local neighbourhood. A photograph can show appearance without demonstrating policy effectiveness or causality. A student’s paper model can reveal a logical possibility but supplies no real data. A published figure may describe one year even when the page containing it was updated in a later year. Keep those dates separate. If a claim has practical safety or legal consequences, refer to current competent authorities and specialists rather than applying a classroom inference to real life.
Different people see different things
Think about a trained worker reviewing a record. Their experience may expose a barrier that an aggregate service count does not show. Meanwhile, another resident may continue receiving the service without difficulty, and a professional may know of a safe workaround that is not publicly visible. A fair explanation asks how these perspectives can be checked and connected without deciding in advance that one person’s experience speaks for everyone. Inaccessible forms, confusing notices or poor coordination matter because public institutions exist to serve real people rather than only to produce good-looking dashboards.
A tutor can ask six respectful questions: Who needs the service? Who is missing from the published data? Is there another way to achieve the intended purpose? Are there relevant differences between users? Would the proposed remedy introduce a new barrier? How could a later reviewer know it worked? None of these questions requires asking a child to disclose private family circumstances, medical information, housing insecurity, legal disputes, employment status or exposure to real hazards. Use fictional characters with neutral descriptions and keep their personal identities entirely invented.
From diagnosis to a credible remedy
Offer accessible multilingual information through legitimate channels. Begin by preserving things that already work and by recognising who has legitimate authority to act. Next, specify one practical improvement, the people affected, the resources it would require and what observation could verify progress. Do not confuse spending with results. An allocated budget is not a repaired road, a published service plan is not proof of access, and an attractive photograph is not evidence of a functioning institution. A defensible response includes trained people, maintenance, privacy and a way to revisit an error.
The correction cycle has four checkpoints. Observe: describe the issue precisely and record its time and scope. Check: use authoritative evidence and challenge the first hypothesis. Improve: choose a proportionate action within appropriate professional responsibility. Review: test whether the person or service is genuinely better off, including users with different access needs. If the later evidence contradicts an earlier conclusion, document the change rather than hiding it. The purpose of accountability is to help people continue living and learning, not to stage blame as a spectacle.
What happens when the person who designed the process is absent and no usable handover exists? These counterexamples show why good systems need follow-up, clear responsibilities and honesty about limits. They also reveal why a civilisation’s resilience is not simply the number of impressive buildings or digital tools it possesses. People need reliable capability and fair ways to identify problems and improve them.
Worked mathematics: an invented example with correct units
Use 69 coloured paper cards in an invented town square. Suppose 14 cards are flagged as requests requiring an additional check. The flagged proportion is 14 ÷ 69 × 100 = 20.3% when rounded to one decimal place. If the fictional clerk verifies that 8 flagged cards have been dealt with appropriately, 6 flagged cards remain open. All quantities are invented for teaching percentages. These cards are not real people, medical cases, court outcomes, hazardous events, risk probabilities or measurements of an actual place.
Now test whether this number tells the full story. Perhaps 69 represents only submitted requests, not everyone who needed help. Perhaps a change in reporting produces more flagged cards even while service quality improves. Perhaps the clerk recorded a closed case without checking whether the intended user was actually helped. A count, a resolution fraction, a waiting time and a meaningful outcome answer different questions. Ask learners to write the unit, denominator, observation date and the main limitation beside every number. They should resist the temptation to turn a neat calculation into a claim about an entire civilisation.
A safe, original activity for parents and tutors
Compare two invented notice translations for meaning. Use four paper sheets headed “observation”, “evidence”, “alternative explanation” and “follow-up”. The first student explains what is seen in the invented scenario; the second checks what would support the claim. A third seeks someone whose needs were not considered, and a fourth decides what later record could show improvement. The tutor corrects unwarranted certainty and invites pupils to revise their reasoning. This is a non-operational paper exercise, not a professional inspection, public-safety drill, legal opinion, clinical assessment or advice about real environmental conditions.
For young learners, work with one chapter and only three coloured cards. For upper-primary children, ask for a second possible explanation. For secondary pupils, add the percentage calculation and source validity checks. For advanced learners, introduce a system diagram with several dependencies, an explicit counterexample and a comparison across two periods. In every version, assess whether the student can explain in their own words what would make the intervention fair and what evidence is still missing. The ideal outcome is independent judgement and humane problem-solving, not perfect agreement or a dramatic prediction.
Test the explanation without looking back
- Define: Warnings must be understandable to their intended audiences and use appropriate local terms.
- Trace: A literal translation may not convey the practical meaning of an official statement.
- Check: Test clarity with qualified translators and relevant readers.
- Correct: Offer accessible multilingual information through legitimate channels.
- Practise: Compare two invented notice translations for meaning.
- Limit: Explain why the imaginary Signalport model cannot establish the fate of a real society.
Finish with a handover statement that can be understood by the next learner: “The issue I investigated is … . The first claim is … . My source would be … . One competing explanation is … . I would make the process fairer by … . I would know the remedy worked when … . An important remaining uncertainty is … .” A child who can produce such a statement is learning the habit that civilisations themselves require: keeping knowledge usable, correcting errors, protecting people and handing functioning systems to those who come next.
10. Accessible formats and diverse needs
The clear explanation. People may use spoken, visual, screen-reader-friendly or assisted communication. This chapter looks at a concrete piece of early warning, responsible risk communication and preparedness rather than declaring that one problem necessarily ends an entire society. A civilisation is a network of people, accumulated skill, services, relationships and changing institutions. A local weakness deserves investigation even when the wider community remains able to function. It may be serious, but a serious event is not the same thing as the disappearance of a population or its culture.
How this part of the system works
A single device-only delivery system can exclude users despite strong technical coverage. Imagine how this might appear in Signalport, a fictional community invented for this lesson. On a normal day, residents seldom think about every person, tool, record or process that makes the service possible. A visitor sees an open door, a printed rule or a functioning piece of equipment; behind it are less visible dependencies. If one element changes, the results depend on buffers, substitutes, qualified people and the surrounding institutions. Some services remain fully available, some continue at reduced capacity, and some need an orderly alternative.
Consider how an official-looking notice can differ from the real service experience. If people cannot complete an ordinary task, find the first confirmed point of difficulty. It may involve staff availability, instructions, a supply, an inaccessible route or a missing authorisation. A mistaken conclusion about cause can lead to the wrong remedy. Record the problem in observable terms and leave room for a competing explanation. For example, a service may have moved to a safer location while an old notice remained on display; that is an information failure, not necessarily a complete loss of capability.
To make the system visible, place five cards on the table in this order: input, trained people, agreed procedure, accessible service, and result for the user. Draw arrows only where a real logical dependency exists in the imagined setting. Then turn one card over and predict which results could change. Another group asks whether the effect must follow or is simply possible. A strong model leaves some arrows uncertain. It also includes a backup card representing alternatives or maintenance, because complex societies often have ways to keep going while one part is being repaired.
What an evidence-led investigation asks
Evaluate actual comprehension and reach without assuming disability from appearance. There is a big difference between observing an outcome and proving its cause. Start with source identity, observation date, location, definition, unit and relevant population. If numbers are reported, keep the denominator and distinguish a total stock from a yearly flow. A forecast describes assumptions and possible future outcomes, while a reported event describes a stated observation. An official policy tells us what is intended or required, but not necessarily whether every person received the promised result. This distinction protects pupils from repeating claims that sound certain but rest on incomplete information.
Consider three possible explanations: the service genuinely became weaker; the service remained similar but the way it was measured or reported changed; or the activity was reorganised and continues through another route. These explanations cannot always all be true. What record would discriminate among them? The responsible researcher asks for an appropriate comparison point instead of choosing the most exciting explanation. If the answer cannot be verified, write “not yet established” and name the evidence that would help. In history, geography and current public information, that is an intellectually valuable answer.
Source quality also depends on relevance. A global report can establish important context for early warning, responsible risk communication and preparedness without measuring every local neighbourhood. A photograph can show appearance without demonstrating policy effectiveness or causality. A student’s paper model can reveal a logical possibility but supplies no real data. A published figure may describe one year even when the page containing it was updated in a later year. Keep those dates separate. If a claim has practical safety or legal consequences, refer to current competent authorities and specialists rather than applying a classroom inference to real life.
Different people see different things
Think about an older resident travelling to a service. Their experience may expose a barrier that an aggregate service count does not show. Meanwhile, another resident may continue receiving the service without difficulty, and a professional may know of a safe workaround that is not publicly visible. A fair explanation asks how these perspectives can be checked and connected without deciding in advance that one person’s experience speaks for everyone. Inaccessible forms, confusing notices or poor coordination matter because public institutions exist to serve real people rather than only to produce good-looking dashboards.
A tutor can ask six respectful questions: Who needs the service? Who is missing from the published data? Is there another way to achieve the intended purpose? Are there relevant differences between users? Would the proposed remedy introduce a new barrier? How could a later reviewer know it worked? None of these questions requires asking a child to disclose private family circumstances, medical information, housing insecurity, legal disputes, employment status or exposure to real hazards. Use fictional characters with neutral descriptions and keep their personal identities entirely invented.
From diagnosis to a credible remedy
Make accessibility central to public information planning. Begin by preserving things that already work and by recognising who has legitimate authority to act. Next, specify one practical improvement, the people affected, the resources it would require and what observation could verify progress. Do not confuse spending with results. An allocated budget is not a repaired road, a published service plan is not proof of access, and an attractive photograph is not evidence of a functioning institution. A defensible response includes trained people, maintenance, privacy and a way to revisit an error.
The correction cycle has four checkpoints. Observe: describe the issue precisely and record its time and scope. Check: use authoritative evidence and challenge the first hypothesis. Improve: choose a proportionate action within appropriate professional responsibility. Review: test whether the person or service is genuinely better off, including users with different access needs. If the later evidence contradicts an earlier conclusion, document the change rather than hiding it. The purpose of accountability is to help people continue living and learning, not to stage blame as a spectacle.
Imagine that the first explanation was wrong but the institution has already announced a solution. These counterexamples show why good systems need follow-up, clear responsibilities and honesty about limits. They also reveal why a civilisation’s resilience is not simply the number of impressive buildings or digital tools it possesses. People need reliable capability and fair ways to identify problems and improve them.
Worked mathematics: an invented example with correct units
Use 76 coloured paper cards in a classroom model street. Suppose 17 cards are flagged as requests requiring an additional check. The flagged proportion is 17 ÷ 76 × 100 = 22.4% when rounded to one decimal place. If the fictional clerk verifies that 3 flagged cards have been dealt with appropriately, 14 flagged cards remain open. All quantities are invented for teaching percentages. These cards are not real people, medical cases, court outcomes, hazardous events, risk probabilities or measurements of an actual place.
Now test whether this number tells the full story. Perhaps 76 represents only submitted requests, not everyone who needed help. Perhaps a change in reporting produces more flagged cards even while service quality improves. Perhaps the clerk recorded a closed case without checking whether the intended user was actually helped. A count, a resolution fraction, a waiting time and a meaningful outcome answer different questions. Ask learners to write the unit, denominator, observation date and the main limitation beside every number. They should resist the temptation to turn a neat calculation into a claim about an entire civilisation.
A safe, original activity for parents and tutors
Provide the same harmless message in three formats. Use four paper sheets headed “observation”, “evidence”, “alternative explanation” and “follow-up”. The first student explains what is seen in the invented scenario; the second checks what would support the claim. A third seeks someone whose needs were not considered, and a fourth decides what later record could show improvement. The tutor corrects unwarranted certainty and invites pupils to revise their reasoning. This is a non-operational paper exercise, not a professional inspection, public-safety drill, legal opinion, clinical assessment or advice about real environmental conditions.
For young learners, work with one chapter and only three coloured cards. For upper-primary children, ask for a second possible explanation. For secondary pupils, add the percentage calculation and source validity checks. For advanced learners, introduce a system diagram with several dependencies, an explicit counterexample and a comparison across two periods. In every version, assess whether the student can explain in their own words what would make the intervention fair and what evidence is still missing. The ideal outcome is independent judgement and humane problem-solving, not perfect agreement or a dramatic prediction.
Test the explanation without looking back
- Define: People may use spoken, visual, screen-reader-friendly or assisted communication.
- Trace: A single device-only delivery system can exclude users despite strong technical coverage.
- Check: Evaluate actual comprehension and reach without assuming disability from appearance.
- Correct: Make accessibility central to public information planning.
- Practise: Provide the same harmless message in three formats.
- Limit: Explain why the imaginary Signalport model cannot establish the fate of a real society.
Finish with a handover statement that can be understood by the next learner: “The issue I investigated is … . The first claim is … . My source would be … . One competing explanation is … . I would make the process fairer by … . I would know the remedy worked when … . An important remaining uncertainty is … .” A child who can produce such a statement is learning the habit that civilisations themselves require: keeping knowledge usable, correcting errors, protecting people and handing functioning systems to those who come next.
11. Backup communications and outages
The clear explanation. Reliable warning chains consider how they can continue if one channel is unavailable. This chapter looks at a concrete piece of early warning, responsible risk communication and preparedness rather than declaring that one problem necessarily ends an entire society. A civilisation is a network of people, accumulated skill, services, relationships and changing institutions. A local weakness deserves investigation even when the wider community remains able to function. It may be serious, but a serious event is not the same thing as the disappearance of a population or its culture.
How this part of the system works
A fully digital design may depend on power or connectivity that is disrupted. Imagine how this might appear in Signalport, a fictional community invented for this lesson. On a normal day, residents seldom think about every person, tool, record or process that makes the service possible. A visitor sees an open door, a printed rule or a functioning piece of equipment; behind it are less visible dependencies. If one element changes, the results depend on buffers, substitutes, qualified people and the surrounding institutions. Some services remain fully available, some continue at reduced capacity, and some need an orderly alternative.
A useful first move is to isolate one variable at a time. If people cannot complete an ordinary task, find the first confirmed point of difficulty. It may involve staff availability, instructions, a supply, an inaccessible route or a missing authorisation. A mistaken conclusion about cause can lead to the wrong remedy. Record the problem in observable terms and leave room for a competing explanation. For example, a service may have moved to a safer location while an old notice remained on display; that is an information failure, not necessarily a complete loss of capability.
To make the system visible, place five cards on the table in this order: input, trained people, agreed procedure, accessible service, and result for the user. Draw arrows only where a real logical dependency exists in the imagined setting. Then turn one card over and predict which results could change. Another group asks whether the effect must follow or is simply possible. A strong model leaves some arrows uncertain. It also includes a backup card representing alternatives or maintenance, because complex societies often have ways to keep going while one part is being repaired.
What an evidence-led investigation asks
Check proven backup capability, not only planned redundancy. There is a big difference between observing an outcome and proving its cause. Start with source identity, observation date, location, definition, unit and relevant population. If numbers are reported, keep the denominator and distinguish a total stock from a yearly flow. A forecast describes assumptions and possible future outcomes, while a reported event describes a stated observation. An official policy tells us what is intended or required, but not necessarily whether every person received the promised result. This distinction protects pupils from repeating claims that sound certain but rest on incomplete information.
Consider three possible explanations: the service genuinely became weaker; the service remained similar but the way it was measured or reported changed; or the activity was reorganised and continues through another route. These explanations cannot always all be true. What record would discriminate among them? The responsible researcher asks for an appropriate comparison point instead of choosing the most exciting explanation. If the answer cannot be verified, write “not yet established” and name the evidence that would help. In history, geography and current public information, that is an intellectually valuable answer.
Source quality also depends on relevance. A global report can establish important context for early warning, responsible risk communication and preparedness without measuring every local neighbourhood. A photograph can show appearance without demonstrating policy effectiveness or causality. A student’s paper model can reveal a logical possibility but supplies no real data. A published figure may describe one year even when the page containing it was updated in a later year. Keep those dates separate. If a claim has practical safety or legal consequences, refer to current competent authorities and specialists rather than applying a classroom inference to real life.
Different people see different things
Think about a newcomer seeking clear information. Their experience may expose a barrier that an aggregate service count does not show. Meanwhile, another resident may continue receiving the service without difficulty, and a professional may know of a safe workaround that is not publicly visible. A fair explanation asks how these perspectives can be checked and connected without deciding in advance that one person’s experience speaks for everyone. Inaccessible forms, confusing notices or poor coordination matter because public institutions exist to serve real people rather than only to produce good-looking dashboards.
A tutor can ask six respectful questions: Who needs the service? Who is missing from the published data? Is there another way to achieve the intended purpose? Are there relevant differences between users? Would the proposed remedy introduce a new barrier? How could a later reviewer know it worked? None of these questions requires asking a child to disclose private family circumstances, medical information, housing insecurity, legal disputes, employment status or exposure to real hazards. Use fictional characters with neutral descriptions and keep their personal identities entirely invented.
From diagnosis to a credible remedy
Maintain multiple authorised channels and accountable maintenance. Begin by preserving things that already work and by recognising who has legitimate authority to act. Next, specify one practical improvement, the people affected, the resources it would require and what observation could verify progress. Do not confuse spending with results. An allocated budget is not a repaired road, a published service plan is not proof of access, and an attractive photograph is not evidence of a functioning institution. A defensible response includes trained people, maintenance, privacy and a way to revisit an error.
The correction cycle has four checkpoints. Observe: describe the issue precisely and record its time and scope. Check: use authoritative evidence and challenge the first hypothesis. Improve: choose a proportionate action within appropriate professional responsibility. Review: test whether the person or service is genuinely better off, including users with different access needs. If the later evidence contradicts an earlier conclusion, document the change rather than hiding it. The purpose of accountability is to help people continue living and learning, not to stage blame as a spectacle.
Imagine that the repair succeeded for the easiest cases but not for someone who needs an alternative format. These counterexamples show why good systems need follow-up, clear responsibilities and honesty about limits. They also reveal why a civilisation’s resilience is not simply the number of impressive buildings or digital tools it possesses. People need reliable capability and fair ways to identify problems and improve them.
Worked mathematics: an invented example with correct units
Use 48 coloured paper cards in a mock community timetable. Suppose 5 cards are flagged as requests requiring an additional check. The flagged proportion is 5 ÷ 48 × 100 = 10.4% when rounded to one decimal place. If the fictional clerk verifies that 4 flagged cards have been dealt with appropriately, 1 flagged cards remain open. All quantities are invented for teaching percentages. These cards are not real people, medical cases, court outcomes, hazardous events, risk probabilities or measurements of an actual place.
Now test whether this number tells the full story. Perhaps 48 represents only submitted requests, not everyone who needed help. Perhaps a change in reporting produces more flagged cards even while service quality improves. Perhaps the clerk recorded a closed case without checking whether the intended user was actually helped. A count, a resolution fraction, a waiting time and a meaningful outcome answer different questions. Ask learners to write the unit, denominator, observation date and the main limitation beside every number. They should resist the temptation to turn a neat calculation into a claim about an entire civilisation.
A safe, original activity for parents and tutors
Trace a fictional school notice through two channels. Use four paper sheets headed “observation”, “evidence”, “alternative explanation” and “follow-up”. The first student explains what is seen in the invented scenario; the second checks what would support the claim. A third seeks someone whose needs were not considered, and a fourth decides what later record could show improvement. The tutor corrects unwarranted certainty and invites pupils to revise their reasoning. This is a non-operational paper exercise, not a professional inspection, public-safety drill, legal opinion, clinical assessment or advice about real environmental conditions.
For young learners, work with one chapter and only three coloured cards. For upper-primary children, ask for a second possible explanation. For secondary pupils, add the percentage calculation and source validity checks. For advanced learners, introduce a system diagram with several dependencies, an explicit counterexample and a comparison across two periods. In every version, assess whether the student can explain in their own words what would make the intervention fair and what evidence is still missing. The ideal outcome is independent judgement and humane problem-solving, not perfect agreement or a dramatic prediction.
Test the explanation without looking back
- Define: Reliable warning chains consider how they can continue if one channel is unavailable.
- Trace: A fully digital design may depend on power or connectivity that is disrupted.
- Check: Check proven backup capability, not only planned redundancy.
- Correct: Maintain multiple authorised channels and accountable maintenance.
- Practise: Trace a fictional school notice through two channels.
- Limit: Explain why the imaginary Signalport model cannot establish the fate of a real society.
Finish with a handover statement that can be understood by the next learner: “The issue I investigated is … . The first claim is … . My source would be … . One competing explanation is … . I would make the process fairer by … . I would know the remedy worked when … . An important remaining uncertainty is … .” A child who can produce such a statement is learning the habit that civilisations themselves require: keeping knowledge usable, correcting errors, protecting people and handing functioning systems to those who come next.
12. Community organisations and trusted relay
The clear explanation. Local groups may help people understand authorised information when roles are clear. This chapter looks at a concrete piece of early warning, responsible risk communication and preparedness rather than declaring that one problem necessarily ends an entire society. A civilisation is a network of people, accumulated skill, services, relationships and changing institutions. A local weakness deserves investigation even when the wider community remains able to function. It may be serious, but a serious event is not the same thing as the disappearance of a population or its culture.
How this part of the system works
Conflicting informal messages can cause confusion when original sources are lost. Imagine how this might appear in Signalport, a fictional community invented for this lesson. On a normal day, residents seldom think about every person, tool, record or process that makes the service possible. A visitor sees an open door, a printed rule or a functioning piece of equipment; behind it are less visible dependencies. If one element changes, the results depend on buffers, substitutes, qualified people and the surrounding institutions. Some services remain fully available, some continue at reduced capacity, and some need an orderly alternative.
Begin with a service user’s experience, not with a dramatic headline. If people cannot complete an ordinary task, find the first confirmed point of difficulty. It may involve staff availability, instructions, a supply, an inaccessible route or a missing authorisation. A mistaken conclusion about cause can lead to the wrong remedy. Record the problem in observable terms and leave room for a competing explanation. For example, a service may have moved to a safer location while an old notice remained on display; that is an information failure, not necessarily a complete loss of capability.
To make the system visible, place five cards on the table in this order: input, trained people, agreed procedure, accessible service, and result for the user. Draw arrows only where a real logical dependency exists in the imagined setting. Then turn one card over and predict which results could change. Another group asks whether the effect must follow or is simply possible. A strong model leaves some arrows uncertain. It also includes a backup card representing alternatives or maintenance, because complex societies often have ways to keep going while one part is being repaired.
What an evidence-led investigation asks
Identify trained messengers, official origin and limits of responsibility. There is a big difference between observing an outcome and proving its cause. Start with source identity, observation date, location, definition, unit and relevant population. If numbers are reported, keep the denominator and distinguish a total stock from a yearly flow. A forecast describes assumptions and possible future outcomes, while a reported event describes a stated observation. An official policy tells us what is intended or required, but not necessarily whether every person received the promised result. This distinction protects pupils from repeating claims that sound certain but rest on incomplete information.
Consider three possible explanations: the service genuinely became weaker; the service remained similar but the way it was measured or reported changed; or the activity was reorganised and continues through another route. These explanations cannot always all be true. What record would discriminate among them? The responsible researcher asks for an appropriate comparison point instead of choosing the most exciting explanation. If the answer cannot be verified, write “not yet established” and name the evidence that would help. In history, geography and current public information, that is an intellectually valuable answer.
Source quality also depends on relevance. A global report can establish important context for early warning, responsible risk communication and preparedness without measuring every local neighbourhood. A photograph can show appearance without demonstrating policy effectiveness or causality. A student’s paper model can reveal a logical possibility but supplies no real data. A published figure may describe one year even when the page containing it was updated in a later year. Keep those dates separate. If a claim has practical safety or legal consequences, refer to current competent authorities and specialists rather than applying a classroom inference to real life.
Different people see different things
Think about a person needing an accessible format. Their experience may expose a barrier that an aggregate service count does not show. Meanwhile, another resident may continue receiving the service without difficulty, and a professional may know of a safe workaround that is not publicly visible. A fair explanation asks how these perspectives can be checked and connected without deciding in advance that one person’s experience speaks for everyone. Inaccessible forms, confusing notices or poor coordination matter because public institutions exist to serve real people rather than only to produce good-looking dashboards.
A tutor can ask six respectful questions: Who needs the service? Who is missing from the published data? Is there another way to achieve the intended purpose? Are there relevant differences between users? Would the proposed remedy introduce a new barrier? How could a later reviewer know it worked? None of these questions requires asking a child to disclose private family circumstances, medical information, housing insecurity, legal disputes, employment status or exposure to real hazards. Use fictional characters with neutral descriptions and keep their personal identities entirely invented.
From diagnosis to a credible remedy
Build coordination without transferring expert duties to untrained volunteers. Begin by preserving things that already work and by recognising who has legitimate authority to act. Next, specify one practical improvement, the people affected, the resources it would require and what observation could verify progress. Do not confuse spending with results. An allocated budget is not a repaired road, a published service plan is not proof of access, and an attractive photograph is not evidence of a functioning institution. A defensible response includes trained people, maintenance, privacy and a way to revisit an error.
The correction cycle has four checkpoints. Observe: describe the issue precisely and record its time and scope. Check: use authoritative evidence and challenge the first hypothesis. Improve: choose a proportionate action within appropriate professional responsibility. Review: test whether the person or service is genuinely better off, including users with different access needs. If the later evidence contradicts an earlier conclusion, document the change rather than hiding it. The purpose of accountability is to help people continue living and learning, not to stage blame as a spectacle.
Suppose the fictional service now reports a faster average but a few users wait much longer than before. These counterexamples show why good systems need follow-up, clear responsibilities and honesty about limits. They also reveal why a civilisation’s resilience is not simply the number of impressive buildings or digital tools it possesses. People need reliable capability and fair ways to identify problems and improve them.
Worked mathematics: an invented example with correct units
Use 55 coloured paper cards in an imaginary town archive. Suppose 8 cards are flagged as requests requiring an additional check. The flagged proportion is 8 ÷ 55 × 100 = 14.5% when rounded to one decimal place. If the fictional clerk verifies that 7 flagged cards have been dealt with appropriately, 1 flagged cards remain open. All quantities are invented for teaching percentages. These cards are not real people, medical cases, court outcomes, hazardous events, risk probabilities or measurements of an actual place.
Now test whether this number tells the full story. Perhaps 55 represents only submitted requests, not everyone who needed help. Perhaps a change in reporting produces more flagged cards even while service quality improves. Perhaps the clerk recorded a closed case without checking whether the intended user was actually helped. A count, a resolution fraction, a waiting time and a meaningful outcome answer different questions. Ask learners to write the unit, denominator, observation date and the main limitation beside every number. They should resist the temptation to turn a neat calculation into a claim about an entire civilisation.
A safe, original activity for parents and tutors
Draw a harmless authorised notice tree. Use four paper sheets headed “observation”, “evidence”, “alternative explanation” and “follow-up”. The first student explains what is seen in the invented scenario; the second checks what would support the claim. A third seeks someone whose needs were not considered, and a fourth decides what later record could show improvement. The tutor corrects unwarranted certainty and invites pupils to revise their reasoning. This is a non-operational paper exercise, not a professional inspection, public-safety drill, legal opinion, clinical assessment or advice about real environmental conditions.
For young learners, work with one chapter and only three coloured cards. For upper-primary children, ask for a second possible explanation. For secondary pupils, add the percentage calculation and source validity checks. For advanced learners, introduce a system diagram with several dependencies, an explicit counterexample and a comparison across two periods. In every version, assess whether the student can explain in their own words what would make the intervention fair and what evidence is still missing. The ideal outcome is independent judgement and humane problem-solving, not perfect agreement or a dramatic prediction.
Test the explanation without looking back
- Define: Local groups may help people understand authorised information when roles are clear.
- Trace: Conflicting informal messages can cause confusion when original sources are lost.
- Check: Identify trained messengers, official origin and limits of responsibility.
- Correct: Build coordination without transferring expert duties to untrained volunteers.
- Practise: Draw a harmless authorised notice tree.
- Limit: Explain why the imaginary Signalport model cannot establish the fate of a real society.
Finish with a handover statement that can be understood by the next learner: “The issue I investigated is … . The first claim is … . My source would be … . One competing explanation is … . I would make the process fairer by … . I would know the remedy worked when … . An important remaining uncertainty is … .” A child who can produce such a statement is learning the habit that civilisations themselves require: keeping knowledge usable, correcting errors, protecting people and handing functioning systems to those who come next.
13. Children, schools and safeguarding
The clear explanation. Schools can teach information literacy and rely on established professional emergency arrangements. This chapter looks at a concrete piece of early warning, responsible risk communication and preparedness rather than declaring that one problem necessarily ends an entire society. A civilisation is a network of people, accumulated skill, services, relationships and changing institutions. A local weakness deserves investigation even when the wider community remains able to function. It may be serious, but a serious event is not the same thing as the disappearance of a population or its culture.
How this part of the system works
Dramatic role-play may frighten learners without improving practical understanding. Imagine how this might appear in Signalport, a fictional community invented for this lesson. On a normal day, residents seldom think about every person, tool, record or process that makes the service possible. A visitor sees an open door, a printed rule or a functioning piece of equipment; behind it are less visible dependencies. If one element changes, the results depend on buffers, substitutes, qualified people and the surrounding institutions. Some services remain fully available, some continue at reduced capacity, and some need an orderly alternative.
The most revealing question is often what people can still do. If people cannot complete an ordinary task, find the first confirmed point of difficulty. It may involve staff availability, instructions, a supply, an inaccessible route or a missing authorisation. A mistaken conclusion about cause can lead to the wrong remedy. Record the problem in observable terms and leave room for a competing explanation. For example, a service may have moved to a safer location while an old notice remained on display; that is an information failure, not necessarily a complete loss of capability.
To make the system visible, place five cards on the table in this order: input, trained people, agreed procedure, accessible service, and result for the user. Draw arrows only where a real logical dependency exists in the imagined setting. Then turn one card over and predict which results could change. Another group asks whether the effect must follow or is simply possible. A strong model leaves some arrows uncertain. It also includes a backup card representing alternatives or maintenance, because complex societies often have ways to keep going while one part is being repaired.
What an evidence-led investigation asks
Follow official school procedures for real safety planning. There is a big difference between observing an outcome and proving its cause. Start with source identity, observation date, location, definition, unit and relevant population. If numbers are reported, keep the denominator and distinguish a total stock from a yearly flow. A forecast describes assumptions and possible future outcomes, while a reported event describes a stated observation. An official policy tells us what is intended or required, but not necessarily whether every person received the promised result. This distinction protects pupils from repeating claims that sound certain but rest on incomplete information.
Consider three possible explanations: the service genuinely became weaker; the service remained similar but the way it was measured or reported changed; or the activity was reorganised and continues through another route. These explanations cannot always all be true. What record would discriminate among them? The responsible researcher asks for an appropriate comparison point instead of choosing the most exciting explanation. If the answer cannot be verified, write “not yet established” and name the evidence that would help. In history, geography and current public information, that is an intellectually valuable answer.
Source quality also depends on relevance. A global report can establish important context for early warning, responsible risk communication and preparedness without measuring every local neighbourhood. A photograph can show appearance without demonstrating policy effectiveness or causality. A student’s paper model can reveal a logical possibility but supplies no real data. A published figure may describe one year even when the page containing it was updated in a later year. Keep those dates separate. If a claim has practical safety or legal consequences, refer to current competent authorities and specialists rather than applying a classroom inference to real life.
Different people see different things
Think about a parent with a limited schedule. Their experience may expose a barrier that an aggregate service count does not show. Meanwhile, another resident may continue receiving the service without difficulty, and a professional may know of a safe workaround that is not publicly visible. A fair explanation asks how these perspectives can be checked and connected without deciding in advance that one person’s experience speaks for everyone. Inaccessible forms, confusing notices or poor coordination matter because public institutions exist to serve real people rather than only to produce good-looking dashboards.
A tutor can ask six respectful questions: Who needs the service? Who is missing from the published data? Is there another way to achieve the intended purpose? Are there relevant differences between users? Would the proposed remedy introduce a new barrier? How could a later reviewer know it worked? None of these questions requires asking a child to disclose private family circumstances, medical information, housing insecurity, legal disputes, employment status or exposure to real hazards. Use fictional characters with neutral descriptions and keep their personal identities entirely invented.
From diagnosis to a credible remedy
Use optional fictional paper activities and trained adult supervision. Begin by preserving things that already work and by recognising who has legitimate authority to act. Next, specify one practical improvement, the people affected, the resources it would require and what observation could verify progress. Do not confuse spending with results. An allocated budget is not a repaired road, a published service plan is not proof of access, and an attractive photograph is not evidence of a functioning institution. A defensible response includes trained people, maintenance, privacy and a way to revisit an error.
The correction cycle has four checkpoints. Observe: describe the issue precisely and record its time and scope. Check: use authoritative evidence and challenge the first hypothesis. Improve: choose a proportionate action within appropriate professional responsibility. Review: test whether the person or service is genuinely better off, including users with different access needs. If the later evidence contradicts an earlier conclusion, document the change rather than hiding it. The purpose of accountability is to help people continue living and learning, not to stage blame as a spectacle.
What if a cheaper short-term fix prevents the next group from maintaining the improvement? These counterexamples show why good systems need follow-up, clear responsibilities and honesty about limits. They also reveal why a civilisation’s resilience is not simply the number of impressive buildings or digital tools it possesses. People need reliable capability and fair ways to identify problems and improve them.
Worked mathematics: an invented example with correct units
Use 62 coloured paper cards in a quiet paper library. Suppose 11 cards are flagged as requests requiring an additional check. The flagged proportion is 11 ÷ 62 × 100 = 17.7% when rounded to one decimal place. If the fictional clerk verifies that 6 flagged cards have been dealt with appropriately, 5 flagged cards remain open. All quantities are invented for teaching percentages. These cards are not real people, medical cases, court outcomes, hazardous events, risk probabilities or measurements of an actual place.
Now test whether this number tells the full story. Perhaps 62 represents only submitted requests, not everyone who needed help. Perhaps a change in reporting produces more flagged cards even while service quality improves. Perhaps the clerk recorded a closed case without checking whether the intended user was actually helped. A count, a resolution fraction, a waiting time and a meaningful outcome answer different questions. Ask learners to write the unit, denominator, observation date and the main limitation beside every number. They should resist the temptation to turn a neat calculation into a claim about an entire civilisation.
A safe, original activity for parents and tutors
Design a calm notice for a postponed library activity. Use four paper sheets headed “observation”, “evidence”, “alternative explanation” and “follow-up”. The first student explains what is seen in the invented scenario; the second checks what would support the claim. A third seeks someone whose needs were not considered, and a fourth decides what later record could show improvement. The tutor corrects unwarranted certainty and invites pupils to revise their reasoning. This is a non-operational paper exercise, not a professional inspection, public-safety drill, legal opinion, clinical assessment or advice about real environmental conditions.
For young learners, work with one chapter and only three coloured cards. For upper-primary children, ask for a second possible explanation. For secondary pupils, add the percentage calculation and source validity checks. For advanced learners, introduce a system diagram with several dependencies, an explicit counterexample and a comparison across two periods. In every version, assess whether the student can explain in their own words what would make the intervention fair and what evidence is still missing. The ideal outcome is independent judgement and humane problem-solving, not perfect agreement or a dramatic prediction.
Test the explanation without looking back
- Define: Schools can teach information literacy and rely on established professional emergency arrangements.
- Trace: Dramatic role-play may frighten learners without improving practical understanding.
- Check: Follow official school procedures for real safety planning.
- Correct: Use optional fictional paper activities and trained adult supervision.
- Practise: Design a calm notice for a postponed library activity.
- Limit: Explain why the imaginary Signalport model cannot establish the fate of a real society.
Finish with a handover statement that can be understood by the next learner: “The issue I investigated is … . The first claim is … . My source would be … . One competing explanation is … . I would make the process fairer by … . I would know the remedy worked when … . An important remaining uncertainty is … .” A child who can produce such a statement is learning the habit that civilisations themselves require: keeping knowledge usable, correcting errors, protecting people and handing functioning systems to those who come next.
14. Rumours and corrections
The clear explanation. Old alerts and screenshots can appear current without their timestamps or geographic qualifications. This chapter looks at a concrete piece of early warning, responsible risk communication and preparedness rather than declaring that one problem necessarily ends an entire society. A civilisation is a network of people, accumulated skill, services, relationships and changing institutions. A local weakness deserves investigation even when the wider community remains able to function. It may be serious, but a serious event is not the same thing as the disappearance of a population or its culture.
How this part of the system works
Repeated false context may erode trust in genuinely authoritative announcements. Imagine how this might appear in Signalport, a fictional community invented for this lesson. On a normal day, residents seldom think about every person, tool, record or process that makes the service possible. A visitor sees an open door, a printed rule or a functioning piece of equipment; behind it are less visible dependencies. If one element changes, the results depend on buffers, substitutes, qualified people and the surrounding institutions. Some services remain fully available, some continue at reduced capacity, and some need an orderly alternative.
Treat a disruption as a hypothesis about dependencies, not an automatic cascade. If people cannot complete an ordinary task, find the first confirmed point of difficulty. It may involve staff availability, instructions, a supply, an inaccessible route or a missing authorisation. A mistaken conclusion about cause can lead to the wrong remedy. Record the problem in observable terms and leave room for a competing explanation. For example, a service may have moved to a safer location while an old notice remained on display; that is an information failure, not necessarily a complete loss of capability.
To make the system visible, place five cards on the table in this order: input, trained people, agreed procedure, accessible service, and result for the user. Draw arrows only where a real logical dependency exists in the imagined setting. Then turn one card over and predict which results could change. Another group asks whether the effect must follow or is simply possible. A strong model leaves some arrows uncertain. It also includes a backup card representing alternatives or maintenance, because complex societies often have ways to keep going while one part is being repaired.
What an evidence-led investigation asks
Verify original publication, version, location and update. There is a big difference between observing an outcome and proving its cause. Start with source identity, observation date, location, definition, unit and relevant population. If numbers are reported, keep the denominator and distinguish a total stock from a yearly flow. A forecast describes assumptions and possible future outcomes, while a reported event describes a stated observation. An official policy tells us what is intended or required, but not necessarily whether every person received the promised result. This distinction protects pupils from repeating claims that sound certain but rest on incomplete information.
Consider three possible explanations: the service genuinely became weaker; the service remained similar but the way it was measured or reported changed; or the activity was reorganised and continues through another route. These explanations cannot always all be true. What record would discriminate among them? The responsible researcher asks for an appropriate comparison point instead of choosing the most exciting explanation. If the answer cannot be verified, write “not yet established” and name the evidence that would help. In history, geography and current public information, that is an intellectually valuable answer.
Source quality also depends on relevance. A global report can establish important context for early warning, responsible risk communication and preparedness without measuring every local neighbourhood. A photograph can show appearance without demonstrating policy effectiveness or causality. A student’s paper model can reveal a logical possibility but supplies no real data. A published figure may describe one year even when the page containing it was updated in a later year. Keep those dates separate. If a claim has practical safety or legal consequences, refer to current competent authorities and specialists rather than applying a classroom inference to real life.
Different people see different things
Think about a student using a school service. Their experience may expose a barrier that an aggregate service count does not show. Meanwhile, another resident may continue receiving the service without difficulty, and a professional may know of a safe workaround that is not publicly visible. A fair explanation asks how these perspectives can be checked and connected without deciding in advance that one person’s experience speaks for everyone. Inaccessible forms, confusing notices or poor coordination matter because public institutions exist to serve real people rather than only to produce good-looking dashboards.
A tutor can ask six respectful questions: Who needs the service? Who is missing from the published data? Is there another way to achieve the intended purpose? Are there relevant differences between users? Would the proposed remedy introduce a new barrier? How could a later reviewer know it worked? None of these questions requires asking a child to disclose private family circumstances, medical information, housing insecurity, legal disputes, employment status or exposure to real hazards. Use fictional characters with neutral descriptions and keep their personal identities entirely invented.
From diagnosis to a credible remedy
Make public corrections visible and easy to understand. Begin by preserving things that already work and by recognising who has legitimate authority to act. Next, specify one practical improvement, the people affected, the resources it would require and what observation could verify progress. Do not confuse spending with results. An allocated budget is not a repaired road, a published service plan is not proof of access, and an attractive photograph is not evidence of a functioning institution. A defensible response includes trained people, maintenance, privacy and a way to revisit an error.
The correction cycle has four checkpoints. Observe: describe the issue precisely and record its time and scope. Check: use authoritative evidence and challenge the first hypothesis. Improve: choose a proportionate action within appropriate professional responsibility. Review: test whether the person or service is genuinely better off, including users with different access needs. If the later evidence contradicts an earlier conclusion, document the change rather than hiding it. The purpose of accountability is to help people continue living and learning, not to stage blame as a spectacle.
What happens when the person who designed the process is absent and no usable handover exists? These counterexamples show why good systems need follow-up, clear responsibilities and honesty about limits. They also reveal why a civilisation’s resilience is not simply the number of impressive buildings or digital tools it possesses. People need reliable capability and fair ways to identify problems and improve them.
Worked mathematics: an invented example with correct units
Use 69 coloured paper cards in a fictional service desk. Suppose 14 cards are flagged as requests requiring an additional check. The flagged proportion is 14 ÷ 69 × 100 = 20.3% when rounded to one decimal place. If the fictional clerk verifies that 10 flagged cards have been dealt with appropriately, 4 flagged cards remain open. All quantities are invented for teaching percentages. These cards are not real people, medical cases, court outcomes, hazardous events, risk probabilities or measurements of an actual place.
Now test whether this number tells the full story. Perhaps 69 represents only submitted requests, not everyone who needed help. Perhaps a change in reporting produces more flagged cards even while service quality improves. Perhaps the clerk recorded a closed case without checking whether the intended user was actually helped. A count, a resolution fraction, a waiting time and a meaningful outcome answer different questions. Ask learners to write the unit, denominator, observation date and the main limitation beside every number. They should resist the temptation to turn a neat calculation into a claim about an entire civilisation.
A safe, original activity for parents and tutors
Sort imaginary notices by version and origin. Use four paper sheets headed “observation”, “evidence”, “alternative explanation” and “follow-up”. The first student explains what is seen in the invented scenario; the second checks what would support the claim. A third seeks someone whose needs were not considered, and a fourth decides what later record could show improvement. The tutor corrects unwarranted certainty and invites pupils to revise their reasoning. This is a non-operational paper exercise, not a professional inspection, public-safety drill, legal opinion, clinical assessment or advice about real environmental conditions.
For young learners, work with one chapter and only three coloured cards. For upper-primary children, ask for a second possible explanation. For secondary pupils, add the percentage calculation and source validity checks. For advanced learners, introduce a system diagram with several dependencies, an explicit counterexample and a comparison across two periods. In every version, assess whether the student can explain in their own words what would make the intervention fair and what evidence is still missing. The ideal outcome is independent judgement and humane problem-solving, not perfect agreement or a dramatic prediction.
Test the explanation without looking back
- Define: Old alerts and screenshots can appear current without their timestamps or geographic qualifications.
- Trace: Repeated false context may erode trust in genuinely authoritative announcements.
- Check: Verify original publication, version, location and update.
- Correct: Make public corrections visible and easy to understand.
- Practise: Sort imaginary notices by version and origin.
- Limit: Explain why the imaginary Signalport model cannot establish the fate of a real society.
Finish with a handover statement that can be understood by the next learner: “The issue I investigated is … . The first claim is … . My source would be … . One competing explanation is … . I would make the process fairer by … . I would know the remedy worked when … . An important remaining uncertainty is … .” A child who can produce such a statement is learning the habit that civilisations themselves require: keeping knowledge usable, correcting errors, protecting people and handing functioning systems to those who come next.
15. Preparedness rather than improvisation
The clear explanation. Tested roles, training, equipment and accessible plans matter before any hazard occurs. This chapter looks at a concrete piece of early warning, responsible risk communication and preparedness rather than declaring that one problem necessarily ends an entire society. A civilisation is a network of people, accumulated skill, services, relationships and changing institutions. A local weakness deserves investigation even when the wider community remains able to function. It may be serious, but a serious event is not the same thing as the disappearance of a population or its culture.
How this part of the system works
A printed plan may be impossible to carry out if nobody is responsible for maintaining it. Imagine how this might appear in Signalport, a fictional community invented for this lesson. On a normal day, residents seldom think about every person, tool, record or process that makes the service possible. A visitor sees an open door, a printed rule or a functioning piece of equipment; behind it are less visible dependencies. If one element changes, the results depend on buffers, substitutes, qualified people and the surrounding institutions. Some services remain fully available, some continue at reduced capacity, and some need an orderly alternative.
Consider how an official-looking notice can differ from the real service experience. If people cannot complete an ordinary task, find the first confirmed point of difficulty. It may involve staff availability, instructions, a supply, an inaccessible route or a missing authorisation. A mistaken conclusion about cause can lead to the wrong remedy. Record the problem in observable terms and leave room for a competing explanation. For example, a service may have moved to a safer location while an old notice remained on display; that is an information failure, not necessarily a complete loss of capability.
To make the system visible, place five cards on the table in this order: input, trained people, agreed procedure, accessible service, and result for the user. Draw arrows only where a real logical dependency exists in the imagined setting. Then turn one card over and predict which results could change. Another group asks whether the effect must follow or is simply possible. A strong model leaves some arrows uncertain. It also includes a backup card representing alternatives or maintenance, because complex societies often have ways to keep going while one part is being repaired.
What an evidence-led investigation asks
Check official plan ownership and evidence of review. There is a big difference between observing an outcome and proving its cause. Start with source identity, observation date, location, definition, unit and relevant population. If numbers are reported, keep the denominator and distinguish a total stock from a yearly flow. A forecast describes assumptions and possible future outcomes, while a reported event describes a stated observation. An official policy tells us what is intended or required, but not necessarily whether every person received the promised result. This distinction protects pupils from repeating claims that sound certain but rest on incomplete information.
Consider three possible explanations: the service genuinely became weaker; the service remained similar but the way it was measured or reported changed; or the activity was reorganised and continues through another route. These explanations cannot always all be true. What record would discriminate among them? The responsible researcher asks for an appropriate comparison point instead of choosing the most exciting explanation. If the answer cannot be verified, write “not yet established” and name the evidence that would help. In history, geography and current public information, that is an intellectually valuable answer.
Source quality also depends on relevance. A global report can establish important context for early warning, responsible risk communication and preparedness without measuring every local neighbourhood. A photograph can show appearance without demonstrating policy effectiveness or causality. A student’s paper model can reveal a logical possibility but supplies no real data. A published figure may describe one year even when the page containing it was updated in a later year. Keep those dates separate. If a claim has practical safety or legal consequences, refer to current competent authorities and specialists rather than applying a classroom inference to real life.
Different people see different things
Think about a trained worker reviewing a record. Their experience may expose a barrier that an aggregate service count does not show. Meanwhile, another resident may continue receiving the service without difficulty, and a professional may know of a safe workaround that is not publicly visible. A fair explanation asks how these perspectives can be checked and connected without deciding in advance that one person’s experience speaks for everyone. Inaccessible forms, confusing notices or poor coordination matter because public institutions exist to serve real people rather than only to produce good-looking dashboards.
A tutor can ask six respectful questions: Who needs the service? Who is missing from the published data? Is there another way to achieve the intended purpose? Are there relevant differences between users? Would the proposed remedy introduce a new barrier? How could a later reviewer know it worked? None of these questions requires asking a child to disclose private family circumstances, medical information, housing insecurity, legal disputes, employment status or exposure to real hazards. Use fictional characters with neutral descriptions and keep their personal identities entirely invented.
From diagnosis to a credible remedy
Keep emergency action with qualified authorities, not classroom simulations. Begin by preserving things that already work and by recognising who has legitimate authority to act. Next, specify one practical improvement, the people affected, the resources it would require and what observation could verify progress. Do not confuse spending with results. An allocated budget is not a repaired road, a published service plan is not proof of access, and an attractive photograph is not evidence of a functioning institution. A defensible response includes trained people, maintenance, privacy and a way to revisit an error.
The correction cycle has four checkpoints. Observe: describe the issue precisely and record its time and scope. Check: use authoritative evidence and challenge the first hypothesis. Improve: choose a proportionate action within appropriate professional responsibility. Review: test whether the person or service is genuinely better off, including users with different access needs. If the later evidence contradicts an earlier conclusion, document the change rather than hiding it. The purpose of accountability is to help people continue living and learning, not to stage blame as a spectacle.
Imagine that the first explanation was wrong but the institution has already announced a solution. These counterexamples show why good systems need follow-up, clear responsibilities and honesty about limits. They also reveal why a civilisation’s resilience is not simply the number of impressive buildings or digital tools it possesses. People need reliable capability and fair ways to identify problems and improve them.
Worked mathematics: an invented example with correct units
Use 76 coloured paper cards in an invented town square. Suppose 17 cards are flagged as requests requiring an additional check. The flagged proportion is 17 ÷ 76 × 100 = 22.4% when rounded to one decimal place. If the fictional clerk verifies that 5 flagged cards have been dealt with appropriately, 12 flagged cards remain open. All quantities are invented for teaching percentages. These cards are not real people, medical cases, court outcomes, hazardous events, risk probabilities or measurements of an actual place.
Now test whether this number tells the full story. Perhaps 76 represents only submitted requests, not everyone who needed help. Perhaps a change in reporting produces more flagged cards even while service quality improves. Perhaps the clerk recorded a closed case without checking whether the intended user was actually helped. A count, a resolution fraction, a waiting time and a meaningful outcome answer different questions. Ask learners to write the unit, denominator, observation date and the main limitation beside every number. They should resist the temptation to turn a neat calculation into a claim about an entire civilisation.
A safe, original activity for parents and tutors
Map a harmless imaginary club-event rescheduling procedure. Use four paper sheets headed “observation”, “evidence”, “alternative explanation” and “follow-up”. The first student explains what is seen in the invented scenario; the second checks what would support the claim. A third seeks someone whose needs were not considered, and a fourth decides what later record could show improvement. The tutor corrects unwarranted certainty and invites pupils to revise their reasoning. This is a non-operational paper exercise, not a professional inspection, public-safety drill, legal opinion, clinical assessment or advice about real environmental conditions.
For young learners, work with one chapter and only three coloured cards. For upper-primary children, ask for a second possible explanation. For secondary pupils, add the percentage calculation and source validity checks. For advanced learners, introduce a system diagram with several dependencies, an explicit counterexample and a comparison across two periods. In every version, assess whether the student can explain in their own words what would make the intervention fair and what evidence is still missing. The ideal outcome is independent judgement and humane problem-solving, not perfect agreement or a dramatic prediction.
Test the explanation without looking back
- Define: Tested roles, training, equipment and accessible plans matter before any hazard occurs.
- Trace: A printed plan may be impossible to carry out if nobody is responsible for maintaining it.
- Check: Check official plan ownership and evidence of review.
- Correct: Keep emergency action with qualified authorities, not classroom simulations.
- Practise: Map a harmless imaginary club-event rescheduling procedure.
- Limit: Explain why the imaginary Signalport model cannot establish the fate of a real society.
Finish with a handover statement that can be understood by the next learner: “The issue I investigated is … . The first claim is … . My source would be … . One competing explanation is … . I would make the process fairer by … . I would know the remedy worked when … . An important remaining uncertainty is … .” A child who can produce such a statement is learning the habit that civilisations themselves require: keeping knowledge usable, correcting errors, protecting people and handing functioning systems to those who come next.
16. Electricity and warning infrastructure
The clear explanation. Monitoring and communications may depend on reliable power and equipment maintenance. This chapter looks at a concrete piece of early warning, responsible risk communication and preparedness rather than declaring that one problem necessarily ends an entire society. A civilisation is a network of people, accumulated skill, services, relationships and changing institutions. A local weakness deserves investigation even when the wider community remains able to function. It may be serious, but a serious event is not the same thing as the disappearance of a population or its culture.
How this part of the system works
One upstream failure can interrupt several downstream information services. Imagine how this might appear in Signalport, a fictional community invented for this lesson. On a normal day, residents seldom think about every person, tool, record or process that makes the service possible. A visitor sees an open door, a printed rule or a functioning piece of equipment; behind it are less visible dependencies. If one element changes, the results depend on buffers, substitutes, qualified people and the surrounding institutions. Some services remain fully available, some continue at reduced capacity, and some need an orderly alternative.
A useful first move is to isolate one variable at a time. If people cannot complete an ordinary task, find the first confirmed point of difficulty. It may involve staff availability, instructions, a supply, an inaccessible route or a missing authorisation. A mistaken conclusion about cause can lead to the wrong remedy. Record the problem in observable terms and leave room for a competing explanation. For example, a service may have moved to a safer location while an old notice remained on display; that is an information failure, not necessarily a complete loss of capability.
To make the system visible, place five cards on the table in this order: input, trained people, agreed procedure, accessible service, and result for the user. Draw arrows only where a real logical dependency exists in the imagined setting. Then turn one card over and predict which results could change. Another group asks whether the effect must follow or is simply possible. A strong model leaves some arrows uncertain. It also includes a backup card representing alternatives or maintenance, because complex societies often have ways to keep going while one part is being repaired.
What an evidence-led investigation asks
Separate conceptual diagrams from actual critical infrastructure assessments. There is a big difference between observing an outcome and proving its cause. Start with source identity, observation date, location, definition, unit and relevant population. If numbers are reported, keep the denominator and distinguish a total stock from a yearly flow. A forecast describes assumptions and possible future outcomes, while a reported event describes a stated observation. An official policy tells us what is intended or required, but not necessarily whether every person received the promised result. This distinction protects pupils from repeating claims that sound certain but rest on incomplete information.
Consider three possible explanations: the service genuinely became weaker; the service remained similar but the way it was measured or reported changed; or the activity was reorganised and continues through another route. These explanations cannot always all be true. What record would discriminate among them? The responsible researcher asks for an appropriate comparison point instead of choosing the most exciting explanation. If the answer cannot be verified, write “not yet established” and name the evidence that would help. In history, geography and current public information, that is an intellectually valuable answer.
Source quality also depends on relevance. A global report can establish important context for early warning, responsible risk communication and preparedness without measuring every local neighbourhood. A photograph can show appearance without demonstrating policy effectiveness or causality. A student’s paper model can reveal a logical possibility but supplies no real data. A published figure may describe one year even when the page containing it was updated in a later year. Keep those dates separate. If a claim has practical safety or legal consequences, refer to current competent authorities and specialists rather than applying a classroom inference to real life.
Different people see different things
Think about an older resident travelling to a service. Their experience may expose a barrier that an aggregate service count does not show. Meanwhile, another resident may continue receiving the service without difficulty, and a professional may know of a safe workaround that is not publicly visible. A fair explanation asks how these perspectives can be checked and connected without deciding in advance that one person’s experience speaks for everyone. Inaccessible forms, confusing notices or poor coordination matter because public institutions exist to serve real people rather than only to produce good-looking dashboards.
A tutor can ask six respectful questions: Who needs the service? Who is missing from the published data? Is there another way to achieve the intended purpose? Are there relevant differences between users? Would the proposed remedy introduce a new barrier? How could a later reviewer know it worked? None of these questions requires asking a child to disclose private family circumstances, medical information, housing insecurity, legal disputes, employment status or exposure to real hazards. Use fictional characters with neutral descriptions and keep their personal identities entirely invented.
From diagnosis to a credible remedy
Support safe professional maintenance and appropriate backups. Begin by preserving things that already work and by recognising who has legitimate authority to act. Next, specify one practical improvement, the people affected, the resources it would require and what observation could verify progress. Do not confuse spending with results. An allocated budget is not a repaired road, a published service plan is not proof of access, and an attractive photograph is not evidence of a functioning institution. A defensible response includes trained people, maintenance, privacy and a way to revisit an error.
The correction cycle has four checkpoints. Observe: describe the issue precisely and record its time and scope. Check: use authoritative evidence and challenge the first hypothesis. Improve: choose a proportionate action within appropriate professional responsibility. Review: test whether the person or service is genuinely better off, including users with different access needs. If the later evidence contradicts an earlier conclusion, document the change rather than hiding it. The purpose of accountability is to help people continue living and learning, not to stage blame as a spectacle.
Imagine that the repair succeeded for the easiest cases but not for someone who needs an alternative format. These counterexamples show why good systems need follow-up, clear responsibilities and honesty about limits. They also reveal why a civilisation’s resilience is not simply the number of impressive buildings or digital tools it possesses. People need reliable capability and fair ways to identify problems and improve them.
Worked mathematics: an invented example with correct units
Use 48 coloured paper cards in a classroom model street. Suppose 5 cards are flagged as requests requiring an additional check. The flagged proportion is 5 ÷ 48 × 100 = 10.4% when rounded to one decimal place. If the fictional clerk verifies that 4 flagged cards have been dealt with appropriately, 1 flagged cards remain open. All quantities are invented for teaching percentages. These cards are not real people, medical cases, court outcomes, hazardous events, risk probabilities or measurements of an actual place.
Now test whether this number tells the full story. Perhaps 48 represents only submitted requests, not everyone who needed help. Perhaps a change in reporting produces more flagged cards even while service quality improves. Perhaps the clerk recorded a closed case without checking whether the intended user was actually helped. A count, a resolution fraction, a waiting time and a meaningful outcome answer different questions. Ask learners to write the unit, denominator, observation date and the main limitation beside every number. They should resist the temptation to turn a neat calculation into a claim about an entire civilisation.
A safe, original activity for parents and tutors
Link model cards for power, notice and public service. Use four paper sheets headed “observation”, “evidence”, “alternative explanation” and “follow-up”. The first student explains what is seen in the invented scenario; the second checks what would support the claim. A third seeks someone whose needs were not considered, and a fourth decides what later record could show improvement. The tutor corrects unwarranted certainty and invites pupils to revise their reasoning. This is a non-operational paper exercise, not a professional inspection, public-safety drill, legal opinion, clinical assessment or advice about real environmental conditions.
For young learners, work with one chapter and only three coloured cards. For upper-primary children, ask for a second possible explanation. For secondary pupils, add the percentage calculation and source validity checks. For advanced learners, introduce a system diagram with several dependencies, an explicit counterexample and a comparison across two periods. In every version, assess whether the student can explain in their own words what would make the intervention fair and what evidence is still missing. The ideal outcome is independent judgement and humane problem-solving, not perfect agreement or a dramatic prediction.
Test the explanation without looking back
- Define: Monitoring and communications may depend on reliable power and equipment maintenance.
- Trace: One upstream failure can interrupt several downstream information services.
- Check: Separate conceptual diagrams from actual critical infrastructure assessments.
- Correct: Support safe professional maintenance and appropriate backups.
- Practise: Link model cards for power, notice and public service.
- Limit: Explain why the imaginary Signalport model cannot establish the fate of a real society.
Finish with a handover statement that can be understood by the next learner: “The issue I investigated is … . The first claim is … . My source would be … . One competing explanation is … . I would make the process fairer by … . I would know the remedy worked when … . An important remaining uncertainty is … .” A child who can produce such a statement is learning the habit that civilisations themselves require: keeping knowledge usable, correcting errors, protecting people and handing functioning systems to those who come next.
17. Transport coordination and access
The clear explanation. People need trustworthy information about services and routes during disruption. This chapter looks at a concrete piece of early warning, responsible risk communication and preparedness rather than declaring that one problem necessarily ends an entire society. A civilisation is a network of people, accumulated skill, services, relationships and changing institutions. A local weakness deserves investigation even when the wider community remains able to function. It may be serious, but a serious event is not the same thing as the disappearance of a population or its culture.
How this part of the system works
A timely alert may still be unusable if relevant access is not maintained. Imagine how this might appear in Signalport, a fictional community invented for this lesson. On a normal day, residents seldom think about every person, tool, record or process that makes the service possible. A visitor sees an open door, a printed rule or a functioning piece of equipment; behind it are less visible dependencies. If one element changes, the results depend on buffers, substitutes, qualified people and the surrounding institutions. Some services remain fully available, some continue at reduced capacity, and some need an orderly alternative.
Begin with a service user’s experience, not with a dramatic headline. If people cannot complete an ordinary task, find the first confirmed point of difficulty. It may involve staff availability, instructions, a supply, an inaccessible route or a missing authorisation. A mistaken conclusion about cause can lead to the wrong remedy. Record the problem in observable terms and leave room for a competing explanation. For example, a service may have moved to a safer location while an old notice remained on display; that is an information failure, not necessarily a complete loss of capability.
To make the system visible, place five cards on the table in this order: input, trained people, agreed procedure, accessible service, and result for the user. Draw arrows only where a real logical dependency exists in the imagined setting. Then turn one card over and predict which results could change. Another group asks whether the effect must follow or is simply possible. A strong model leaves some arrows uncertain. It also includes a backup card representing alternatives or maintenance, because complex societies often have ways to keep going while one part is being repaired.
What an evidence-led investigation asks
Check what a competent agency confirms for its own area. There is a big difference between observing an outcome and proving its cause. Start with source identity, observation date, location, definition, unit and relevant population. If numbers are reported, keep the denominator and distinguish a total stock from a yearly flow. A forecast describes assumptions and possible future outcomes, while a reported event describes a stated observation. An official policy tells us what is intended or required, but not necessarily whether every person received the promised result. This distinction protects pupils from repeating claims that sound certain but rest on incomplete information.
Consider three possible explanations: the service genuinely became weaker; the service remained similar but the way it was measured or reported changed; or the activity was reorganised and continues through another route. These explanations cannot always all be true. What record would discriminate among them? The responsible researcher asks for an appropriate comparison point instead of choosing the most exciting explanation. If the answer cannot be verified, write “not yet established” and name the evidence that would help. In history, geography and current public information, that is an intellectually valuable answer.
Source quality also depends on relevance. A global report can establish important context for early warning, responsible risk communication and preparedness without measuring every local neighbourhood. A photograph can show appearance without demonstrating policy effectiveness or causality. A student’s paper model can reveal a logical possibility but supplies no real data. A published figure may describe one year even when the page containing it was updated in a later year. Keep those dates separate. If a claim has practical safety or legal consequences, refer to current competent authorities and specialists rather than applying a classroom inference to real life.
Different people see different things
Think about a newcomer seeking clear information. Their experience may expose a barrier that an aggregate service count does not show. Meanwhile, another resident may continue receiving the service without difficulty, and a professional may know of a safe workaround that is not publicly visible. A fair explanation asks how these perspectives can be checked and connected without deciding in advance that one person’s experience speaks for everyone. Inaccessible forms, confusing notices or poor coordination matter because public institutions exist to serve real people rather than only to produce good-looking dashboards.
A tutor can ask six respectful questions: Who needs the service? Who is missing from the published data? Is there another way to achieve the intended purpose? Are there relevant differences between users? Would the proposed remedy introduce a new barrier? How could a later reviewer know it worked? None of these questions requires asking a child to disclose private family circumstances, medical information, housing insecurity, legal disputes, employment status or exposure to real hazards. Use fictional characters with neutral descriptions and keep their personal identities entirely invented.
From diagnosis to a credible remedy
Never use a student map to recommend a live evacuation route. Begin by preserving things that already work and by recognising who has legitimate authority to act. Next, specify one practical improvement, the people affected, the resources it would require and what observation could verify progress. Do not confuse spending with results. An allocated budget is not a repaired road, a published service plan is not proof of access, and an attractive photograph is not evidence of a functioning institution. A defensible response includes trained people, maintenance, privacy and a way to revisit an error.
The correction cycle has four checkpoints. Observe: describe the issue precisely and record its time and scope. Check: use authoritative evidence and challenge the first hypothesis. Improve: choose a proportionate action within appropriate professional responsibility. Review: test whether the person or service is genuinely better off, including users with different access needs. If the later evidence contradicts an earlier conclusion, document the change rather than hiding it. The purpose of accountability is to help people continue living and learning, not to stage blame as a spectacle.
Suppose the fictional service now reports a faster average but a few users wait much longer than before. These counterexamples show why good systems need follow-up, clear responsibilities and honesty about limits. They also reveal why a civilisation’s resilience is not simply the number of impressive buildings or digital tools it possesses. People need reliable capability and fair ways to identify problems and improve them.
Worked mathematics: an invented example with correct units
Use 55 coloured paper cards in a mock community timetable. Suppose 8 cards are flagged as requests requiring an additional check. The flagged proportion is 8 ÷ 55 × 100 = 14.5% when rounded to one decimal place. If the fictional clerk verifies that 4 flagged cards have been dealt with appropriately, 4 flagged cards remain open. All quantities are invented for teaching percentages. These cards are not real people, medical cases, court outcomes, hazardous events, risk probabilities or measurements of an actual place.
Now test whether this number tells the full story. Perhaps 55 represents only submitted requests, not everyone who needed help. Perhaps a change in reporting produces more flagged cards even while service quality improves. Perhaps the clerk recorded a closed case without checking whether the intended user was actually helped. A count, a resolution fraction, a waiting time and a meaningful outcome answer different questions. Ask learners to write the unit, denominator, observation date and the main limitation beside every number. They should resist the temptation to turn a neat calculation into a claim about an entire civilisation.
A safe, original activity for parents and tutors
Compare two fictional access routes to a school library. Use four paper sheets headed “observation”, “evidence”, “alternative explanation” and “follow-up”. The first student explains what is seen in the invented scenario; the second checks what would support the claim. A third seeks someone whose needs were not considered, and a fourth decides what later record could show improvement. The tutor corrects unwarranted certainty and invites pupils to revise their reasoning. This is a non-operational paper exercise, not a professional inspection, public-safety drill, legal opinion, clinical assessment or advice about real environmental conditions.
For young learners, work with one chapter and only three coloured cards. For upper-primary children, ask for a second possible explanation. For secondary pupils, add the percentage calculation and source validity checks. For advanced learners, introduce a system diagram with several dependencies, an explicit counterexample and a comparison across two periods. In every version, assess whether the student can explain in their own words what would make the intervention fair and what evidence is still missing. The ideal outcome is independent judgement and humane problem-solving, not perfect agreement or a dramatic prediction.
Test the explanation without looking back
- Define: People need trustworthy information about services and routes during disruption.
- Trace: A timely alert may still be unusable if relevant access is not maintained.
- Check: Check what a competent agency confirms for its own area.
- Correct: Never use a student map to recommend a live evacuation route.
- Practise: Compare two fictional access routes to a school library.
- Limit: Explain why the imaginary Signalport model cannot establish the fate of a real society.
Finish with a handover statement that can be understood by the next learner: “The issue I investigated is … . The first claim is … . My source would be … . One competing explanation is … . I would make the process fairer by … . I would know the remedy worked when … . An important remaining uncertainty is … .” A child who can produce such a statement is learning the habit that civilisations themselves require: keeping knowledge usable, correcting errors, protecting people and handing functioning systems to those who come next.
18. Health services and communication
The clear explanation. Essential care needs staffing, supplies, records and coordination in addition to receiving alerts. This chapter looks at a concrete piece of early warning, responsible risk communication and preparedness rather than declaring that one problem necessarily ends an entire society. A civilisation is a network of people, accumulated skill, services, relationships and changing institutions. A local weakness deserves investigation even when the wider community remains able to function. It may be serious, but a serious event is not the same thing as the disappearance of a population or its culture.
How this part of the system works
A health facility may have information without the ability to maintain normal services. Imagine how this might appear in Signalport, a fictional community invented for this lesson. On a normal day, residents seldom think about every person, tool, record or process that makes the service possible. A visitor sees an open door, a printed rule or a functioning piece of equipment; behind it are less visible dependencies. If one element changes, the results depend on buffers, substitutes, qualified people and the surrounding institutions. Some services remain fully available, some continue at reduced capacity, and some need an orderly alternative.
The most revealing question is often what people can still do. If people cannot complete an ordinary task, find the first confirmed point of difficulty. It may involve staff availability, instructions, a supply, an inaccessible route or a missing authorisation. A mistaken conclusion about cause can lead to the wrong remedy. Record the problem in observable terms and leave room for a competing explanation. For example, a service may have moved to a safer location while an old notice remained on display; that is an information failure, not necessarily a complete loss of capability.
To make the system visible, place five cards on the table in this order: input, trained people, agreed procedure, accessible service, and result for the user. Draw arrows only where a real logical dependency exists in the imagined setting. Then turn one card over and predict which results could change. Another group asks whether the effect must follow or is simply possible. A strong model leaves some arrows uncertain. It also includes a backup card representing alternatives or maintenance, because complex societies often have ways to keep going while one part is being repaired.
What an evidence-led investigation asks
Distinguish official notices from verified operational capacity. There is a big difference between observing an outcome and proving its cause. Start with source identity, observation date, location, definition, unit and relevant population. If numbers are reported, keep the denominator and distinguish a total stock from a yearly flow. A forecast describes assumptions and possible future outcomes, while a reported event describes a stated observation. An official policy tells us what is intended or required, but not necessarily whether every person received the promised result. This distinction protects pupils from repeating claims that sound certain but rest on incomplete information.
Consider three possible explanations: the service genuinely became weaker; the service remained similar but the way it was measured or reported changed; or the activity was reorganised and continues through another route. These explanations cannot always all be true. What record would discriminate among them? The responsible researcher asks for an appropriate comparison point instead of choosing the most exciting explanation. If the answer cannot be verified, write “not yet established” and name the evidence that would help. In history, geography and current public information, that is an intellectually valuable answer.
Source quality also depends on relevance. A global report can establish important context for early warning, responsible risk communication and preparedness without measuring every local neighbourhood. A photograph can show appearance without demonstrating policy effectiveness or causality. A student’s paper model can reveal a logical possibility but supplies no real data. A published figure may describe one year even when the page containing it was updated in a later year. Keep those dates separate. If a claim has practical safety or legal consequences, refer to current competent authorities and specialists rather than applying a classroom inference to real life.
Different people see different things
Think about a person needing an accessible format. Their experience may expose a barrier that an aggregate service count does not show. Meanwhile, another resident may continue receiving the service without difficulty, and a professional may know of a safe workaround that is not publicly visible. A fair explanation asks how these perspectives can be checked and connected without deciding in advance that one person’s experience speaks for everyone. Inaccessible forms, confusing notices or poor coordination matter because public institutions exist to serve real people rather than only to produce good-looking dashboards.
A tutor can ask six respectful questions: Who needs the service? Who is missing from the published data? Is there another way to achieve the intended purpose? Are there relevant differences between users? Would the proposed remedy introduce a new barrier? How could a later reviewer know it worked? None of these questions requires asking a child to disclose private family circumstances, medical information, housing insecurity, legal disputes, employment status or exposure to real hazards. Use fictional characters with neutral descriptions and keep their personal identities entirely invented.
From diagnosis to a credible remedy
Refer real medical situations to professionals. Begin by preserving things that already work and by recognising who has legitimate authority to act. Next, specify one practical improvement, the people affected, the resources it would require and what observation could verify progress. Do not confuse spending with results. An allocated budget is not a repaired road, a published service plan is not proof of access, and an attractive photograph is not evidence of a functioning institution. A defensible response includes trained people, maintenance, privacy and a way to revisit an error.
The correction cycle has four checkpoints. Observe: describe the issue precisely and record its time and scope. Check: use authoritative evidence and challenge the first hypothesis. Improve: choose a proportionate action within appropriate professional responsibility. Review: test whether the person or service is genuinely better off, including users with different access needs. If the later evidence contradicts an earlier conclusion, document the change rather than hiding it. The purpose of accountability is to help people continue living and learning, not to stage blame as a spectacle.
What if a cheaper short-term fix prevents the next group from maintaining the improvement? These counterexamples show why good systems need follow-up, clear responsibilities and honesty about limits. They also reveal why a civilisation’s resilience is not simply the number of impressive buildings or digital tools it possesses. People need reliable capability and fair ways to identify problems and improve them.
Worked mathematics: an invented example with correct units
Use 62 coloured paper cards in an imaginary town archive. Suppose 11 cards are flagged as requests requiring an additional check. The flagged proportion is 11 ÷ 62 × 100 = 17.7% when rounded to one decimal place. If the fictional clerk verifies that 8 flagged cards have been dealt with appropriately, 3 flagged cards remain open. All quantities are invented for teaching percentages. These cards are not real people, medical cases, court outcomes, hazardous events, risk probabilities or measurements of an actual place.
Now test whether this number tells the full story. Perhaps 62 represents only submitted requests, not everyone who needed help. Perhaps a change in reporting produces more flagged cards even while service quality improves. Perhaps the clerk recorded a closed case without checking whether the intended user was actually helped. A count, a resolution fraction, a waiting time and a meaningful outcome answer different questions. Ask learners to write the unit, denominator, observation date and the main limitation beside every number. They should resist the temptation to turn a neat calculation into a claim about an entire civilisation.
A safe, original activity for parents and tutors
Arrange invented appointment cards through a routine closure. Use four paper sheets headed “observation”, “evidence”, “alternative explanation” and “follow-up”. The first student explains what is seen in the invented scenario; the second checks what would support the claim. A third seeks someone whose needs were not considered, and a fourth decides what later record could show improvement. The tutor corrects unwarranted certainty and invites pupils to revise their reasoning. This is a non-operational paper exercise, not a professional inspection, public-safety drill, legal opinion, clinical assessment or advice about real environmental conditions.
For young learners, work with one chapter and only three coloured cards. For upper-primary children, ask for a second possible explanation. For secondary pupils, add the percentage calculation and source validity checks. For advanced learners, introduce a system diagram with several dependencies, an explicit counterexample and a comparison across two periods. In every version, assess whether the student can explain in their own words what would make the intervention fair and what evidence is still missing. The ideal outcome is independent judgement and humane problem-solving, not perfect agreement or a dramatic prediction.
Test the explanation without looking back
- Define: Essential care needs staffing, supplies, records and coordination in addition to receiving alerts.
- Trace: A health facility may have information without the ability to maintain normal services.
- Check: Distinguish official notices from verified operational capacity.
- Correct: Refer real medical situations to professionals.
- Practise: Arrange invented appointment cards through a routine closure.
- Limit: Explain why the imaginary Signalport model cannot establish the fate of a real society.
Finish with a handover statement that can be understood by the next learner: “The issue I investigated is … . The first claim is … . My source would be … . One competing explanation is … . I would make the process fairer by … . I would know the remedy worked when … . An important remaining uncertainty is … .” A child who can produce such a statement is learning the habit that civilisations themselves require: keeping knowledge usable, correcting errors, protecting people and handing functioning systems to those who come next.
19. Coastal hazards and changing exposure
The clear explanation. Coastal risks involve climate, tide, infrastructure and local conditions together. This chapter looks at a concrete piece of early warning, responsible risk communication and preparedness rather than declaring that one problem necessarily ends an entire society. A civilisation is a network of people, accumulated skill, services, relationships and changing institutions. A local weakness deserves investigation even when the wider community remains able to function. It may be serious, but a serious event is not the same thing as the disappearance of a population or its culture.
How this part of the system works
One high-water photograph cannot establish risk for every building nearby. Imagine how this might appear in Signalport, a fictional community invented for this lesson. On a normal day, residents seldom think about every person, tool, record or process that makes the service possible. A visitor sees an open door, a printed rule or a functioning piece of equipment; behind it are less visible dependencies. If one element changes, the results depend on buffers, substitutes, qualified people and the surrounding institutions. Some services remain fully available, some continue at reduced capacity, and some need an orderly alternative.
Treat a disruption as a hypothesis about dependencies, not an automatic cascade. If people cannot complete an ordinary task, find the first confirmed point of difficulty. It may involve staff availability, instructions, a supply, an inaccessible route or a missing authorisation. A mistaken conclusion about cause can lead to the wrong remedy. Record the problem in observable terms and leave room for a competing explanation. For example, a service may have moved to a safer location while an old notice remained on display; that is an information failure, not necessarily a complete loss of capability.
To make the system visible, place five cards on the table in this order: input, trained people, agreed procedure, accessible service, and result for the user. Draw arrows only where a real logical dependency exists in the imagined setting. Then turn one card over and predict which results could change. Another group asks whether the effect must follow or is simply possible. A strong model leaves some arrows uncertain. It also includes a backup card representing alternatives or maintenance, because complex societies often have ways to keep going while one part is being repaired.
What an evidence-led investigation asks
Use authoritative maps with scale, date and stated assumptions. There is a big difference between observing an outcome and proving its cause. Start with source identity, observation date, location, definition, unit and relevant population. If numbers are reported, keep the denominator and distinguish a total stock from a yearly flow. A forecast describes assumptions and possible future outcomes, while a reported event describes a stated observation. An official policy tells us what is intended or required, but not necessarily whether every person received the promised result. This distinction protects pupils from repeating claims that sound certain but rest on incomplete information.
Consider three possible explanations: the service genuinely became weaker; the service remained similar but the way it was measured or reported changed; or the activity was reorganised and continues through another route. These explanations cannot always all be true. What record would discriminate among them? The responsible researcher asks for an appropriate comparison point instead of choosing the most exciting explanation. If the answer cannot be verified, write “not yet established” and name the evidence that would help. In history, geography and current public information, that is an intellectually valuable answer.
Source quality also depends on relevance. A global report can establish important context for early warning, responsible risk communication and preparedness without measuring every local neighbourhood. A photograph can show appearance without demonstrating policy effectiveness or causality. A student’s paper model can reveal a logical possibility but supplies no real data. A published figure may describe one year even when the page containing it was updated in a later year. Keep those dates separate. If a claim has practical safety or legal consequences, refer to current competent authorities and specialists rather than applying a classroom inference to real life.
Different people see different things
Think about a parent with a limited schedule. Their experience may expose a barrier that an aggregate service count does not show. Meanwhile, another resident may continue receiving the service without difficulty, and a professional may know of a safe workaround that is not publicly visible. A fair explanation asks how these perspectives can be checked and connected without deciding in advance that one person’s experience speaks for everyone. Inaccessible forms, confusing notices or poor coordination matter because public institutions exist to serve real people rather than only to produce good-looking dashboards.
A tutor can ask six respectful questions: Who needs the service? Who is missing from the published data? Is there another way to achieve the intended purpose? Are there relevant differences between users? Would the proposed remedy introduce a new barrier? How could a later reviewer know it worked? None of these questions requires asking a child to disclose private family circumstances, medical information, housing insecurity, legal disputes, employment status or exposure to real hazards. Use fictional characters with neutral descriptions and keep their personal identities entirely invented.
From diagnosis to a credible remedy
Preserve technical expertise and safe public communication. Begin by preserving things that already work and by recognising who has legitimate authority to act. Next, specify one practical improvement, the people affected, the resources it would require and what observation could verify progress. Do not confuse spending with results. An allocated budget is not a repaired road, a published service plan is not proof of access, and an attractive photograph is not evidence of a functioning institution. A defensible response includes trained people, maintenance, privacy and a way to revisit an error.
The correction cycle has four checkpoints. Observe: describe the issue precisely and record its time and scope. Check: use authoritative evidence and challenge the first hypothesis. Improve: choose a proportionate action within appropriate professional responsibility. Review: test whether the person or service is genuinely better off, including users with different access needs. If the later evidence contradicts an earlier conclusion, document the change rather than hiding it. The purpose of accountability is to help people continue living and learning, not to stage blame as a spectacle.
What happens when the person who designed the process is absent and no usable handover exists? These counterexamples show why good systems need follow-up, clear responsibilities and honesty about limits. They also reveal why a civilisation’s resilience is not simply the number of impressive buildings or digital tools it possesses. People need reliable capability and fair ways to identify problems and improve them.
Worked mathematics: an invented example with correct units
Use 69 coloured paper cards in a quiet paper library. Suppose 14 cards are flagged as requests requiring an additional check. The flagged proportion is 14 ÷ 69 × 100 = 20.3% when rounded to one decimal place. If the fictional clerk verifies that 3 flagged cards have been dealt with appropriately, 11 flagged cards remain open. All quantities are invented for teaching percentages. These cards are not real people, medical cases, court outcomes, hazardous events, risk probabilities or measurements of an actual place.
Now test whether this number tells the full story. Perhaps 69 represents only submitted requests, not everyone who needed help. Perhaps a change in reporting produces more flagged cards even while service quality improves. Perhaps the clerk recorded a closed case without checking whether the intended user was actually helped. A count, a resolution fraction, a waiting time and a meaningful outcome answer different questions. Ask learners to write the unit, denominator, observation date and the main limitation beside every number. They should resist the temptation to turn a neat calculation into a claim about an entire civilisation.
A safe, original activity for parents and tutors
Label an invented shoreline map with limitations. Use four paper sheets headed “observation”, “evidence”, “alternative explanation” and “follow-up”. The first student explains what is seen in the invented scenario; the second checks what would support the claim. A third seeks someone whose needs were not considered, and a fourth decides what later record could show improvement. The tutor corrects unwarranted certainty and invites pupils to revise their reasoning. This is a non-operational paper exercise, not a professional inspection, public-safety drill, legal opinion, clinical assessment or advice about real environmental conditions.
For young learners, work with one chapter and only three coloured cards. For upper-primary children, ask for a second possible explanation. For secondary pupils, add the percentage calculation and source validity checks. For advanced learners, introduce a system diagram with several dependencies, an explicit counterexample and a comparison across two periods. In every version, assess whether the student can explain in their own words what would make the intervention fair and what evidence is still missing. The ideal outcome is independent judgement and humane problem-solving, not perfect agreement or a dramatic prediction.
Test the explanation without looking back
- Define: Coastal risks involve climate, tide, infrastructure and local conditions together.
- Trace: One high-water photograph cannot establish risk for every building nearby.
- Check: Use authoritative maps with scale, date and stated assumptions.
- Correct: Preserve technical expertise and safe public communication.
- Practise: Label an invented shoreline map with limitations.
- Limit: Explain why the imaginary Signalport model cannot establish the fate of a real society.
Finish with a handover statement that can be understood by the next learner: “The issue I investigated is … . The first claim is … . My source would be … . One competing explanation is … . I would make the process fairer by … . I would know the remedy worked when … . An important remaining uncertainty is … .” A child who can produce such a statement is learning the habit that civilisations themselves require: keeping knowledge usable, correcting errors, protecting people and handing functioning systems to those who come next.
20. Heat and unequal exposure
The clear explanation. Heat can affect places and people differently depending on occupation, housing and service access. This chapter looks at a concrete piece of early warning, responsible risk communication and preparedness rather than declaring that one problem necessarily ends an entire society. A civilisation is a network of people, accumulated skill, services, relationships and changing institutions. A local weakness deserves investigation even when the wider community remains able to function. It may be serious, but a serious event is not the same thing as the disappearance of a population or its culture.
How this part of the system works
A single temperature value may fail to describe indoor or individual conditions. Imagine how this might appear in Signalport, a fictional community invented for this lesson. On a normal day, residents seldom think about every person, tool, record or process that makes the service possible. A visitor sees an open door, a printed rule or a functioning piece of equipment; behind it are less visible dependencies. If one element changes, the results depend on buffers, substitutes, qualified people and the surrounding institutions. Some services remain fully available, some continue at reduced capacity, and some need an orderly alternative.
Consider how an official-looking notice can differ from the real service experience. If people cannot complete an ordinary task, find the first confirmed point of difficulty. It may involve staff availability, instructions, a supply, an inaccessible route or a missing authorisation. A mistaken conclusion about cause can lead to the wrong remedy. Record the problem in observable terms and leave room for a competing explanation. For example, a service may have moved to a safer location while an old notice remained on display; that is an information failure, not necessarily a complete loss of capability.
To make the system visible, place five cards on the table in this order: input, trained people, agreed procedure, accessible service, and result for the user. Draw arrows only where a real logical dependency exists in the imagined setting. Then turn one card over and predict which results could change. Another group asks whether the effect must follow or is simply possible. A strong model leaves some arrows uncertain. It also includes a backup card representing alternatives or maintenance, because complex societies often have ways to keep going while one part is being repaired.
What an evidence-led investigation asks
Check official heat measures, timing and guidance. There is a big difference between observing an outcome and proving its cause. Start with source identity, observation date, location, definition, unit and relevant population. If numbers are reported, keep the denominator and distinguish a total stock from a yearly flow. A forecast describes assumptions and possible future outcomes, while a reported event describes a stated observation. An official policy tells us what is intended or required, but not necessarily whether every person received the promised result. This distinction protects pupils from repeating claims that sound certain but rest on incomplete information.
Consider three possible explanations: the service genuinely became weaker; the service remained similar but the way it was measured or reported changed; or the activity was reorganised and continues through another route. These explanations cannot always all be true. What record would discriminate among them? The responsible researcher asks for an appropriate comparison point instead of choosing the most exciting explanation. If the answer cannot be verified, write “not yet established” and name the evidence that would help. In history, geography and current public information, that is an intellectually valuable answer.
Source quality also depends on relevance. A global report can establish important context for early warning, responsible risk communication and preparedness without measuring every local neighbourhood. A photograph can show appearance without demonstrating policy effectiveness or causality. A student’s paper model can reveal a logical possibility but supplies no real data. A published figure may describe one year even when the page containing it was updated in a later year. Keep those dates separate. If a claim has practical safety or legal consequences, refer to current competent authorities and specialists rather than applying a classroom inference to real life.
Different people see different things
Think about a student using a school service. Their experience may expose a barrier that an aggregate service count does not show. Meanwhile, another resident may continue receiving the service without difficulty, and a professional may know of a safe workaround that is not publicly visible. A fair explanation asks how these perspectives can be checked and connected without deciding in advance that one person’s experience speaks for everyone. Inaccessible forms, confusing notices or poor coordination matter because public institutions exist to serve real people rather than only to produce good-looking dashboards.
A tutor can ask six respectful questions: Who needs the service? Who is missing from the published data? Is there another way to achieve the intended purpose? Are there relevant differences between users? Would the proposed remedy introduce a new barrier? How could a later reviewer know it worked? None of these questions requires asking a child to disclose private family circumstances, medical information, housing insecurity, legal disputes, employment status or exposure to real hazards. Use fictional characters with neutral descriptions and keep their personal identities entirely invented.
From diagnosis to a credible remedy
Avoid individual medical advice and use qualified current sources. Begin by preserving things that already work and by recognising who has legitimate authority to act. Next, specify one practical improvement, the people affected, the resources it would require and what observation could verify progress. Do not confuse spending with results. An allocated budget is not a repaired road, a published service plan is not proof of access, and an attractive photograph is not evidence of a functioning institution. A defensible response includes trained people, maintenance, privacy and a way to revisit an error.
The correction cycle has four checkpoints. Observe: describe the issue precisely and record its time and scope. Check: use authoritative evidence and challenge the first hypothesis. Improve: choose a proportionate action within appropriate professional responsibility. Review: test whether the person or service is genuinely better off, including users with different access needs. If the later evidence contradicts an earlier conclusion, document the change rather than hiding it. The purpose of accountability is to help people continue living and learning, not to stage blame as a spectacle.
Imagine that the first explanation was wrong but the institution has already announced a solution. These counterexamples show why good systems need follow-up, clear responsibilities and honesty about limits. They also reveal why a civilisation’s resilience is not simply the number of impressive buildings or digital tools it possesses. People need reliable capability and fair ways to identify problems and improve them.
Worked mathematics: an invented example with correct units
Use 76 coloured paper cards in a fictional service desk. Suppose 17 cards are flagged as requests requiring an additional check. The flagged proportion is 17 ÷ 76 × 100 = 22.4% when rounded to one decimal place. If the fictional clerk verifies that 7 flagged cards have been dealt with appropriately, 10 flagged cards remain open. All quantities are invented for teaching percentages. These cards are not real people, medical cases, court outcomes, hazardous events, risk probabilities or measurements of an actual place.
Now test whether this number tells the full story. Perhaps 76 represents only submitted requests, not everyone who needed help. Perhaps a change in reporting produces more flagged cards even while service quality improves. Perhaps the clerk recorded a closed case without checking whether the intended user was actually helped. A count, a resolution fraction, a waiting time and a meaningful outcome answer different questions. Ask learners to write the unit, denominator, observation date and the main limitation beside every number. They should resist the temptation to turn a neat calculation into a claim about an entire civilisation.
A safe, original activity for parents and tutors
Compare fictional shade designs. Use four paper sheets headed “observation”, “evidence”, “alternative explanation” and “follow-up”. The first student explains what is seen in the invented scenario; the second checks what would support the claim. A third seeks someone whose needs were not considered, and a fourth decides what later record could show improvement. The tutor corrects unwarranted certainty and invites pupils to revise their reasoning. This is a non-operational paper exercise, not a professional inspection, public-safety drill, legal opinion, clinical assessment or advice about real environmental conditions.
For young learners, work with one chapter and only three coloured cards. For upper-primary children, ask for a second possible explanation. For secondary pupils, add the percentage calculation and source validity checks. For advanced learners, introduce a system diagram with several dependencies, an explicit counterexample and a comparison across two periods. In every version, assess whether the student can explain in their own words what would make the intervention fair and what evidence is still missing. The ideal outcome is independent judgement and humane problem-solving, not perfect agreement or a dramatic prediction.
Test the explanation without looking back
- Define: Heat can affect places and people differently depending on occupation, housing and service access.
- Trace: A single temperature value may fail to describe indoor or individual conditions.
- Check: Check official heat measures, timing and guidance.
- Correct: Avoid individual medical advice and use qualified current sources.
- Practise: Compare fictional shade designs.
- Limit: Explain why the imaginary Signalport model cannot establish the fate of a real society.
Finish with a handover statement that can be understood by the next learner: “The issue I investigated is … . The first claim is … . My source would be … . One competing explanation is … . I would make the process fairer by … . I would know the remedy worked when … . An important remaining uncertainty is … .” A child who can produce such a statement is learning the habit that civilisations themselves require: keeping knowledge usable, correcting errors, protecting people and handing functioning systems to those who come next.
21. Heavy rain and urban flooding
The clear explanation. Rainfall and flooding are related through drainage, topography and infrastructure. This chapter looks at a concrete piece of early warning, responsible risk communication and preparedness rather than declaring that one problem necessarily ends an entire society. A civilisation is a network of people, accumulated skill, services, relationships and changing institutions. A local weakness deserves investigation even when the wider community remains able to function. It may be serious, but a serious event is not the same thing as the disappearance of a population or its culture.
How this part of the system works
An online rain reading does not prove a specific street or path is safe. Imagine how this might appear in Signalport, a fictional community invented for this lesson. On a normal day, residents seldom think about every person, tool, record or process that makes the service possible. A visitor sees an open door, a printed rule or a functioning piece of equipment; behind it are less visible dependencies. If one element changes, the results depend on buffers, substitutes, qualified people and the surrounding institutions. Some services remain fully available, some continue at reduced capacity, and some need an orderly alternative.
A useful first move is to isolate one variable at a time. If people cannot complete an ordinary task, find the first confirmed point of difficulty. It may involve staff availability, instructions, a supply, an inaccessible route or a missing authorisation. A mistaken conclusion about cause can lead to the wrong remedy. Record the problem in observable terms and leave room for a competing explanation. For example, a service may have moved to a safer location while an old notice remained on display; that is an information failure, not necessarily a complete loss of capability.
To make the system visible, place five cards on the table in this order: input, trained people, agreed procedure, accessible service, and result for the user. Draw arrows only where a real logical dependency exists in the imagined setting. Then turn one card over and predict which results could change. Another group asks whether the effect must follow or is simply possible. A strong model leaves some arrows uncertain. It also includes a backup card representing alternatives or maintenance, because complex societies often have ways to keep going while one part is being repaired.
What an evidence-led investigation asks
Verify official alerts and the date of observation. There is a big difference between observing an outcome and proving its cause. Start with source identity, observation date, location, definition, unit and relevant population. If numbers are reported, keep the denominator and distinguish a total stock from a yearly flow. A forecast describes assumptions and possible future outcomes, while a reported event describes a stated observation. An official policy tells us what is intended or required, but not necessarily whether every person received the promised result. This distinction protects pupils from repeating claims that sound certain but rest on incomplete information.
Consider three possible explanations: the service genuinely became weaker; the service remained similar but the way it was measured or reported changed; or the activity was reorganised and continues through another route. These explanations cannot always all be true. What record would discriminate among them? The responsible researcher asks for an appropriate comparison point instead of choosing the most exciting explanation. If the answer cannot be verified, write “not yet established” and name the evidence that would help. In history, geography and current public information, that is an intellectually valuable answer.
Source quality also depends on relevance. A global report can establish important context for early warning, responsible risk communication and preparedness without measuring every local neighbourhood. A photograph can show appearance without demonstrating policy effectiveness or causality. A student’s paper model can reveal a logical possibility but supplies no real data. A published figure may describe one year even when the page containing it was updated in a later year. Keep those dates separate. If a claim has practical safety or legal consequences, refer to current competent authorities and specialists rather than applying a classroom inference to real life.
Different people see different things
Think about a trained worker reviewing a record. Their experience may expose a barrier that an aggregate service count does not show. Meanwhile, another resident may continue receiving the service without difficulty, and a professional may know of a safe workaround that is not publicly visible. A fair explanation asks how these perspectives can be checked and connected without deciding in advance that one person’s experience speaks for everyone. Inaccessible forms, confusing notices or poor coordination matter because public institutions exist to serve real people rather than only to produce good-looking dashboards.
A tutor can ask six respectful questions: Who needs the service? Who is missing from the published data? Is there another way to achieve the intended purpose? Are there relevant differences between users? Would the proposed remedy introduce a new barrier? How could a later reviewer know it worked? None of these questions requires asking a child to disclose private family circumstances, medical information, housing insecurity, legal disputes, employment status or exposure to real hazards. Use fictional characters with neutral descriptions and keep their personal identities entirely invented.
From diagnosis to a credible remedy
Keep students away from real floodwater or drains. Begin by preserving things that already work and by recognising who has legitimate authority to act. Next, specify one practical improvement, the people affected, the resources it would require and what observation could verify progress. Do not confuse spending with results. An allocated budget is not a repaired road, a published service plan is not proof of access, and an attractive photograph is not evidence of a functioning institution. A defensible response includes trained people, maintenance, privacy and a way to revisit an error.
The correction cycle has four checkpoints. Observe: describe the issue precisely and record its time and scope. Check: use authoritative evidence and challenge the first hypothesis. Improve: choose a proportionate action within appropriate professional responsibility. Review: test whether the person or service is genuinely better off, including users with different access needs. If the later evidence contradicts an earlier conclusion, document the change rather than hiding it. The purpose of accountability is to help people continue living and learning, not to stage blame as a spectacle.
Imagine that the repair succeeded for the easiest cases but not for someone who needs an alternative format. These counterexamples show why good systems need follow-up, clear responsibilities and honesty about limits. They also reveal why a civilisation’s resilience is not simply the number of impressive buildings or digital tools it possesses. People need reliable capability and fair ways to identify problems and improve them.
Worked mathematics: an invented example with correct units
Use 48 coloured paper cards in an invented town square. Suppose 5 cards are flagged as requests requiring an additional check. The flagged proportion is 5 ÷ 48 × 100 = 10.4% when rounded to one decimal place. If the fictional clerk verifies that 4 flagged cards have been dealt with appropriately, 1 flagged cards remain open. All quantities are invented for teaching percentages. These cards are not real people, medical cases, court outcomes, hazardous events, risk probabilities or measurements of an actual place.
Now test whether this number tells the full story. Perhaps 48 represents only submitted requests, not everyone who needed help. Perhaps a change in reporting produces more flagged cards even while service quality improves. Perhaps the clerk recorded a closed case without checking whether the intended user was actually helped. A count, a resolution fraction, a waiting time and a meaningful outcome answer different questions. Ask learners to write the unit, denominator, observation date and the main limitation beside every number. They should resist the temptation to turn a neat calculation into a claim about an entire civilisation.
A safe, original activity for parents and tutors
Calculate invented rainfall totals with correct units. Use four paper sheets headed “observation”, “evidence”, “alternative explanation” and “follow-up”. The first student explains what is seen in the invented scenario; the second checks what would support the claim. A third seeks someone whose needs were not considered, and a fourth decides what later record could show improvement. The tutor corrects unwarranted certainty and invites pupils to revise their reasoning. This is a non-operational paper exercise, not a professional inspection, public-safety drill, legal opinion, clinical assessment or advice about real environmental conditions.
For young learners, work with one chapter and only three coloured cards. For upper-primary children, ask for a second possible explanation. For secondary pupils, add the percentage calculation and source validity checks. For advanced learners, introduce a system diagram with several dependencies, an explicit counterexample and a comparison across two periods. In every version, assess whether the student can explain in their own words what would make the intervention fair and what evidence is still missing. The ideal outcome is independent judgement and humane problem-solving, not perfect agreement or a dramatic prediction.
Test the explanation without looking back
- Define: Rainfall and flooding are related through drainage, topography and infrastructure.
- Trace: An online rain reading does not prove a specific street or path is safe.
- Check: Verify official alerts and the date of observation.
- Correct: Keep students away from real floodwater or drains.
- Practise: Calculate invented rainfall totals with correct units.
- Limit: Explain why the imaginary Signalport model cannot establish the fate of a real society.
Finish with a handover statement that can be understood by the next learner: “The issue I investigated is … . The first claim is … . My source would be … . One competing explanation is … . I would make the process fairer by … . I would know the remedy worked when … . An important remaining uncertainty is … .” A child who can produce such a statement is learning the habit that civilisations themselves require: keeping knowledge usable, correcting errors, protecting people and handing functioning systems to those who come next.
22. Regional storms and different local guidance
The clear explanation. Weather hazards vary by geography and official agency practice. This chapter looks at a concrete piece of early warning, responsible risk communication and preparedness rather than declaring that one problem necessarily ends an entire society. A civilisation is a network of people, accumulated skill, services, relationships and changing institutions. A local weakness deserves investigation even when the wider community remains able to function. It may be serious, but a serious event is not the same thing as the disappearance of a population or its culture.
How this part of the system works
Copying a foreign emergency checklist can be inappropriate elsewhere. Imagine how this might appear in Signalport, a fictional community invented for this lesson. On a normal day, residents seldom think about every person, tool, record or process that makes the service possible. A visitor sees an open door, a printed rule or a functioning piece of equipment; behind it are less visible dependencies. If one element changes, the results depend on buffers, substitutes, qualified people and the surrounding institutions. Some services remain fully available, some continue at reduced capacity, and some need an orderly alternative.
Begin with a service user’s experience, not with a dramatic headline. If people cannot complete an ordinary task, find the first confirmed point of difficulty. It may involve staff availability, instructions, a supply, an inaccessible route or a missing authorisation. A mistaken conclusion about cause can lead to the wrong remedy. Record the problem in observable terms and leave room for a competing explanation. For example, a service may have moved to a safer location while an old notice remained on display; that is an information failure, not necessarily a complete loss of capability.
To make the system visible, place five cards on the table in this order: input, trained people, agreed procedure, accessible service, and result for the user. Draw arrows only where a real logical dependency exists in the imagined setting. Then turn one card over and predict which results could change. Another group asks whether the effect must follow or is simply possible. A strong model leaves some arrows uncertain. It also includes a backup card representing alternatives or maintenance, because complex societies often have ways to keep going while one part is being repaired.
What an evidence-led investigation asks
Specify country, agency, hazard and date. There is a big difference between observing an outcome and proving its cause. Start with source identity, observation date, location, definition, unit and relevant population. If numbers are reported, keep the denominator and distinguish a total stock from a yearly flow. A forecast describes assumptions and possible future outcomes, while a reported event describes a stated observation. An official policy tells us what is intended or required, but not necessarily whether every person received the promised result. This distinction protects pupils from repeating claims that sound certain but rest on incomplete information.
Consider three possible explanations: the service genuinely became weaker; the service remained similar but the way it was measured or reported changed; or the activity was reorganised and continues through another route. These explanations cannot always all be true. What record would discriminate among them? The responsible researcher asks for an appropriate comparison point instead of choosing the most exciting explanation. If the answer cannot be verified, write “not yet established” and name the evidence that would help. In history, geography and current public information, that is an intellectually valuable answer.
Source quality also depends on relevance. A global report can establish important context for early warning, responsible risk communication and preparedness without measuring every local neighbourhood. A photograph can show appearance without demonstrating policy effectiveness or causality. A student’s paper model can reveal a logical possibility but supplies no real data. A published figure may describe one year even when the page containing it was updated in a later year. Keep those dates separate. If a claim has practical safety or legal consequences, refer to current competent authorities and specialists rather than applying a classroom inference to real life.
Different people see different things
Think about an older resident travelling to a service. Their experience may expose a barrier that an aggregate service count does not show. Meanwhile, another resident may continue receiving the service without difficulty, and a professional may know of a safe workaround that is not publicly visible. A fair explanation asks how these perspectives can be checked and connected without deciding in advance that one person’s experience speaks for everyone. Inaccessible forms, confusing notices or poor coordination matter because public institutions exist to serve real people rather than only to produce good-looking dashboards.
A tutor can ask six respectful questions: Who needs the service? Who is missing from the published data? Is there another way to achieve the intended purpose? Are there relevant differences between users? Would the proposed remedy introduce a new barrier? How could a later reviewer know it worked? None of these questions requires asking a child to disclose private family circumstances, medical information, housing insecurity, legal disputes, employment status or exposure to real hazards. Use fictional characters with neutral descriptions and keep their personal identities entirely invented.
From diagnosis to a credible remedy
Use the locally authorised information rather than generic online advice. Begin by preserving things that already work and by recognising who has legitimate authority to act. Next, specify one practical improvement, the people affected, the resources it would require and what observation could verify progress. Do not confuse spending with results. An allocated budget is not a repaired road, a published service plan is not proof of access, and an attractive photograph is not evidence of a functioning institution. A defensible response includes trained people, maintenance, privacy and a way to revisit an error.
The correction cycle has four checkpoints. Observe: describe the issue precisely and record its time and scope. Check: use authoritative evidence and challenge the first hypothesis. Improve: choose a proportionate action within appropriate professional responsibility. Review: test whether the person or service is genuinely better off, including users with different access needs. If the later evidence contradicts an earlier conclusion, document the change rather than hiding it. The purpose of accountability is to help people continue living and learning, not to stage blame as a spectacle.
Suppose the fictional service now reports a faster average but a few users wait much longer than before. These counterexamples show why good systems need follow-up, clear responsibilities and honesty about limits. They also reveal why a civilisation’s resilience is not simply the number of impressive buildings or digital tools it possesses. People need reliable capability and fair ways to identify problems and improve them.
Worked mathematics: an invented example with correct units
Use 55 coloured paper cards in a classroom model street. Suppose 8 cards are flagged as requests requiring an additional check. The flagged proportion is 8 ÷ 55 × 100 = 14.5% when rounded to one decimal place. If the fictional clerk verifies that 6 flagged cards have been dealt with appropriately, 2 flagged cards remain open. All quantities are invented for teaching percentages. These cards are not real people, medical cases, court outcomes, hazardous events, risk probabilities or measurements of an actual place.
Now test whether this number tells the full story. Perhaps 55 represents only submitted requests, not everyone who needed help. Perhaps a change in reporting produces more flagged cards even while service quality improves. Perhaps the clerk recorded a closed case without checking whether the intended user was actually helped. A count, a resolution fraction, a waiting time and a meaningful outcome answer different questions. Ask learners to write the unit, denominator, observation date and the main limitation beside every number. They should resist the temptation to turn a neat calculation into a claim about an entire civilisation.
A safe, original activity for parents and tutors
Compare two fictional regional notices. Use four paper sheets headed “observation”, “evidence”, “alternative explanation” and “follow-up”. The first student explains what is seen in the invented scenario; the second checks what would support the claim. A third seeks someone whose needs were not considered, and a fourth decides what later record could show improvement. The tutor corrects unwarranted certainty and invites pupils to revise their reasoning. This is a non-operational paper exercise, not a professional inspection, public-safety drill, legal opinion, clinical assessment or advice about real environmental conditions.
For young learners, work with one chapter and only three coloured cards. For upper-primary children, ask for a second possible explanation. For secondary pupils, add the percentage calculation and source validity checks. For advanced learners, introduce a system diagram with several dependencies, an explicit counterexample and a comparison across two periods. In every version, assess whether the student can explain in their own words what would make the intervention fair and what evidence is still missing. The ideal outcome is independent judgement and humane problem-solving, not perfect agreement or a dramatic prediction.
Test the explanation without looking back
- Define: Weather hazards vary by geography and official agency practice.
- Trace: Copying a foreign emergency checklist can be inappropriate elsewhere.
- Check: Specify country, agency, hazard and date.
- Correct: Use the locally authorised information rather than generic online advice.
- Practise: Compare two fictional regional notices.
- Limit: Explain why the imaginary Signalport model cannot establish the fate of a real society.
Finish with a handover statement that can be understood by the next learner: “The issue I investigated is … . The first claim is … . My source would be … . One competing explanation is … . I would make the process fairer by … . I would know the remedy worked when … . An important remaining uncertainty is … .” A child who can produce such a statement is learning the habit that civilisations themselves require: keeping knowledge usable, correcting errors, protecting people and handing functioning systems to those who come next.
23. Haze, smoke and public information
The clear explanation. Environmental guidance depends on current official monitoring and appropriate health advice. This chapter looks at a concrete piece of early warning, responsible risk communication and preparedness rather than declaring that one problem necessarily ends an entire society. A civilisation is a network of people, accumulated skill, services, relationships and changing institutions. A local weakness deserves investigation even when the wider community remains able to function. It may be serious, but a serious event is not the same thing as the disappearance of a population or its culture.
How this part of the system works
Reposted old conditions can mislead people about today’s exposure. Imagine how this might appear in Signalport, a fictional community invented for this lesson. On a normal day, residents seldom think about every person, tool, record or process that makes the service possible. A visitor sees an open door, a printed rule or a functioning piece of equipment; behind it are less visible dependencies. If one element changes, the results depend on buffers, substitutes, qualified people and the surrounding institutions. Some services remain fully available, some continue at reduced capacity, and some need an orderly alternative.
The most revealing question is often what people can still do. If people cannot complete an ordinary task, find the first confirmed point of difficulty. It may involve staff availability, instructions, a supply, an inaccessible route or a missing authorisation. A mistaken conclusion about cause can lead to the wrong remedy. Record the problem in observable terms and leave room for a competing explanation. For example, a service may have moved to a safer location while an old notice remained on display; that is an information failure, not necessarily a complete loss of capability.
To make the system visible, place five cards on the table in this order: input, trained people, agreed procedure, accessible service, and result for the user. Draw arrows only where a real logical dependency exists in the imagined setting. Then turn one card over and predict which results could change. Another group asks whether the effect must follow or is simply possible. A strong model leaves some arrows uncertain. It also includes a backup card representing alternatives or maintenance, because complex societies often have ways to keep going while one part is being repaired.
What an evidence-led investigation asks
Preserve issue date, averaging time and source. There is a big difference between observing an outcome and proving its cause. Start with source identity, observation date, location, definition, unit and relevant population. If numbers are reported, keep the denominator and distinguish a total stock from a yearly flow. A forecast describes assumptions and possible future outcomes, while a reported event describes a stated observation. An official policy tells us what is intended or required, but not necessarily whether every person received the promised result. This distinction protects pupils from repeating claims that sound certain but rest on incomplete information.
Consider three possible explanations: the service genuinely became weaker; the service remained similar but the way it was measured or reported changed; or the activity was reorganised and continues through another route. These explanations cannot always all be true. What record would discriminate among them? The responsible researcher asks for an appropriate comparison point instead of choosing the most exciting explanation. If the answer cannot be verified, write “not yet established” and name the evidence that would help. In history, geography and current public information, that is an intellectually valuable answer.
Source quality also depends on relevance. A global report can establish important context for early warning, responsible risk communication and preparedness without measuring every local neighbourhood. A photograph can show appearance without demonstrating policy effectiveness or causality. A student’s paper model can reveal a logical possibility but supplies no real data. A published figure may describe one year even when the page containing it was updated in a later year. Keep those dates separate. If a claim has practical safety or legal consequences, refer to current competent authorities and specialists rather than applying a classroom inference to real life.
Different people see different things
Think about a newcomer seeking clear information. Their experience may expose a barrier that an aggregate service count does not show. Meanwhile, another resident may continue receiving the service without difficulty, and a professional may know of a safe workaround that is not publicly visible. A fair explanation asks how these perspectives can be checked and connected without deciding in advance that one person’s experience speaks for everyone. Inaccessible forms, confusing notices or poor coordination matter because public institutions exist to serve real people rather than only to produce good-looking dashboards.
A tutor can ask six respectful questions: Who needs the service? Who is missing from the published data? Is there another way to achieve the intended purpose? Are there relevant differences between users? Would the proposed remedy introduce a new barrier? How could a later reviewer know it worked? None of these questions requires asking a child to disclose private family circumstances, medical information, housing insecurity, legal disputes, employment status or exposure to real hazards. Use fictional characters with neutral descriptions and keep their personal identities entirely invented.
From diagnosis to a credible remedy
Avoid diagnosis or speculative exposure thresholds. Begin by preserving things that already work and by recognising who has legitimate authority to act. Next, specify one practical improvement, the people affected, the resources it would require and what observation could verify progress. Do not confuse spending with results. An allocated budget is not a repaired road, a published service plan is not proof of access, and an attractive photograph is not evidence of a functioning institution. A defensible response includes trained people, maintenance, privacy and a way to revisit an error.
The correction cycle has four checkpoints. Observe: describe the issue precisely and record its time and scope. Check: use authoritative evidence and challenge the first hypothesis. Improve: choose a proportionate action within appropriate professional responsibility. Review: test whether the person or service is genuinely better off, including users with different access needs. If the later evidence contradicts an earlier conclusion, document the change rather than hiding it. The purpose of accountability is to help people continue living and learning, not to stage blame as a spectacle.
What if a cheaper short-term fix prevents the next group from maintaining the improvement? These counterexamples show why good systems need follow-up, clear responsibilities and honesty about limits. They also reveal why a civilisation’s resilience is not simply the number of impressive buildings or digital tools it possesses. People need reliable capability and fair ways to identify problems and improve them.
Worked mathematics: an invented example with correct units
Use 62 coloured paper cards in a mock community timetable. Suppose 11 cards are flagged as requests requiring an additional check. The flagged proportion is 11 ÷ 62 × 100 = 17.7% when rounded to one decimal place. If the fictional clerk verifies that 10 flagged cards have been dealt with appropriately, 1 flagged cards remain open. All quantities are invented for teaching percentages. These cards are not real people, medical cases, court outcomes, hazardous events, risk probabilities or measurements of an actual place.
Now test whether this number tells the full story. Perhaps 62 represents only submitted requests, not everyone who needed help. Perhaps a change in reporting produces more flagged cards even while service quality improves. Perhaps the clerk recorded a closed case without checking whether the intended user was actually helped. A count, a resolution fraction, a waiting time and a meaningful outcome answer different questions. Ask learners to write the unit, denominator, observation date and the main limitation beside every number. They should resist the temptation to turn a neat calculation into a claim about an entire civilisation.
A safe, original activity for parents and tutors
Inspect two imaginary dated air-quality notices. Use four paper sheets headed “observation”, “evidence”, “alternative explanation” and “follow-up”. The first student explains what is seen in the invented scenario; the second checks what would support the claim. A third seeks someone whose needs were not considered, and a fourth decides what later record could show improvement. The tutor corrects unwarranted certainty and invites pupils to revise their reasoning. This is a non-operational paper exercise, not a professional inspection, public-safety drill, legal opinion, clinical assessment or advice about real environmental conditions.
For young learners, work with one chapter and only three coloured cards. For upper-primary children, ask for a second possible explanation. For secondary pupils, add the percentage calculation and source validity checks. For advanced learners, introduce a system diagram with several dependencies, an explicit counterexample and a comparison across two periods. In every version, assess whether the student can explain in their own words what would make the intervention fair and what evidence is still missing. The ideal outcome is independent judgement and humane problem-solving, not perfect agreement or a dramatic prediction.
Test the explanation without looking back
- Define: Environmental guidance depends on current official monitoring and appropriate health advice.
- Trace: Reposted old conditions can mislead people about today’s exposure.
- Check: Preserve issue date, averaging time and source.
- Correct: Avoid diagnosis or speculative exposure thresholds.
- Practise: Inspect two imaginary dated air-quality notices.
- Limit: Explain why the imaginary Signalport model cannot establish the fate of a real society.
Finish with a handover statement that can be understood by the next learner: “The issue I investigated is … . The first claim is … . My source would be … . One competing explanation is … . I would make the process fairer by … . I would know the remedy worked when … . An important remaining uncertainty is … .” A child who can produce such a statement is learning the habit that civilisations themselves require: keeping knowledge usable, correcting errors, protecting people and handing functioning systems to those who come next.
24. Drought and drinking-water systems
The clear explanation. Water-service continuity depends on monitoring, storage, demand and distribution as well as rainfall. This chapter looks at a concrete piece of early warning, responsible risk communication and preparedness rather than declaring that one problem necessarily ends an entire society. A civilisation is a network of people, accumulated skill, services, relationships and changing institutions. A local weakness deserves investigation even when the wider community remains able to function. It may be serious, but a serious event is not the same thing as the disappearance of a population or its culture.
How this part of the system works
A dry period does not mean every household immediately loses water. Imagine how this might appear in Signalport, a fictional community invented for this lesson. On a normal day, residents seldom think about every person, tool, record or process that makes the service possible. A visitor sees an open door, a printed rule or a functioning piece of equipment; behind it are less visible dependencies. If one element changes, the results depend on buffers, substitutes, qualified people and the surrounding institutions. Some services remain fully available, some continue at reduced capacity, and some need an orderly alternative.
Treat a disruption as a hypothesis about dependencies, not an automatic cascade. If people cannot complete an ordinary task, find the first confirmed point of difficulty. It may involve staff availability, instructions, a supply, an inaccessible route or a missing authorisation. A mistaken conclusion about cause can lead to the wrong remedy. Record the problem in observable terms and leave room for a competing explanation. For example, a service may have moved to a safer location while an old notice remained on display; that is an information failure, not necessarily a complete loss of capability.
To make the system visible, place five cards on the table in this order: input, trained people, agreed procedure, accessible service, and result for the user. Draw arrows only where a real logical dependency exists in the imagined setting. Then turn one card over and predict which results could change. Another group asks whether the effect must follow or is simply possible. A strong model leaves some arrows uncertain. It also includes a backup card representing alternatives or maintenance, because complex societies often have ways to keep going while one part is being repaired.
What an evidence-led investigation asks
Distinguish climate observations from official service notices. There is a big difference between observing an outcome and proving its cause. Start with source identity, observation date, location, definition, unit and relevant population. If numbers are reported, keep the denominator and distinguish a total stock from a yearly flow. A forecast describes assumptions and possible future outcomes, while a reported event describes a stated observation. An official policy tells us what is intended or required, but not necessarily whether every person received the promised result. This distinction protects pupils from repeating claims that sound certain but rest on incomplete information.
Consider three possible explanations: the service genuinely became weaker; the service remained similar but the way it was measured or reported changed; or the activity was reorganised and continues through another route. These explanations cannot always all be true. What record would discriminate among them? The responsible researcher asks for an appropriate comparison point instead of choosing the most exciting explanation. If the answer cannot be verified, write “not yet established” and name the evidence that would help. In history, geography and current public information, that is an intellectually valuable answer.
Source quality also depends on relevance. A global report can establish important context for early warning, responsible risk communication and preparedness without measuring every local neighbourhood. A photograph can show appearance without demonstrating policy effectiveness or causality. A student’s paper model can reveal a logical possibility but supplies no real data. A published figure may describe one year even when the page containing it was updated in a later year. Keep those dates separate. If a claim has practical safety or legal consequences, refer to current competent authorities and specialists rather than applying a classroom inference to real life.
Different people see different things
Think about a person needing an accessible format. Their experience may expose a barrier that an aggregate service count does not show. Meanwhile, another resident may continue receiving the service without difficulty, and a professional may know of a safe workaround that is not publicly visible. A fair explanation asks how these perspectives can be checked and connected without deciding in advance that one person’s experience speaks for everyone. Inaccessible forms, confusing notices or poor coordination matter because public institutions exist to serve real people rather than only to produce good-looking dashboards.
A tutor can ask six respectful questions: Who needs the service? Who is missing from the published data? Is there another way to achieve the intended purpose? Are there relevant differences between users? Would the proposed remedy introduce a new barrier? How could a later reviewer know it worked? None of these questions requires asking a child to disclose private family circumstances, medical information, housing insecurity, legal disputes, employment status or exposure to real hazards. Use fictional characters with neutral descriptions and keep their personal identities entirely invented.
From diagnosis to a credible remedy
Study institutional stewardship without risky water experiments. Begin by preserving things that already work and by recognising who has legitimate authority to act. Next, specify one practical improvement, the people affected, the resources it would require and what observation could verify progress. Do not confuse spending with results. An allocated budget is not a repaired road, a published service plan is not proof of access, and an attractive photograph is not evidence of a functioning institution. A defensible response includes trained people, maintenance, privacy and a way to revisit an error.
The correction cycle has four checkpoints. Observe: describe the issue precisely and record its time and scope. Check: use authoritative evidence and challenge the first hypothesis. Improve: choose a proportionate action within appropriate professional responsibility. Review: test whether the person or service is genuinely better off, including users with different access needs. If the later evidence contradicts an earlier conclusion, document the change rather than hiding it. The purpose of accountability is to help people continue living and learning, not to stage blame as a spectacle.
What happens when the person who designed the process is absent and no usable handover exists? These counterexamples show why good systems need follow-up, clear responsibilities and honesty about limits. They also reveal why a civilisation’s resilience is not simply the number of impressive buildings or digital tools it possesses. People need reliable capability and fair ways to identify problems and improve them.
Worked mathematics: an invented example with correct units
Use 69 coloured paper cards in an imaginary town archive. Suppose 14 cards are flagged as requests requiring an additional check. The flagged proportion is 14 ÷ 69 × 100 = 20.3% when rounded to one decimal place. If the fictional clerk verifies that 5 flagged cards have been dealt with appropriately, 9 flagged cards remain open. All quantities are invented for teaching percentages. These cards are not real people, medical cases, court outcomes, hazardous events, risk probabilities or measurements of an actual place.
Now test whether this number tells the full story. Perhaps 69 represents only submitted requests, not everyone who needed help. Perhaps a change in reporting produces more flagged cards even while service quality improves. Perhaps the clerk recorded a closed case without checking whether the intended user was actually helped. A count, a resolution fraction, a waiting time and a meaningful outcome answer different questions. Ask learners to write the unit, denominator, observation date and the main limitation beside every number. They should resist the temptation to turn a neat calculation into a claim about an entire civilisation.
A safe, original activity for parents and tutors
Allocate fictional water tokens with a declared assumption. Use four paper sheets headed “observation”, “evidence”, “alternative explanation” and “follow-up”. The first student explains what is seen in the invented scenario; the second checks what would support the claim. A third seeks someone whose needs were not considered, and a fourth decides what later record could show improvement. The tutor corrects unwarranted certainty and invites pupils to revise their reasoning. This is a non-operational paper exercise, not a professional inspection, public-safety drill, legal opinion, clinical assessment or advice about real environmental conditions.
For young learners, work with one chapter and only three coloured cards. For upper-primary children, ask for a second possible explanation. For secondary pupils, add the percentage calculation and source validity checks. For advanced learners, introduce a system diagram with several dependencies, an explicit counterexample and a comparison across two periods. In every version, assess whether the student can explain in their own words what would make the intervention fair and what evidence is still missing. The ideal outcome is independent judgement and humane problem-solving, not perfect agreement or a dramatic prediction.
Test the explanation without looking back
- Define: Water-service continuity depends on monitoring, storage, demand and distribution as well as rainfall.
- Trace: A dry period does not mean every household immediately loses water.
- Check: Distinguish climate observations from official service notices.
- Correct: Study institutional stewardship without risky water experiments.
- Practise: Allocate fictional water tokens with a declared assumption.
- Limit: Explain why the imaginary Signalport model cannot establish the fate of a real society.
Finish with a handover statement that can be understood by the next learner: “The issue I investigated is … . The first claim is … . My source would be … . One competing explanation is … . I would make the process fairer by … . I would know the remedy worked when … . An important remaining uncertainty is … .” A child who can produce such a statement is learning the habit that civilisations themselves require: keeping knowledge usable, correcting errors, protecting people and handing functioning systems to those who come next.
25. Compound hazards and hidden interdependencies
The clear explanation. Several problems can interact through transport, energy, staffing and public information. This chapter looks at a concrete piece of early warning, responsible risk communication and preparedness rather than declaring that one problem necessarily ends an entire society. A civilisation is a network of people, accumulated skill, services, relationships and changing institutions. A local weakness deserves investigation even when the wider community remains able to function. It may be serious, but a serious event is not the same thing as the disappearance of a population or its culture.
How this part of the system works
Simple diagrams may overpredict a total cascade because they ignore buffers. Imagine how this might appear in Signalport, a fictional community invented for this lesson. On a normal day, residents seldom think about every person, tool, record or process that makes the service possible. A visitor sees an open door, a printed rule or a functioning piece of equipment; behind it are less visible dependencies. If one element changes, the results depend on buffers, substitutes, qualified people and the surrounding institutions. Some services remain fully available, some continue at reduced capacity, and some need an orderly alternative.
Consider how an official-looking notice can differ from the real service experience. If people cannot complete an ordinary task, find the first confirmed point of difficulty. It may involve staff availability, instructions, a supply, an inaccessible route or a missing authorisation. A mistaken conclusion about cause can lead to the wrong remedy. Record the problem in observable terms and leave room for a competing explanation. For example, a service may have moved to a safer location while an old notice remained on display; that is an information failure, not necessarily a complete loss of capability.
To make the system visible, place five cards on the table in this order: input, trained people, agreed procedure, accessible service, and result for the user. Draw arrows only where a real logical dependency exists in the imagined setting. Then turn one card over and predict which results could change. Another group asks whether the effect must follow or is simply possible. A strong model leaves some arrows uncertain. It also includes a backup card representing alternatives or maintenance, because complex societies often have ways to keep going while one part is being repaired.
What an evidence-led investigation asks
Identify observed links and alternatives rather than guessing every failure. There is a big difference between observing an outcome and proving its cause. Start with source identity, observation date, location, definition, unit and relevant population. If numbers are reported, keep the denominator and distinguish a total stock from a yearly flow. A forecast describes assumptions and possible future outcomes, while a reported event describes a stated observation. An official policy tells us what is intended or required, but not necessarily whether every person received the promised result. This distinction protects pupils from repeating claims that sound certain but rest on incomplete information.
Consider three possible explanations: the service genuinely became weaker; the service remained similar but the way it was measured or reported changed; or the activity was reorganised and continues through another route. These explanations cannot always all be true. What record would discriminate among them? The responsible researcher asks for an appropriate comparison point instead of choosing the most exciting explanation. If the answer cannot be verified, write “not yet established” and name the evidence that would help. In history, geography and current public information, that is an intellectually valuable answer.
Source quality also depends on relevance. A global report can establish important context for early warning, responsible risk communication and preparedness without measuring every local neighbourhood. A photograph can show appearance without demonstrating policy effectiveness or causality. A student’s paper model can reveal a logical possibility but supplies no real data. A published figure may describe one year even when the page containing it was updated in a later year. Keep those dates separate. If a claim has practical safety or legal consequences, refer to current competent authorities and specialists rather than applying a classroom inference to real life.
Different people see different things
Think about a parent with a limited schedule. Their experience may expose a barrier that an aggregate service count does not show. Meanwhile, another resident may continue receiving the service without difficulty, and a professional may know of a safe workaround that is not publicly visible. A fair explanation asks how these perspectives can be checked and connected without deciding in advance that one person’s experience speaks for everyone. Inaccessible forms, confusing notices or poor coordination matter because public institutions exist to serve real people rather than only to produce good-looking dashboards.
A tutor can ask six respectful questions: Who needs the service? Who is missing from the published data? Is there another way to achieve the intended purpose? Are there relevant differences between users? Would the proposed remedy introduce a new barrier? How could a later reviewer know it worked? None of these questions requires asking a child to disclose private family circumstances, medical information, housing insecurity, legal disputes, employment status or exposure to real hazards. Use fictional characters with neutral descriptions and keep their personal identities entirely invented.
From diagnosis to a credible remedy
Develop resilient coordinated systems with actual evidence. Begin by preserving things that already work and by recognising who has legitimate authority to act. Next, specify one practical improvement, the people affected, the resources it would require and what observation could verify progress. Do not confuse spending with results. An allocated budget is not a repaired road, a published service plan is not proof of access, and an attractive photograph is not evidence of a functioning institution. A defensible response includes trained people, maintenance, privacy and a way to revisit an error.
The correction cycle has four checkpoints. Observe: describe the issue precisely and record its time and scope. Check: use authoritative evidence and challenge the first hypothesis. Improve: choose a proportionate action within appropriate professional responsibility. Review: test whether the person or service is genuinely better off, including users with different access needs. If the later evidence contradicts an earlier conclusion, document the change rather than hiding it. The purpose of accountability is to help people continue living and learning, not to stage blame as a spectacle.
Imagine that the first explanation was wrong but the institution has already announced a solution. These counterexamples show why good systems need follow-up, clear responsibilities and honesty about limits. They also reveal why a civilisation’s resilience is not simply the number of impressive buildings or digital tools it possesses. People need reliable capability and fair ways to identify problems and improve them.
Worked mathematics: an invented example with correct units
Use 76 coloured paper cards in a quiet paper library. Suppose 17 cards are flagged as requests requiring an additional check. The flagged proportion is 17 ÷ 76 × 100 = 22.4% when rounded to one decimal place. If the fictional clerk verifies that 9 flagged cards have been dealt with appropriately, 8 flagged cards remain open. All quantities are invented for teaching percentages. These cards are not real people, medical cases, court outcomes, hazardous events, risk probabilities or measurements of an actual place.
Now test whether this number tells the full story. Perhaps 76 represents only submitted requests, not everyone who needed help. Perhaps a change in reporting produces more flagged cards even while service quality improves. Perhaps the clerk recorded a closed case without checking whether the intended user was actually helped. A count, a resolution fraction, a waiting time and a meaningful outcome answer different questions. Ask learners to write the unit, denominator, observation date and the main limitation beside every number. They should resist the temptation to turn a neat calculation into a claim about an entire civilisation.
A safe, original activity for parents and tutors
Remove one paper dependency and identify what continues. Use four paper sheets headed “observation”, “evidence”, “alternative explanation” and “follow-up”. The first student explains what is seen in the invented scenario; the second checks what would support the claim. A third seeks someone whose needs were not considered, and a fourth decides what later record could show improvement. The tutor corrects unwarranted certainty and invites pupils to revise their reasoning. This is a non-operational paper exercise, not a professional inspection, public-safety drill, legal opinion, clinical assessment or advice about real environmental conditions.
For young learners, work with one chapter and only three coloured cards. For upper-primary children, ask for a second possible explanation. For secondary pupils, add the percentage calculation and source validity checks. For advanced learners, introduce a system diagram with several dependencies, an explicit counterexample and a comparison across two periods. In every version, assess whether the student can explain in their own words what would make the intervention fair and what evidence is still missing. The ideal outcome is independent judgement and humane problem-solving, not perfect agreement or a dramatic prediction.
Test the explanation without looking back
- Define: Several problems can interact through transport, energy, staffing and public information.
- Trace: Simple diagrams may overpredict a total cascade because they ignore buffers.
- Check: Identify observed links and alternatives rather than guessing every failure.
- Correct: Develop resilient coordinated systems with actual evidence.
- Practise: Remove one paper dependency and identify what continues.
- Limit: Explain why the imaginary Signalport model cannot establish the fate of a real society.
Finish with a handover statement that can be understood by the next learner: “The issue I investigated is … . The first claim is … . My source would be … . One competing explanation is … . I would make the process fairer by … . I would know the remedy worked when … . An important remaining uncertainty is … .” A child who can produce such a statement is learning the habit that civilisations themselves require: keeping knowledge usable, correcting errors, protecting people and handing functioning systems to those who come next.
26. After-action review and organisational learning
The clear explanation. Reviewing warnings helps institutions improve their evidence, communication and preparedness. This chapter looks at a concrete piece of early warning, responsible risk communication and preparedness rather than declaring that one problem necessarily ends an entire society. A civilisation is a network of people, accumulated skill, services, relationships and changing institutions. A local weakness deserves investigation even when the wider community remains able to function. It may be serious, but a serious event is not the same thing as the disappearance of a population or its culture.
How this part of the system works
Counting notices sent can hide the fact that some users never understood them. Imagine how this might appear in Signalport, a fictional community invented for this lesson. On a normal day, residents seldom think about every person, tool, record or process that makes the service possible. A visitor sees an open door, a printed rule or a functioning piece of equipment; behind it are less visible dependencies. If one element changes, the results depend on buffers, substitutes, qualified people and the surrounding institutions. Some services remain fully available, some continue at reduced capacity, and some need an orderly alternative.
A useful first move is to isolate one variable at a time. If people cannot complete an ordinary task, find the first confirmed point of difficulty. It may involve staff availability, instructions, a supply, an inaccessible route or a missing authorisation. A mistaken conclusion about cause can lead to the wrong remedy. Record the problem in observable terms and leave room for a competing explanation. For example, a service may have moved to a safer location while an old notice remained on display; that is an information failure, not necessarily a complete loss of capability.
To make the system visible, place five cards on the table in this order: input, trained people, agreed procedure, accessible service, and result for the user. Draw arrows only where a real logical dependency exists in the imagined setting. Then turn one card over and predict which results could change. Another group asks whether the effect must follow or is simply possible. A strong model leaves some arrows uncertain. It also includes a backup card representing alternatives or maintenance, because complex societies often have ways to keep going while one part is being repaired.
What an evidence-led investigation asks
Measure reach, comprehension, lead time and verified outcomes separately. There is a big difference between observing an outcome and proving its cause. Start with source identity, observation date, location, definition, unit and relevant population. If numbers are reported, keep the denominator and distinguish a total stock from a yearly flow. A forecast describes assumptions and possible future outcomes, while a reported event describes a stated observation. An official policy tells us what is intended or required, but not necessarily whether every person received the promised result. This distinction protects pupils from repeating claims that sound certain but rest on incomplete information.
Consider three possible explanations: the service genuinely became weaker; the service remained similar but the way it was measured or reported changed; or the activity was reorganised and continues through another route. These explanations cannot always all be true. What record would discriminate among them? The responsible researcher asks for an appropriate comparison point instead of choosing the most exciting explanation. If the answer cannot be verified, write “not yet established” and name the evidence that would help. In history, geography and current public information, that is an intellectually valuable answer.
Source quality also depends on relevance. A global report can establish important context for early warning, responsible risk communication and preparedness without measuring every local neighbourhood. A photograph can show appearance without demonstrating policy effectiveness or causality. A student’s paper model can reveal a logical possibility but supplies no real data. A published figure may describe one year even when the page containing it was updated in a later year. Keep those dates separate. If a claim has practical safety or legal consequences, refer to current competent authorities and specialists rather than applying a classroom inference to real life.
Different people see different things
Think about a student using a school service. Their experience may expose a barrier that an aggregate service count does not show. Meanwhile, another resident may continue receiving the service without difficulty, and a professional may know of a safe workaround that is not publicly visible. A fair explanation asks how these perspectives can be checked and connected without deciding in advance that one person’s experience speaks for everyone. Inaccessible forms, confusing notices or poor coordination matter because public institutions exist to serve real people rather than only to produce good-looking dashboards.
A tutor can ask six respectful questions: Who needs the service? Who is missing from the published data? Is there another way to achieve the intended purpose? Are there relevant differences between users? Would the proposed remedy introduce a new barrier? How could a later reviewer know it worked? None of these questions requires asking a child to disclose private family circumstances, medical information, housing insecurity, legal disputes, employment status or exposure to real hazards. Use fictional characters with neutral descriptions and keep their personal identities entirely invented.
From diagnosis to a credible remedy
Build respectful correction processes with affected communities. Begin by preserving things that already work and by recognising who has legitimate authority to act. Next, specify one practical improvement, the people affected, the resources it would require and what observation could verify progress. Do not confuse spending with results. An allocated budget is not a repaired road, a published service plan is not proof of access, and an attractive photograph is not evidence of a functioning institution. A defensible response includes trained people, maintenance, privacy and a way to revisit an error.
The correction cycle has four checkpoints. Observe: describe the issue precisely and record its time and scope. Check: use authoritative evidence and challenge the first hypothesis. Improve: choose a proportionate action within appropriate professional responsibility. Review: test whether the person or service is genuinely better off, including users with different access needs. If the later evidence contradicts an earlier conclusion, document the change rather than hiding it. The purpose of accountability is to help people continue living and learning, not to stage blame as a spectacle.
Imagine that the repair succeeded for the easiest cases but not for someone who needs an alternative format. These counterexamples show why good systems need follow-up, clear responsibilities and honesty about limits. They also reveal why a civilisation’s resilience is not simply the number of impressive buildings or digital tools it possesses. People need reliable capability and fair ways to identify problems and improve them.
Worked mathematics: an invented example with correct units
Use 48 coloured paper cards in a fictional service desk. Suppose 5 cards are flagged as requests requiring an additional check. The flagged proportion is 5 ÷ 48 × 100 = 10.4% when rounded to one decimal place. If the fictional clerk verifies that 4 flagged cards have been dealt with appropriately, 1 flagged cards remain open. All quantities are invented for teaching percentages. These cards are not real people, medical cases, court outcomes, hazardous events, risk probabilities or measurements of an actual place.
Now test whether this number tells the full story. Perhaps 48 represents only submitted requests, not everyone who needed help. Perhaps a change in reporting produces more flagged cards even while service quality improves. Perhaps the clerk recorded a closed case without checking whether the intended user was actually helped. A count, a resolution fraction, a waiting time and a meaningful outcome answer different questions. Ask learners to write the unit, denominator, observation date and the main limitation beside every number. They should resist the temptation to turn a neat calculation into a claim about an entire civilisation.
A safe, original activity for parents and tutors
Audit a pretend school timetable notice and its feedback. Use four paper sheets headed “observation”, “evidence”, “alternative explanation” and “follow-up”. The first student explains what is seen in the invented scenario; the second checks what would support the claim. A third seeks someone whose needs were not considered, and a fourth decides what later record could show improvement. The tutor corrects unwarranted certainty and invites pupils to revise their reasoning. This is a non-operational paper exercise, not a professional inspection, public-safety drill, legal opinion, clinical assessment or advice about real environmental conditions.
For young learners, work with one chapter and only three coloured cards. For upper-primary children, ask for a second possible explanation. For secondary pupils, add the percentage calculation and source validity checks. For advanced learners, introduce a system diagram with several dependencies, an explicit counterexample and a comparison across two periods. In every version, assess whether the student can explain in their own words what would make the intervention fair and what evidence is still missing. The ideal outcome is independent judgement and humane problem-solving, not perfect agreement or a dramatic prediction.
Test the explanation without looking back
- Define: Reviewing warnings helps institutions improve their evidence, communication and preparedness.
- Trace: Counting notices sent can hide the fact that some users never understood them.
- Check: Measure reach, comprehension, lead time and verified outcomes separately.
- Correct: Build respectful correction processes with affected communities.
- Practise: Audit a pretend school timetable notice and its feedback.
- Limit: Explain why the imaginary Signalport model cannot establish the fate of a real society.
Finish with a handover statement that can be understood by the next learner: “The issue I investigated is … . The first claim is … . My source would be … . One competing explanation is … . I would make the process fairer by … . I would know the remedy worked when … . An important remaining uncertainty is … .” A child who can produce such a statement is learning the habit that civilisations themselves require: keeping knowledge usable, correcting errors, protecting people and handing functioning systems to those who come next.
27. What global system counts really mean
The clear explanation. The 2025 WMO and UNDRR report counted countries reporting multi-hazard warning systems. This chapter looks at a concrete piece of early warning, responsible risk communication and preparedness rather than declaring that one problem necessarily ends an entire society. A civilisation is a network of people, accumulated skill, services, relationships and changing institutions. A local weakness deserves investigation even when the wider community remains able to function. It may be serious, but a serious event is not the same thing as the disappearance of a population or its culture.
How this part of the system works
National reporting does not automatically equal complete protection of every person. Imagine how this might appear in Signalport, a fictional community invented for this lesson. On a normal day, residents seldom think about every person, tool, record or process that makes the service possible. A visitor sees an open door, a printed rule or a functioning piece of equipment; behind it are less visible dependencies. If one element changes, the results depend on buffers, substitutes, qualified people and the surrounding institutions. Some services remain fully available, some continue at reduced capacity, and some need an orderly alternative.
Begin with a service user’s experience, not with a dramatic headline. If people cannot complete an ordinary task, find the first confirmed point of difficulty. It may involve staff availability, instructions, a supply, an inaccessible route or a missing authorisation. A mistaken conclusion about cause can lead to the wrong remedy. Record the problem in observable terms and leave room for a competing explanation. For example, a service may have moved to a safer location while an old notice remained on display; that is an information failure, not necessarily a complete loss of capability.
To make the system visible, place five cards on the table in this order: input, trained people, agreed procedure, accessible service, and result for the user. Draw arrows only where a real logical dependency exists in the imagined setting. Then turn one card over and predict which results could change. Another group asks whether the effect must follow or is simply possible. A strong model leaves some arrows uncertain. It also includes a backup card representing alternatives or maintenance, because complex societies often have ways to keep going while one part is being repaired.
What an evidence-led investigation asks
Preserve the year, denominator, reporting definition and limitations. There is a big difference between observing an outcome and proving its cause. Start with source identity, observation date, location, definition, unit and relevant population. If numbers are reported, keep the denominator and distinguish a total stock from a yearly flow. A forecast describes assumptions and possible future outcomes, while a reported event describes a stated observation. An official policy tells us what is intended or required, but not necessarily whether every person received the promised result. This distinction protects pupils from repeating claims that sound certain but rest on incomplete information.
Consider three possible explanations: the service genuinely became weaker; the service remained similar but the way it was measured or reported changed; or the activity was reorganised and continues through another route. These explanations cannot always all be true. What record would discriminate among them? The responsible researcher asks for an appropriate comparison point instead of choosing the most exciting explanation. If the answer cannot be verified, write “not yet established” and name the evidence that would help. In history, geography and current public information, that is an intellectually valuable answer.
Source quality also depends on relevance. A global report can establish important context for early warning, responsible risk communication and preparedness without measuring every local neighbourhood. A photograph can show appearance without demonstrating policy effectiveness or causality. A student’s paper model can reveal a logical possibility but supplies no real data. A published figure may describe one year even when the page containing it was updated in a later year. Keep those dates separate. If a claim has practical safety or legal consequences, refer to current competent authorities and specialists rather than applying a classroom inference to real life.
Different people see different things
Think about a trained worker reviewing a record. Their experience may expose a barrier that an aggregate service count does not show. Meanwhile, another resident may continue receiving the service without difficulty, and a professional may know of a safe workaround that is not publicly visible. A fair explanation asks how these perspectives can be checked and connected without deciding in advance that one person’s experience speaks for everyone. Inaccessible forms, confusing notices or poor coordination matter because public institutions exist to serve real people rather than only to produce good-looking dashboards.
A tutor can ask six respectful questions: Who needs the service? Who is missing from the published data? Is there another way to achieve the intended purpose? Are there relevant differences between users? Would the proposed remedy introduce a new barrier? How could a later reviewer know it worked? None of these questions requires asking a child to disclose private family circumstances, medical information, housing insecurity, legal disputes, employment status or exposure to real hazards. Use fictional characters with neutral descriptions and keep their personal identities entirely invented.
From diagnosis to a credible remedy
Measure access and practical readiness in addition to installation. Begin by preserving things that already work and by recognising who has legitimate authority to act. Next, specify one practical improvement, the people affected, the resources it would require and what observation could verify progress. Do not confuse spending with results. An allocated budget is not a repaired road, a published service plan is not proof of access, and an attractive photograph is not evidence of a functioning institution. A defensible response includes trained people, maintenance, privacy and a way to revisit an error.
The correction cycle has four checkpoints. Observe: describe the issue precisely and record its time and scope. Check: use authoritative evidence and challenge the first hypothesis. Improve: choose a proportionate action within appropriate professional responsibility. Review: test whether the person or service is genuinely better off, including users with different access needs. If the later evidence contradicts an earlier conclusion, document the change rather than hiding it. The purpose of accountability is to help people continue living and learning, not to stage blame as a spectacle.
Suppose the fictional service now reports a faster average but a few users wait much longer than before. These counterexamples show why good systems need follow-up, clear responsibilities and honesty about limits. They also reveal why a civilisation’s resilience is not simply the number of impressive buildings or digital tools it possesses. People need reliable capability and fair ways to identify problems and improve them.
Worked mathematics: an invented example with correct units
Use 55 coloured paper cards in an invented town square. Suppose 8 cards are flagged as requests requiring an additional check. The flagged proportion is 8 ÷ 55 × 100 = 14.5% when rounded to one decimal place. If the fictional clerk verifies that 7 flagged cards have been dealt with appropriately, 1 flagged cards remain open. All quantities are invented for teaching percentages. These cards are not real people, medical cases, court outcomes, hazardous events, risk probabilities or measurements of an actual place.
Now test whether this number tells the full story. Perhaps 55 represents only submitted requests, not everyone who needed help. Perhaps a change in reporting produces more flagged cards even while service quality improves. Perhaps the clerk recorded a closed case without checking whether the intended user was actually helped. A count, a resolution fraction, a waiting time and a meaningful outcome answer different questions. Ask learners to write the unit, denominator, observation date and the main limitation beside every number. They should resist the temptation to turn a neat calculation into a claim about an entire civilisation.
A safe, original activity for parents and tutors
Calculate an invented reported-system percentage. Use four paper sheets headed “observation”, “evidence”, “alternative explanation” and “follow-up”. The first student explains what is seen in the invented scenario; the second checks what would support the claim. A third seeks someone whose needs were not considered, and a fourth decides what later record could show improvement. The tutor corrects unwarranted certainty and invites pupils to revise their reasoning. This is a non-operational paper exercise, not a professional inspection, public-safety drill, legal opinion, clinical assessment or advice about real environmental conditions.
For young learners, work with one chapter and only three coloured cards. For upper-primary children, ask for a second possible explanation. For secondary pupils, add the percentage calculation and source validity checks. For advanced learners, introduce a system diagram with several dependencies, an explicit counterexample and a comparison across two periods. In every version, assess whether the student can explain in their own words what would make the intervention fair and what evidence is still missing. The ideal outcome is independent judgement and humane problem-solving, not perfect agreement or a dramatic prediction.
Test the explanation without looking back
- Define: The 2025 WMO and UNDRR report counted countries reporting multi-hazard warning systems.
- Trace: National reporting does not automatically equal complete protection of every person.
- Check: Preserve the year, denominator, reporting definition and limitations.
- Correct: Measure access and practical readiness in addition to installation.
- Practise: Calculate an invented reported-system percentage.
- Limit: Explain why the imaginary Signalport model cannot establish the fate of a real society.
Finish with a handover statement that can be understood by the next learner: “The issue I investigated is … . The first claim is … . My source would be … . One competing explanation is … . I would make the process fairer by … . I would know the remedy worked when … . An important remaining uncertainty is … .” A child who can produce such a statement is learning the habit that civilisations themselves require: keeping knowledge usable, correcting errors, protecting people and handing functioning systems to those who come next.
28. Singapore’s Public Warning System
The clear explanation. The SCDF publishes information on public warning signals and routes to official messages. This chapter looks at a concrete piece of early warning, responsible risk communication and preparedness rather than declaring that one problem necessarily ends an entire society. A civilisation is a network of people, accumulated skill, services, relationships and changing institutions. A local weakness deserves investigation even when the wider community remains able to function. It may be serious, but a serious event is not the same thing as the disappearance of a population or its culture.
How this part of the system works
Outdated details of scheduled soundings may be forwarded as if they apply on every date. Imagine how this might appear in Signalport, a fictional community invented for this lesson. On a normal day, residents seldom think about every person, tool, record or process that makes the service possible. A visitor sees an open door, a printed rule or a functioning piece of equipment; behind it are less visible dependencies. If one element changes, the results depend on buffers, substitutes, qualified people and the surrounding institutions. Some services remain fully available, some continue at reduced capacity, and some need an orderly alternative.
The most revealing question is often what people can still do. If people cannot complete an ordinary task, find the first confirmed point of difficulty. It may involve staff availability, instructions, a supply, an inaccessible route or a missing authorisation. A mistaken conclusion about cause can lead to the wrong remedy. Record the problem in observable terms and leave room for a competing explanation. For example, a service may have moved to a safer location while an old notice remained on display; that is an information failure, not necessarily a complete loss of capability.
To make the system visible, place five cards on the table in this order: input, trained people, agreed procedure, accessible service, and result for the user. Draw arrows only where a real logical dependency exists in the imagined setting. Then turn one card over and predict which results could change. Another group asks whether the effect must follow or is simply possible. A strong model leaves some arrows uncertain. It also includes a backup card representing alternatives or maintenance, because complex societies often have ways to keep going while one part is being repaired.
What an evidence-led investigation asks
Consult the current SCDF source and distinguish exercises from actual alerts. There is a big difference between observing an outcome and proving its cause. Start with source identity, observation date, location, definition, unit and relevant population. If numbers are reported, keep the denominator and distinguish a total stock from a yearly flow. A forecast describes assumptions and possible future outcomes, while a reported event describes a stated observation. An official policy tells us what is intended or required, but not necessarily whether every person received the promised result. This distinction protects pupils from repeating claims that sound certain but rest on incomplete information.
Consider three possible explanations: the service genuinely became weaker; the service remained similar but the way it was measured or reported changed; or the activity was reorganised and continues through another route. These explanations cannot always all be true. What record would discriminate among them? The responsible researcher asks for an appropriate comparison point instead of choosing the most exciting explanation. If the answer cannot be verified, write “not yet established” and name the evidence that would help. In history, geography and current public information, that is an intellectually valuable answer.
Source quality also depends on relevance. A global report can establish important context for early warning, responsible risk communication and preparedness without measuring every local neighbourhood. A photograph can show appearance without demonstrating policy effectiveness or causality. A student’s paper model can reveal a logical possibility but supplies no real data. A published figure may describe one year even when the page containing it was updated in a later year. Keep those dates separate. If a claim has practical safety or legal consequences, refer to current competent authorities and specialists rather than applying a classroom inference to real life.
Different people see different things
Think about an older resident travelling to a service. Their experience may expose a barrier that an aggregate service count does not show. Meanwhile, another resident may continue receiving the service without difficulty, and a professional may know of a safe workaround that is not publicly visible. A fair explanation asks how these perspectives can be checked and connected without deciding in advance that one person’s experience speaks for everyone. Inaccessible forms, confusing notices or poor coordination matter because public institutions exist to serve real people rather than only to produce good-looking dashboards.
A tutor can ask six respectful questions: Who needs the service? Who is missing from the published data? Is there another way to achieve the intended purpose? Are there relevant differences between users? Would the proposed remedy introduce a new barrier? How could a later reviewer know it worked? None of these questions requires asking a child to disclose private family circumstances, medical information, housing insecurity, legal disputes, employment status or exposure to real hazards. Use fictional characters with neutral descriptions and keep their personal identities entirely invented.
From diagnosis to a credible remedy
Do not operate or imitate real sirens or improvise protective instructions. Begin by preserving things that already work and by recognising who has legitimate authority to act. Next, specify one practical improvement, the people affected, the resources it would require and what observation could verify progress. Do not confuse spending with results. An allocated budget is not a repaired road, a published service plan is not proof of access, and an attractive photograph is not evidence of a functioning institution. A defensible response includes trained people, maintenance, privacy and a way to revisit an error.
The correction cycle has four checkpoints. Observe: describe the issue precisely and record its time and scope. Check: use authoritative evidence and challenge the first hypothesis. Improve: choose a proportionate action within appropriate professional responsibility. Review: test whether the person or service is genuinely better off, including users with different access needs. If the later evidence contradicts an earlier conclusion, document the change rather than hiding it. The purpose of accountability is to help people continue living and learning, not to stage blame as a spectacle.
What if a cheaper short-term fix prevents the next group from maintaining the improvement? These counterexamples show why good systems need follow-up, clear responsibilities and honesty about limits. They also reveal why a civilisation’s resilience is not simply the number of impressive buildings or digital tools it possesses. People need reliable capability and fair ways to identify problems and improve them.
Worked mathematics: an invented example with correct units
Use 62 coloured paper cards in a classroom model street. Suppose 11 cards are flagged as requests requiring an additional check. The flagged proportion is 11 ÷ 62 × 100 = 17.7% when rounded to one decimal place. If the fictional clerk verifies that 3 flagged cards have been dealt with appropriately, 8 flagged cards remain open. All quantities are invented for teaching percentages. These cards are not real people, medical cases, court outcomes, hazardous events, risk probabilities or measurements of an actual place.
Now test whether this number tells the full story. Perhaps 62 represents only submitted requests, not everyone who needed help. Perhaps a change in reporting produces more flagged cards even while service quality improves. Perhaps the clerk recorded a closed case without checking whether the intended user was actually helped. A count, a resolution fraction, a waiting time and a meaningful outcome answer different questions. Ask learners to write the unit, denominator, observation date and the main limitation beside every number. They should resist the temptation to turn a neat calculation into a claim about an entire civilisation.
A safe, original activity for parents and tutors
Match a fictional public notice to its official-style source field. Use four paper sheets headed “observation”, “evidence”, “alternative explanation” and “follow-up”. The first student explains what is seen in the invented scenario; the second checks what would support the claim. A third seeks someone whose needs were not considered, and a fourth decides what later record could show improvement. The tutor corrects unwarranted certainty and invites pupils to revise their reasoning. This is a non-operational paper exercise, not a professional inspection, public-safety drill, legal opinion, clinical assessment or advice about real environmental conditions.
For young learners, work with one chapter and only three coloured cards. For upper-primary children, ask for a second possible explanation. For secondary pupils, add the percentage calculation and source validity checks. For advanced learners, introduce a system diagram with several dependencies, an explicit counterexample and a comparison across two periods. In every version, assess whether the student can explain in their own words what would make the intervention fair and what evidence is still missing. The ideal outcome is independent judgement and humane problem-solving, not perfect agreement or a dramatic prediction.
Test the explanation without looking back
- Define: The SCDF publishes information on public warning signals and routes to official messages.
- Trace: Outdated details of scheduled soundings may be forwarded as if they apply on every date.
- Check: Consult the current SCDF source and distinguish exercises from actual alerts.
- Correct: Do not operate or imitate real sirens or improvise protective instructions.
- Practise: Match a fictional public notice to its official-style source field.
- Limit: Explain why the imaginary Signalport model cannot establish the fate of a real society.
Finish with a handover statement that can be understood by the next learner: “The issue I investigated is … . The first claim is … . My source would be … . One competing explanation is … . I would make the process fairer by … . I would know the remedy worked when … . An important remaining uncertainty is … .” A child who can produce such a statement is learning the habit that civilisations themselves require: keeping knowledge usable, correcting errors, protecting people and handing functioning systems to those who come next.
29. Advanced early-warning resilience
The clear explanation. A sophisticated society maintains people-centred warning systems and keeps learning from gaps. This chapter looks at a concrete piece of early warning, responsible risk communication and preparedness rather than declaring that one problem necessarily ends an entire society. A civilisation is a network of people, accumulated skill, services, relationships and changing institutions. A local weakness deserves investigation even when the wider community remains able to function. It may be serious, but a serious event is not the same thing as the disappearance of a population or its culture.
How this part of the system works
High-tech sensors without trust, access and prepared response leave the chain incomplete. Imagine how this might appear in Signalport, a fictional community invented for this lesson. On a normal day, residents seldom think about every person, tool, record or process that makes the service possible. A visitor sees an open door, a printed rule or a functioning piece of equipment; behind it are less visible dependencies. If one element changes, the results depend on buffers, substitutes, qualified people and the surrounding institutions. Some services remain fully available, some continue at reduced capacity, and some need an orderly alternative.
Treat a disruption as a hypothesis about dependencies, not an automatic cascade. If people cannot complete an ordinary task, find the first confirmed point of difficulty. It may involve staff availability, instructions, a supply, an inaccessible route or a missing authorisation. A mistaken conclusion about cause can lead to the wrong remedy. Record the problem in observable terms and leave room for a competing explanation. For example, a service may have moved to a safer location while an old notice remained on display; that is an information failure, not necessarily a complete loss of capability.
To make the system visible, place five cards on the table in this order: input, trained people, agreed procedure, accessible service, and result for the user. Draw arrows only where a real logical dependency exists in the imagined setting. Then turn one card over and predict which results could change. Another group asks whether the effect must follow or is simply possible. A strong model leaves some arrows uncertain. It also includes a backup card representing alternatives or maintenance, because complex societies often have ways to keep going while one part is being repaired.
What an evidence-led investigation asks
Check multiple outcomes and maintain the system over time. There is a big difference between observing an outcome and proving its cause. Start with source identity, observation date, location, definition, unit and relevant population. If numbers are reported, keep the denominator and distinguish a total stock from a yearly flow. A forecast describes assumptions and possible future outcomes, while a reported event describes a stated observation. An official policy tells us what is intended or required, but not necessarily whether every person received the promised result. This distinction protects pupils from repeating claims that sound certain but rest on incomplete information.
Consider three possible explanations: the service genuinely became weaker; the service remained similar but the way it was measured or reported changed; or the activity was reorganised and continues through another route. These explanations cannot always all be true. What record would discriminate among them? The responsible researcher asks for an appropriate comparison point instead of choosing the most exciting explanation. If the answer cannot be verified, write “not yet established” and name the evidence that would help. In history, geography and current public information, that is an intellectually valuable answer.
Source quality also depends on relevance. A global report can establish important context for early warning, responsible risk communication and preparedness without measuring every local neighbourhood. A photograph can show appearance without demonstrating policy effectiveness or causality. A student’s paper model can reveal a logical possibility but supplies no real data. A published figure may describe one year even when the page containing it was updated in a later year. Keep those dates separate. If a claim has practical safety or legal consequences, refer to current competent authorities and specialists rather than applying a classroom inference to real life.
Different people see different things
Think about a newcomer seeking clear information. Their experience may expose a barrier that an aggregate service count does not show. Meanwhile, another resident may continue receiving the service without difficulty, and a professional may know of a safe workaround that is not publicly visible. A fair explanation asks how these perspectives can be checked and connected without deciding in advance that one person’s experience speaks for everyone. Inaccessible forms, confusing notices or poor coordination matter because public institutions exist to serve real people rather than only to produce good-looking dashboards.
A tutor can ask six respectful questions: Who needs the service? Who is missing from the published data? Is there another way to achieve the intended purpose? Are there relevant differences between users? Would the proposed remedy introduce a new barrier? How could a later reviewer know it worked? None of these questions requires asking a child to disclose private family circumstances, medical information, housing insecurity, legal disputes, employment status or exposure to real hazards. Use fictional characters with neutral descriptions and keep their personal identities entirely invented.
From diagnosis to a credible remedy
Invest in inclusive science, coordination and responsible public communication. Begin by preserving things that already work and by recognising who has legitimate authority to act. Next, specify one practical improvement, the people affected, the resources it would require and what observation could verify progress. Do not confuse spending with results. An allocated budget is not a repaired road, a published service plan is not proof of access, and an attractive photograph is not evidence of a functioning institution. A defensible response includes trained people, maintenance, privacy and a way to revisit an error.
The correction cycle has four checkpoints. Observe: describe the issue precisely and record its time and scope. Check: use authoritative evidence and challenge the first hypothesis. Improve: choose a proportionate action within appropriate professional responsibility. Review: test whether the person or service is genuinely better off, including users with different access needs. If the later evidence contradicts an earlier conclusion, document the change rather than hiding it. The purpose of accountability is to help people continue living and learning, not to stage blame as a spectacle.
What happens when the person who designed the process is absent and no usable handover exists? These counterexamples show why good systems need follow-up, clear responsibilities and honesty about limits. They also reveal why a civilisation’s resilience is not simply the number of impressive buildings or digital tools it possesses. People need reliable capability and fair ways to identify problems and improve them.
Worked mathematics: an invented example with correct units
Use 69 coloured paper cards in a mock community timetable. Suppose 14 cards are flagged as requests requiring an additional check. The flagged proportion is 14 ÷ 69 × 100 = 20.3% when rounded to one decimal place. If the fictional clerk verifies that 7 flagged cards have been dealt with appropriately, 7 flagged cards remain open. All quantities are invented for teaching percentages. These cards are not real people, medical cases, court outcomes, hazardous events, risk probabilities or measurements of an actual place.
Now test whether this number tells the full story. Perhaps 69 represents only submitted requests, not everyone who needed help. Perhaps a change in reporting produces more flagged cards even while service quality improves. Perhaps the clerk recorded a closed case without checking whether the intended user was actually helped. A count, a resolution fraction, a waiting time and a meaningful outcome answer different questions. Ask learners to write the unit, denominator, observation date and the main limitation beside every number. They should resist the temptation to turn a neat calculation into a claim about an entire civilisation.
A safe, original activity for parents and tutors
Handover a four-pillar imaginary town plan to another class. Use four paper sheets headed “observation”, “evidence”, “alternative explanation” and “follow-up”. The first student explains what is seen in the invented scenario; the second checks what would support the claim. A third seeks someone whose needs were not considered, and a fourth decides what later record could show improvement. The tutor corrects unwarranted certainty and invites pupils to revise their reasoning. This is a non-operational paper exercise, not a professional inspection, public-safety drill, legal opinion, clinical assessment or advice about real environmental conditions.
For young learners, work with one chapter and only three coloured cards. For upper-primary children, ask for a second possible explanation. For secondary pupils, add the percentage calculation and source validity checks. For advanced learners, introduce a system diagram with several dependencies, an explicit counterexample and a comparison across two periods. In every version, assess whether the student can explain in their own words what would make the intervention fair and what evidence is still missing. The ideal outcome is independent judgement and humane problem-solving, not perfect agreement or a dramatic prediction.
Test the explanation without looking back
- Define: A sophisticated society maintains people-centred warning systems and keeps learning from gaps.
- Trace: High-tech sensors without trust, access and prepared response leave the chain incomplete.
- Check: Check multiple outcomes and maintain the system over time.
- Correct: Invest in inclusive science, coordination and responsible public communication.
- Practise: Handover a four-pillar imaginary town plan to another class.
- Limit: Explain why the imaginary Signalport model cannot establish the fate of a real society.
Finish with a handover statement that can be understood by the next learner: “The issue I investigated is … . The first claim is … . My source would be … . One competing explanation is … . I would make the process fairer by … . I would know the remedy worked when … . An important remaining uncertainty is … .” A child who can produce such a statement is learning the habit that civilisations themselves require: keeping knowledge usable, correcting errors, protecting people and handing functioning systems to those who come next.
A 90-minute parent-and-tutor learning plan
Begin with ten minutes of conversation about what must keep working in a community: accessible buildings, well-maintained services, people with relevant skills, trustworthy records and fair rules. Invite learners to propose examples before introducing early warning, responsible risk communication and preparedness. Explain that studying possible civilisational decline is not the same as making an apocalyptic prediction. People and institutions often continue despite difficult changes.
Use fifteen minutes to read the quick answer and one chapter together. Underline what the author directly claims, what is presented as a possible mechanism, and what belongs to the invented town. Ask learners whether each assertion has a source, and if so what year and geographic boundary the source describes. Use a second colour to mark uncertainty and evidence that would change a conclusion.
For twenty minutes, create the chosen chapter’s paper model. An observer records only what happened in the model. An evidence checker notes missing data and alternative explanations. An access reviewer asks whether a child, caregiver, professional or person needing a different information format can use the imagined service. A fourth person writes a handover. The exercise uses no personal records, hazardous materials, operational instructions or trauma enactments.
Spend fifteen minutes on the chapter’s invented arithmetic, requiring a unit and denominator with every result. Then allow fifteen minutes for a reasoned discussion of two plausible causal pathways. Students should identify a counterexample and a functioning buffer instead of assuming that every related service fails. The final fifteen minutes are for a teach-back, a written explanation of what remains uncertain and an appropriate follow-up question that an authority or careful historian could answer.
Glossary: careful words for complex societies
- Disruption: interference with ordinary performance; its scope and duration must be specified.
- Continuity: people’s ability to sustain or renew meaningful activities, institutions and knowledge.
- Collapse: a debated analytical term that should not be inferred from one event or image.
- Capability: the real ability to deliver an outcome, not just own tools or documents.
- Dependency: an input, service, skill or condition needed by another function.
- Alternative pathway: another feasible way to maintain a service when one route is unavailable.
- Buffer: reserve resources, flexibility or capacity that reduces disruption.
- Evidence: information relevant to testing a claim, assessed by source, method and context.
- Inference: a reasoned conclusion that is distinct from an observation.
- Forecast: a conditional estimate about a future outcome, not a confirmed observation.
- Denominator: the total or reference population used to calculate a proportion.
- Rate: a measure related to a specified base, often including time.
- Access: the practical ability to use a service, not merely its formal availability.
- Accountability: defined responsibility, reasons and fair means of examining errors.
- Recovery: a measured improvement or restoration of functions people actually need.
- Equity: fair consideration of differing needs and barriers, not an assumption that everyone has the same situation.
- Stewardship: responsible, ongoing care for resources, systems or shared institutions.
- Safeguarding: protective practice that respects people’s wellbeing, privacy and dignity.
Frequently asked questions
Does this topic predict that any particular society will end?
No. It explains conditional pressures and how different institutions might respond. A real forecast would require carefully justified scope and evidence.
Why is the fictional town used?
It lets pupils test reasoning without putting real people or high-stakes situations into classroom scenarios.
Can students use these paper exercises as real emergency or medical guidance?
No. Real safety, health, legal, engineering and environmental matters belong with qualified specialists and official authorities.
Why do the chapters have number exercises?
They teach honest denominators, units, record checking and the difference between a count and a verified outcome.
Can one country-level report show the experience of every resident?
No. Country-level indicators may conceal differences in access, geography, reporting and lived circumstances.
How can a parent use the material with a younger child?
Choose one chapter, three paper cards and a short teach-back. Avoid graphic or personal examples.
What makes a successful tutor lesson?
A learner can explain the mechanism, identify one unsupported assumption, check a source and show how a fair correction could be verified.
Do fictional examples count as source evidence?
No. They are original educational devices. Documented external claims need their own real sources.
What does the series mean by repair?
Repair means a useful capability has been restored or improved for its users, supported by evidence, not merely a change in language.
What is the broader message?
People, institutions, care, knowledge and cooperation are the central capabilities worth maintaining across generations.
Source notes, original illustrations and further reading
The linked reports and institutional pages provide dated context for early warning, responsible risk communication and preparedness. They do not validate the fictional Signalport town, endorse the invented calculations or certify any particular institution. Readers should check source updates and relevant national law or operational guidance when applying information after October 2026. The featured image is disclosed as an existing educational illustration, not a live documentary photograph.
- UNDRR, Early Warnings for All pillars
- UNDRR, Definition of early warning systems
- WMO, Global Status of Multi-Hazard Early Warning Systems 2025
- UNDRR, Monitoring and Evaluation of Early Warnings for All, 2025
- UNDRR, Sendai progress report, August 2026
- Singapore Civil Defence Force, Public Warning System
- United Nations Office for Disaster Risk Reduction, Sendai Framework
- Google Search Central, helpful and reliable content
- Google Search Central, AI-generated material guidance
- Google Search Central, image context and image SEO
Continue through eduKate’s civilisation library
- Civilisational foundations
- Safe water and continuity
- Shared rules and trust
- Public health and care capacity
- Environmental stresses
- Education and skills transmission
- Institutional learning and correction
The central purpose of this article is educational: teach a student to identify what people need, separate observation from interpretation, reconstruct the relevant dependencies, check sources, respond with care and test whether an improvement really works. A civilisation’s most important inheritance is not the size of its buildings alone, but the ability to keep teaching, maintaining and correcting the systems on which future people depend.