
The core aim of Bukit Timah Additional Mathematics tuition for tangent graphs is to help Secondary 3 and Secondary 4 students sketch and interpret y=a tan(bx), identify its period and vertical asymptotes, and distinguish tangent from the bounded sine and cosine functions. Singapore’s 2026 O-Level 4049 and 2027 G3 SEC K341 Additional Mathematics syllabuses explicitly include graphs of y=a tan(bx), with real a and positive-integer b. The important skill is not artistic curve drawing. It is recognising where the graph crosses the axis, where it becomes undefined and how its repeating structure changes when b changes.
A student who has drawn hundreds of sine waves meets y=2tan(3x) and carefully adds a maximum and minimum of ±2. That is a sensible guess if every trigonometric graph so far was sine or cosine—but it is wrong. Good Additional Mathematics tuition in Bukit Timah explains that tangent is fundamentally different: it has no finite amplitude and its branches approach vertical asymptotes. Once the learner understands why, the graph can be sketched from a handful of landmarks instead of copied from a calculator.

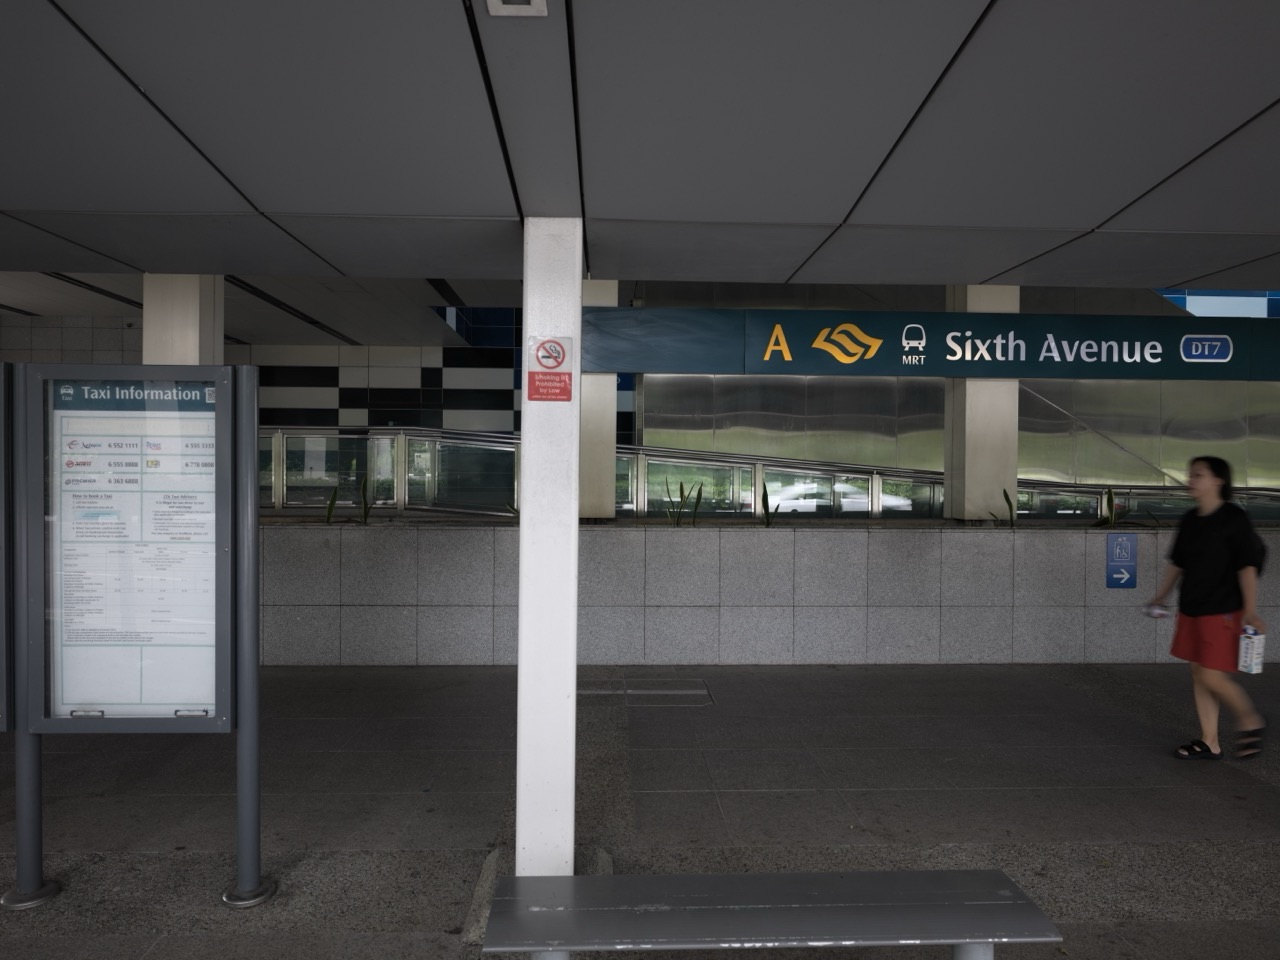
At eduKateSG, suitable Additional Mathematics learners work in groups of up to three at 8 Fourth Avenue, Singapore 268674, near Sixth Avenue MRT. Tutorials are generally 1.5 hours weekly. The tutor can check whether a student is confusing the period, drawing a false intersection at an asymptote or using a sine-and-cosine amplitude rule on a tangent function.
The short answer: tangent has repeating branches, not waves with peaks
Tangent is defined by tan x=sin x/cos x wherever cosine is not zero. It takes every real value between its vertical asymptotes, unlike sine and cosine, which always stay between −1 and 1 before any vertical scaling. The basic tangent graph passes through the origin, rises across its central branch and repeats every 180° or π radians.
Because tangent has no highest or lowest value on a complete branch, the term amplitude does not apply. A vertical multiplier a stretches or reflects the graph but does not produce maximum and minimum levels as it would for sine or cosine.
- Period:
tan xrepeats after 180° or π radians. - Zeros:
tan x=0at whole multiples of 180° or π radians. - Vertical asymptotes:
tan xis undefined at 90°+180°k, where k is any integer. - Range: tangent takes all real y-values on a complete branch.
- No amplitude: tangent is unbounded above and below.
- Graph family: in
y=a tan(bx), b changes the horizontal period and a controls vertical stretch or reflection.
Why tangent is undefined at certain angles
Take 90°. We know sin90°=1 and cos90°=0. The expression tan90°=sin90°/cos90° would require division by zero, which is undefined. The graph cannot have a normal plotted point at x=90°.
As x approaches 90° from the left, tangent grows without bound in the positive direction. As x approaches 90° from the right, it falls without bound in the negative direction. A dotted or dashed vertical line at x=90° marks the asymptote; the tangent curve approaches but never crosses it.
The same pattern repeats at 270°, 450° and equivalent angles in the negative direction. These are not random exceptions—they occur wherever cosine is zero.
A simple degree-mode table for the parent graph
Between −90° and 90°, four values provide useful landmarks: tan(−45°)=−1, tan0°=0, tan45°=1, and the function becomes undefined as x reaches either −90° or 90°. These values tell us that the central branch rises from negative infinity, crosses the origin and heads towards positive infinity.
We can sketch the central branch with a smooth increasing curve and vertical asymptotes at −90° and 90°. Then repeat the same shape 180° to the left and right. The curve is not drawn as a straight line; its slope changes and becomes increasingly steep near the asymptotes.
A student who can identify the zeros and asymptotes before sketching has the essential graph structure. A memorised S-shape without correct vertical boundaries is much less useful.
What a and b do in y=a tan(bx)
In the syllabus form y=a tan(bx), the positive integer b appears inside the tangent function. Because the ordinary tangent period is 180°, the new period is 180°/b, or π/b radians.
The multiplier a appears outside. When a is positive, larger values stretch the vertical coordinates away from the x-axis. When a is negative, the graph is reflected in the x-axis. If a=0, the function reduces to the constant y=0 wherever its tangent expression is defined, so the usual unbounded-branch discussion concerns a nonzero multiplier.
Students should not confuse an inside multiplier with a horizontal translation. tan(3x) repeats three times as frequently as tan x; it is not tangent shifted three units left or right.
Worked example 1: sketch y=2tan(3x)
Let x be measured in degrees and consider y=2tan(3x). The period is 180°/3=60°. The vertical factor 2 doubles every finite y-value of tan(3x), but the graph still has no finite amplitude.
Zeros occur when 3x=180°k, so x=60°k. Between 0° and 180°, the x-axis crossings are therefore 0°, 60°, 120° and 180°. They mark regular intervals of 60°.
Asymptotes occur when 3x=90°+180°k, giving x=30°+60°k. In the range 0° to 180°, these are x=30°, x=90° and x=150°. At those coordinates the graph is undefined and no filled points should be plotted.
To obtain another landmark, choose x=15°. The inside angle is 45°, so y=2tan45°=2. At x=45°, the inside is 135°, so y=−2. The branch positions now make sense: each smooth rising branch sits between neighbouring asymptotes and crosses a zero halfway through.
Why the graph must not cross a vertical asymptote
An asymptote marks an input where the expression is undefined. Drawing a tangent curve through the dashed line falsely suggests that the function has a finite point at the forbidden x-value. The plotted branches should remain separate.
This is different from drawing a continuous sine or cosine wave, which exists for every real angle. One of the most valuable graph-reading questions a tutor can ask is simply, “Is there any x-value at which this function stops being defined?”
A graph can approach an asymptote from both sides with different signs, and it may become very steep near the line. But closeness to the line does not make the function defined on that line.
Worked example 2: negative a reflects the tangent graph
Consider y=−2tan(2x), again in degrees. The period is 180°/2=90°. Its zeros occur at 2x=180°k, giving x=90°k. Its asymptotes occur at 2x=90°+180°k, giving x=45°+90°k.
The negative factor reflects the graph vertically. On the central interval from −45° to 45°, the branch now decreases rather than increases. At x=22.5°, 2x=45°, so y=−2. At x=−22.5°, 2x=−45°, so y=2.
Notice what has not changed: the asymptote locations and period depend on the inside multiplier b, not on whether a is positive or negative. The vertical reflection changes the direction of the branches while leaving their horizontal repeating pattern intact.
Radian form: the same structure in different units
If angles are written in radians, the parent tangent period is π and asymptotes occur at π/2+kπ. For y=3tan(2x), the period is π/2, and the asymptotes satisfy 2x=π/2+kπ, so x=π/4+kπ/2.
Zeros occur at 2x=kπ, or x=kπ/2. On a central branch the point x=π/8 gives tan(π/4)=1, so y=3. This is exactly analogous to using 22.5° and 45° in a degree example.
Students should not write a period of 90 for a radian question or π/2 for a question requesting a degree answer. The representation must match the question’s angle units.
An important difference between tan(bx) and tan(x/b)
For positive b, multiplying the angle by b squeezes the tangent graph horizontally. In contrast, dividing the angle by b stretches it horizontally. For instance, tan(2x) has half the ordinary tangent period; tan(x/2) has twice the ordinary tangent period.
The 2027 G3 syllabus specifically lists the family y=a tan(bx), with b a positive integer. Comparing other expressions can support understanding, but revision priorities should remain within the published examinable form unless a teacher sets an extension.
Worked example 3: solve an equation by reading periodicity
Solve 2tan(3x)=2√3 for 0°≤x≤180°. Divide by 2 to get tan(3x)=√3. Let u=3x; the transformed interval is 0°≤u≤540°.
Tangent equals √3 at 60°, repeating every 180°. Within the transformed bounds, the angles are u=60°,240°,420°. Divide each by three to obtain x=20°,80°,140°.
Each answer corresponds to a crossing of the horizontal line y=2√3 with a different tangent branch. This connects graph knowledge with equation-solving completeness. A student who reports only x=20° has stopped at the first branch.
How the asymptotes guide equation solutions
Graph thinking helps students see why the previous example has three answers. The transformed angle u travels through one and a half full tangent periods beyond the first 180°; each eligible branch may supply another intersection with a horizontal line.
The intervals of x separated by asymptotes are distinct branches. Each nonzero-multiplier tangent branch is strictly increasing when a is positive and strictly decreasing when a is negative. A horizontal line intersects each such complete branch once.
This perspective helps students detect an implausible answer count. If a question spans several branches but only one solution has been written, the transformed angle interval should be checked again.
Why tangent and sine have different graph behaviours
Sine and cosine are bounded and repeat after 360° or 2π radians. Tangent is unbounded and repeats after only 180° or π radians. Its asymptotes arise from division by cosine. This is why applying a sine-style “amplitude of two” description to 2tan x is mathematically incorrect.
When modelling a quantity that oscillates between fixed upper and lower limits, sine or cosine is typically a more natural first model. A pure tangent function has no finite upper or lower bound on its complete branches, so using it for a physically bounded quantity would need careful justification.
A-Math questions may present simplified mathematical models, but students should still interpret what a proposed graph implies. A graph is a statement about possible outputs and undefined inputs, not merely a shape to reproduce.
Worked example 4: identify period and asymptotes from the equation
Suppose y=−4tan(5x), with x in degrees. The period is 180°/5=36°. The zeros occur at x=36°k, and vertical asymptotes at x=18°+36°k, for integers k.
The vertical coefficient −4 makes each branch decrease and scales its y-values by a factor of four relative to tan(5x). At x=9°, the inside angle is 45° and y=−4. At x=27°, the inside angle is 135° and y=4.
A student can sketch a complete branch between x=18° and x=54° without guessing any maximum or minimum. The correct elements are the asymptotes, the zero at x=36°, and the decreasing curve passing through nearby landmarks.
What if a is zero? A useful mathematical boundary case
If a=0 in y=a tan(bx), the expression is zero wherever tan(bx) is defined. The original expression still has inputs excluded by tangent’s denominator, even though zero times a defined value is zero. A line y=0 drawn across every real x would be a continuous extension, not literally the original expression at forbidden inputs.
For school graph questions the interesting cases generally use nonzero a, producing the familiar vertical branches. But discussing the zero multiplier once can make students more attentive to the difference between an algebraic simplification and the domain of an original formula.
Common graph mistakes and the learning gaps behind them
- Inventing an amplitude: giving tangent fixed peaks like a sine graph.
- Wrong period: using
360°/binstead of180°/b. - Missed vertical asymptote: joining branches through an undefined angle.
- Wrong b transformation: treating
tan(3x)as a horizontal shift. - Wrong negative-a effect: stretching a branch but not reflecting its direction.
- Units mismatch: mixing π-based radians with degree tick labels.
- Incomplete equation solutions: finding only the first value in a multi-branch interval.
- Unsafe graph reading: claiming a finite tangent value at 90° or an equivalent asymptote.
A six-step routine for sketching y=a tan(bx)
- 1. Check the units: degrees or radians.
- 2. Calculate the period:
180°/borπ/b. - 3. Locate the zeros: solve
bx=180°korbx=kπ. - 4. Locate the asymptotes: solve
bx=90°+180°korbx=π/2+kπ. - 5. Add landmarks: use 45° or π/4 equivalents and multiply by a.
- 6. Draw separate branches: reflect when a is negative and check that none crosses an asymptote.
The method is reliable because it builds the graph from properties of tangent. Copying a rough wave-shape from memory cannot tell a student what to do when a or b changes.
How 3-pax tuition can make this topic stick
A useful diagnostic asks each student to sketch tan x from −90° to 270° and mark undefined angles. Then the tutor changes the expression to 2tan(3x), and students derive the new period and asymptotes before touching the axes. This reveals whether they understand transformation rather than merely recognise a picture.
The third stage uses a negative coefficient to test reflection, followed by a simple tangent equation over a restricted interval. Learners must list all solutions and explain why the period creates repeated answers. In a group of up to three, the tutor can inspect every student’s sketch and reasoning.
The eduKate learning loop remains diagnose, explain, practise, check, vary and retrieve. A student who can derive the asymptote positions on a changed graph has learned more than one who accurately copies the last diagram.
What parents can ask during a short revision check
Parents can ask three questions: “Does tangent have an amplitude?”, “Where is it undefined?” and “What happens to its period when the angle is multiplied by three?” The learner should explain that tangent has no amplitude, its undefined angles arise where cosine is zero, and the period becomes one-third of the original.
Try one sketch in degrees and another in radians during the week. Have the student mark zeros and asymptotes first. An accurate branch shape becomes easier once those boundaries are correct. Keep an error log distinguishing period, asymptote, reflection and unit mistakes.
Frequently asked questions
Is tan x an A-Math graph topic? Yes. The official G3 SEC syllabus includes graphs of y=a tan(bx) and simple trigonometric equations in stated intervals.
Why is there no tangent amplitude? Tangent takes arbitrarily large positive and negative values near its vertical asymptotes, so there is no finite maximum distance from a midline.
Why does tangent repeat after 180°? Sine and cosine both change sign after a half turn, so their ratio remains the same: tan(x+180°)=tan x wherever defined.
Do students need a graphing calculator to sketch it? No. Zeros, asymptotes, period and a few exact-angle landmarks give enough structure for a clear hand sketch. A calculator can be used as a check when permitted.
The core aim: a graph that explains its own behaviour
A tangent graph is easier to understand when the student knows which inputs are forbidden, how often the branches repeat and how a coefficient changes the shape. It is not a sine wave with different decoration. It is a different function whose structure can be derived from sine and cosine.
The purpose of Bukit Timah Additional Mathematics tuition for tangent graphs is to develop students who calculate periods correctly, sketch separate branches, locate asymptotes honestly and use graph reasoning to find all valid equation solutions. Those habits make trigonometry more dependable and prepare students for the calculus of tangent later on.
Continue with trigonometric graphs, amplitude and R-form, equations, radians and restricted intervals, secant and cotangent identities and the Additional Mathematics hub. The official 2027 syllabus is available from SEAB’s G3 subject directory or directly as the K341 Additional Mathematics syllabus.