
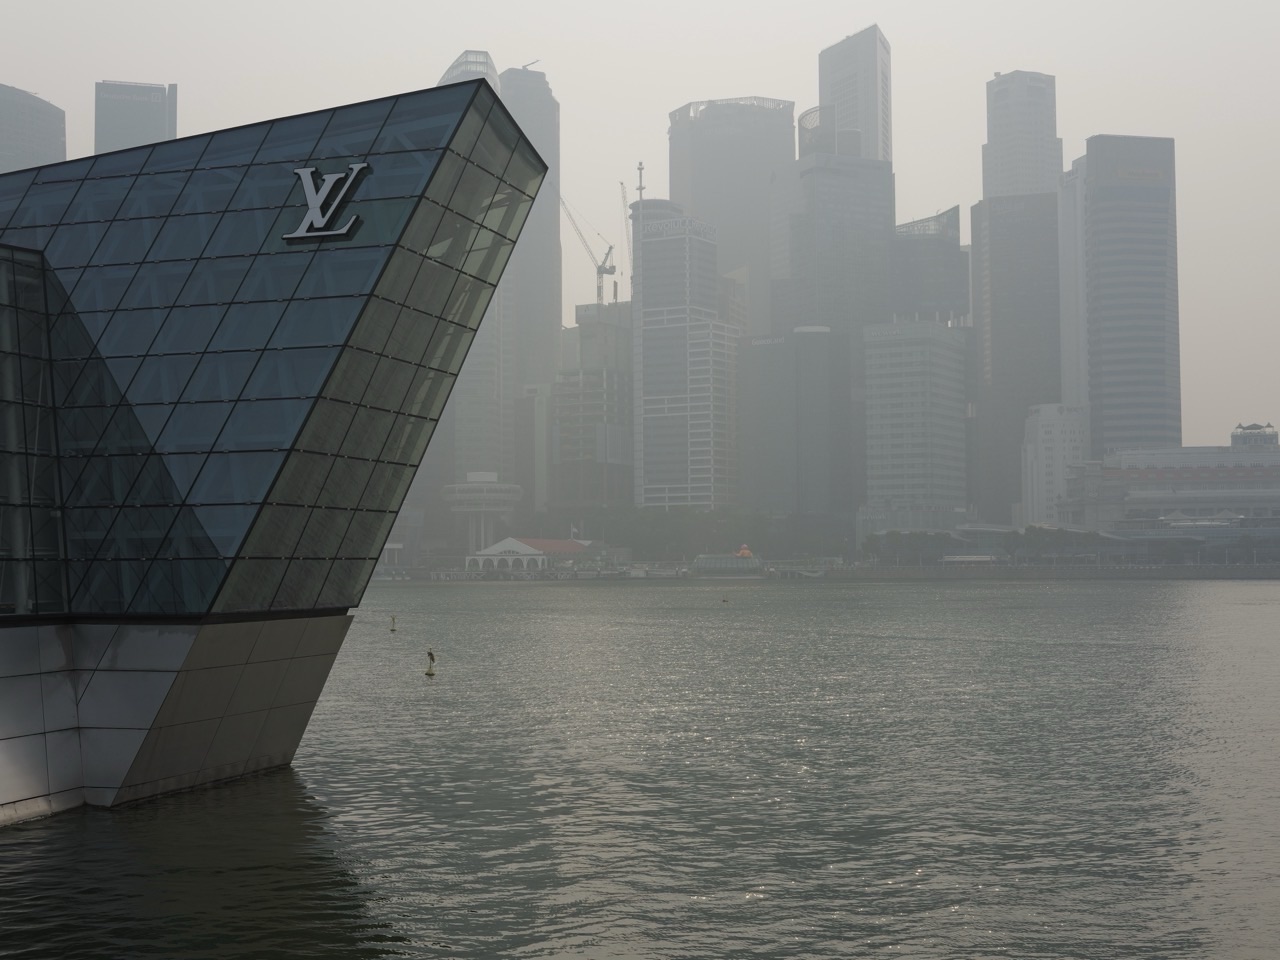
Singapore haze is one of the clearest ways to see a global connectivity problem with your own eyes: smoke produced far from where you stand can move across borders, alter local air quality and change decisions about school, exercise, work, travel and public health. The same winds that connect weather across Southeast Asia can also carry pollution, making transboundary haze a lesson in how environmental systems ignore political boundaries.
On 7 October 2026, Singapore’s haze was not an abstract case study. At 6pm, the National Environment Agency reported 1-hour PM2.5 readings of 71–136 µg/m³ in the Elevated band and 24-hour PSI readings of 105–140 in the Unhealthy range, while moderate to dense smoke plumes from southern Sumatra were observed drifting towards Singapore. That makes today’s skyline a useful learning specimen for understanding Singapore haze 2026, transboundary haze, PSI, PM2.5 and regional air pollution together.
Problems & resilience route: return to the Global Connectivity Problems Hub to compare environmental shocks, infrastructure failures, digital disruption, trade chokepoints and financial-system outages through one resilience framework.
Return to the Global Connectivity Hub when you want to compare haze with other failures in transport, digital networks, energy, finance, science and public systems. For the normal connected mechanisms behind this problem, continue through Weather and Climate, Public Health and International Rules.
The photograph is evidence, but only of what it can show

A hazy skyline can show reduced visibility at a particular place and moment. It cannot by itself prove where the smoke originated, how much PM2.5 was present, what caused a fire, or how long the episode will last. Those questions need measurements, satellite observations, weather analysis and official reporting. This is an important research habit: a strong photograph can be vivid evidence without being complete evidence.
Haze makes invisible connectivity visible
A normal day hides the air system because air is everywhere. Haze reveals it. The atmosphere is a moving fluid, and particles released in one place can be transported by winds into another jurisdiction. The useful network is therefore not country A versus country B. It is a chain: land conditions → fire and emissions → atmospheric transport → monitoring → local exposure → decisions → regional response.
Air has no customs checkpoint
Ships, people and parcels encounter formal borders. Air masses do not. A plume can cross a national boundary without presenting a passport or waiting for a customs officer. This is why transboundary pollution creates a governance problem: the physical process moves continuously across a map whose legal responsibilities are divided among separate states.
What was happening on 7 October 2026
NEA’s 7 October haze advisory reported moderate to dense smoke plumes from southern Sumatra drifting towards Singapore and smoke haze associated with hotspots detected in Kalimantan. Dry conditions were expected to continue over central and southern Sumatra and many parts of Kalimantan, with prevailing southeasterly to southerly winds capable of carrying haze towards Singapore.
The regional haze situation also showed why one city’s air quality belongs to a larger Southeast Asian weather system. Satellite-detected hotspots, cloud cover, wind direction and ground measurements all contribute different pieces of evidence.
PSI and PM2.5 answer different questions
The 24-hour Pollutant Standards Index is designed for a longer time horizon and is useful for planning. The 1-hour PM2.5 reading gives a more immediate indication of fine-particle conditions for near-term activity decisions. Neither number is “the haze” itself. They are measurements and indexes used to describe aspects of air quality.
That distinction matters because connected systems are often represented by indicators. A dashboard is useful only when the reader understands what the metric includes, its time window and the decision it is meant to support.
The first global-connectivity failure is distance between cause and consequence
When cause and consequence happen in different places, responsibility becomes harder to see. A resident in Singapore experiences visibility loss or elevated particulate readings even though the immediate source may be hundreds of kilometres away. The people affected and the people controlling the relevant land, fire or enforcement decisions may not share the same institutions.
The second failure is timing
Smoke transport depends on weather. A problem can intensify quickly when winds align, then ease when wind direction or rainfall changes. This makes haze a moving-risk problem rather than a static pollution source. The system needs monitoring that updates faster than the conditions change.
The third failure is incomplete observation
Satellites can detect hotspots and smoke, but cloud cover can hide parts of the picture. Ground stations measure air quality locally, but they do not directly observe every source. Models estimate movement, but models simplify reality. Good decisions therefore combine multiple imperfect observations rather than pretending one sensor can explain the whole episode.
The fourth failure is unequal exposure
The same regional haze does not affect every person in the same way. Time outdoors, activity intensity, building filtration, occupation, age and health status can change the practical impact. That is why official health guidance distinguishes among groups and why immediate activity decisions should use current official readings rather than a photograph or smell alone.
A Mathematics model of exposure time
Use an educational model, not a medical formula. Suppose two people spend 30 and 120 minutes outdoors under the same assumed conditions. The second person experiences four times the outdoor duration. If activity intensity also differs, the comparison becomes more complicated. The lesson is that risk cannot be inferred from concentration alone; duration and activity matter too. For actual health decisions, use NEA’s official advisories rather than this illustrative model.
Haze can interrupt more than outdoor exercise
- schools and sports programmes may alter outdoor activities;
- construction, delivery and other outdoor work may need additional precautions;
- tourism and outdoor events can become less attractive or harder to operate;
- aviation and maritime operations may face reduced visibility concerns even when formal operating thresholds are not crossed;
- health services may see different demand patterns;
- households and businesses may increase use of air filtration and indoor spaces.
One environmental disturbance can therefore propagate into education, labour, transport, tourism, retail, energy use and healthcare. That is the wider connected-system lesson.
Haze is also an information problem
People want to know: Is it safe to run? Should school activities change? Will conditions improve tonight? Is the smoke local or transboundary? Those are different questions requiring different evidence. A single social-media photograph cannot responsibly answer all of them.
Regional cooperation is part of the infrastructure
ASEAN’s Agreement on Transboundary Haze Pollution exists because the atmosphere connects countries whether policy is coordinated or not. Regional monitoring, alert levels, information exchange and response procedures create an institutional network around the physical one.
Prevention is upstream; protection is downstream
Air purifiers, masks, changed activity and indoor arrangements can reduce some downstream effects, but they do not remove the upstream fire or emissions source. Conversely, source prevention does not eliminate the need for monitoring and public guidance once haze is already moving. Resilience requires both ends of the chain.
A useful resilience map
- prevent — reduce fire and land-management conditions that create avoidable smoke;
- detect — monitor hotspots, weather and air quality;
- forecast — estimate transport and likely changes;
- communicate — give people timely, understandable guidance;
- protect — reduce exposure when conditions deteriorate;
- coordinate — share information and response across borders;
- learn — compare what forecasts and interventions got right or wrong.
Singapore is both an affected place and an observing node
Singapore is small enough that haze can feel like something arriving from outside, but it is not merely passive. Air-quality stations, meteorological analysis, satellite interpretation, public advisories and regional cooperation make Singapore part of the monitoring and response network. Global connectivity problems are rarely solved by pretending one node can disconnect itself from the system.
Use the photograph as a classroom investigation

Ask a learner to record five statements: two things directly visible, one measurement from NEA, one regional observation from satellite or weather reporting, and one uncertainty. Then draw the chain from fire to smoke to wind to Singapore to public response. This prevents the common error of turning an image into a complete causal story.
Vocabulary that clarifies the system
- transboundary — crossing a political or national boundary;
- particulate matter — tiny particles suspended in air;
- PM2.5 — fine particulate matter with aerodynamic diameter of 2.5 micrometres or smaller;
- hotspot — a satellite-detected area of elevated heat that may indicate fire;
- plume — a body of smoke or pollutants moving through air;
- prevailing wind — the dominant wind direction over a period;
- exposure — contact with an environmental condition over time;
- mitigation — action that reduces severity or impact.
Frequently asked questions
Is haze only a Singapore problem?
No. Smoke haze can affect multiple parts of Southeast Asia, including places close to fires and places downwind. The physical system is regional even when local readings and impacts differ.
Can a photograph tell me the PSI?
No. A photograph can show visibility conditions, but PSI and PM2.5 require instrument measurements and defined calculation methods.
Why can haze change quickly?
Wind direction, wind speed, rainfall, atmospheric mixing and continuing emissions can all change the amount of smoke reaching a location.
What should people use for current activity decisions?
Use current official guidance. NEA advises referring to 1-hour PM2.5 for immediate outdoor activities and the 24-hour PSI forecast and health advisories for planning ahead.
Keep the return paths visible
Continue through Weather and Climate, Public Health, Forests and Biodiversity, Maps and Geospatial Data and the Global Connectivity Hub. Haze shows what happens when an environmental flow crosses borders faster than responsibility can.
A final connected-air investigation
Use one of the eduKateSG haze photographs, the NEA 7 October advisory and one ASEAN regional source. Build a one-page explanation containing one image observation, one air-quality measurement, one wind or hotspot observation, one uncertainty and one diagram of the cross-border handovers. The goal is not to dramatise the haze. It is to explain the connected mechanism accurately.
Related eduKateSG master hub: The transboundary-smoke case connects to How Haze Works | SEA 2026, a 42-chapter guide to regional peat fires, monsoon winds, PSI and PM2.5, health, community decisions and prevention.