
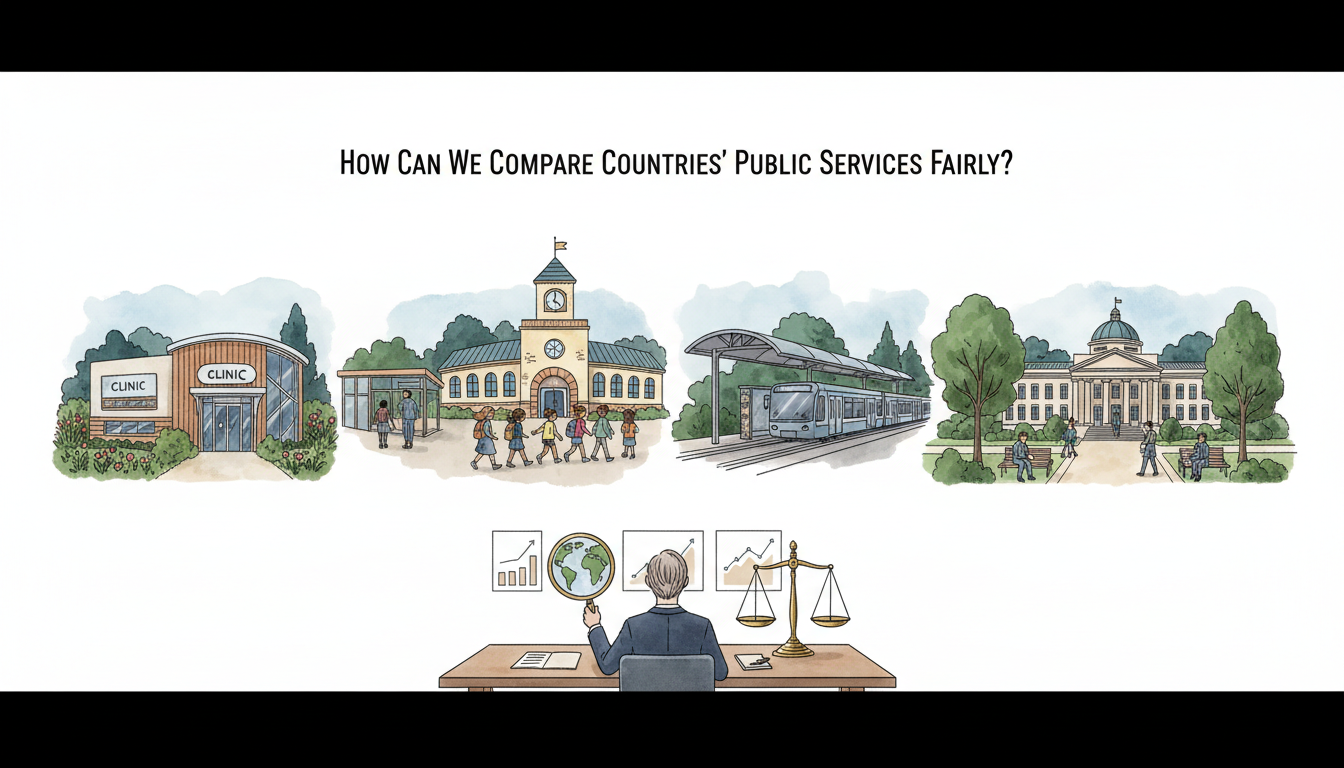
A country can spend more on a public service and still deliver worse outcomes. Another may spend less, serve a younger population, or report data using a different definition. Comparing them fairly requires more than a league table with flags and one big number.
Imagine two countries reporting that 90% of children attend school. One counts children enrolled at the start of the year; the other measures attendance on a particular day. The percentages look identical, but they do not necessarily describe the same experience.
That is why this final comparison guide asks how we can compare countries’ public services fairly. The answer is to compare the same service, the same kind of user, compatible measurements and the same reference period—then examine how the service actually reaches people.
This article completes the 50-question How Countries Work comparison series and connects the individual mechanisms back to the A–Z guide to 195 countries and everyday life.
Quick answer: compare the whole service chain, not a single number
A practical model is need → legal eligibility → funding → operating capacity → service delivered → actual outcome → fairness across groups → long-term resilience.
For every country comparison, write down:
- Who needs the service? The relevant age group, patients, households or geographic population.
- Who qualifies? Citizenship, residence, income, insurance and other conditions.
- What is measured? Budget, staff, applications, actual delivery or outcomes.
- What is the denominator? All residents, eligible users, children in school or cases processed.
- What is the date? Financial year, academic year or survey period.
- What differs by place or group? Rural–urban access, disability, poverty, age or another relevant factor.
- What does the indicator miss? Waiting time, quality, household cost, service interruptions or future sustainability.
The most important rule is compare like with like, and say openly when like-for-like data do not exist.
Start by defining the service
“Public healthcare” might mean primary care, hospitals, emergency treatment, vaccinations or long-term care. Countries fund and organise these differently.
“Public education” might refer to preschool, primary schools, secondary schools, universities or lifelong learning.
Even “public transport” can cover metropolitan rail, rural buses, publicly subsidised private routes or government-owned ferries.
A country ranking that adds all these categories together may conceal what readers actually want to know.
Start with one service and an explicit question: Can a typical resident who needs this service obtain it safely, affordably and on time?
Separate inputs, processes, outputs and outcomes
The OECD’s Government at a Glance 2025 uses distinct categories covering government inputs, processes, outputs and outcomes.
These categories are useful far beyond OECD countries.
| Measure | Example in a health service | What it does not establish |
|---|---|---|
| Input | Public budget, medical workforce or equipment | That patients were actually treated well |
| Process | Referral rules, appointment scheduling or claims handling | That the system achieved better health |
| Output | Consultations or vaccinations delivered | That everyone in need received the service |
| Outcome | Health, recovery or avoidable harm measures | That the result was caused by this policy alone |
| Equity | Differences in access among income groups or regions | That one national average describes all residents |
| Resilience | Ability to continue during disasters or staffing shortages | That normal-year efficiency guarantees crisis readiness |
A fair assessment uses several categories rather than selecting the one that makes a preferred country look best.
Why government spending per person can mislead
Two countries may report public healthcare expenditure of $2,000 and $1,000 per resident. That does not by itself mean the first country delivers twice as much care.
The figures may be in different currencies, local prices may vary, populations may have different ages, or private spending may be recorded differently.
The OECD’s 2025 general-government expenditure methodology uses defined national-accounts concepts and applies purchasing power parities (PPP) when comparing expenditure per person internationally.
PPP adjustment aims to make amounts more comparable in terms of what money buys in different economies. It does not eliminate differences in workforce skill, service quality, geography or the costs of a particular hospital treatment.
The correct question is what resources are available, what prices apply, and what outcomes those resources help deliver.
Why percentage of GDP is not the whole answer
A country may spend 6% of GDP on public healthcare and another 9%. That can be useful information about relative economic commitment.
But GDP can differ greatly, as can population age and health needs. A country with a small GDP may devote a high share to healthcare while still having few doctors or limited equipment per person.
The measure also needs a clear spending definition: does it include public health insurance? State and local government? Preventive services? Residential care? Private insurance or household payments?
A fair comparison can show spending as a share of GDP, PPP-adjusted spending per person, and service access or outcomes side by side.
It should not collapse them into a single unsupported verdict.
Healthcare: coverage is not the same as financial protection
The World Health Organization’s universal health coverage monitoring distinguishes two issues:
Service coverage: Whether people can access needed essential health services.
Financial hardship: Whether household payments for healthcare create an unacceptable financial burden.
The WHO uses a UHC service coverage index built from tracer measures spanning reproductive and child health, infectious diseases, noncommunicable conditions and service capacity.
The index is a summary tool, not a complete list of every service or a promise that an individual patient faces no fees. WHO documentation notes limitations and the use of some proxies where direct data are unavailable.
A good comparison should therefore inspect the components and separate healthcare availability from the money households must pay.
Why national healthcare averages can hide problems
Imagine a country with excellent specialist hospitals in its capital and very limited access in remote provinces. Its national health indicator may improve while rural residents still travel long distances for basic care.
Other disparities can involve age, disability, income, ethnicity, language or legal residence where appropriate and lawfully measured.
The country comparison should ask which groups are missing, not merely how high the average stands.
An increase in national vaccination coverage is meaningful. But if the increase is concentrated among children who were already better served, the national average can hide continuing exclusion.
The experience of the least-served populations is part of public-service quality.
Education: participation, learning and well-being differ
A government can increase the number of school places without ensuring every child learns to read competently.
Enrolment, attendance, progression, examination results and broader learning outcomes measure different things. They may use different populations and reporting periods.
School systems also vary in age of entry, grade structure, curriculum, assessment and whether private or publicly assisted institutions are counted.
The World Food Programme’s 2025 report on school meals offers an example of measurement boundaries. It estimates at least 466 million children receiving school meals globally using 2024 programme data.
That count is useful, but it cannot by itself reveal whether every eligible child received nutritious food every school day, whether the meals met relevant standards, or whether the programme improved attendance compared with an appropriate baseline.
For education comparisons, combine who is covered, what service or instruction is delivered, what learners achieve, and whether access is fair.
Transport: number of routes versus actual usefulness
A country could have 500 rural bus routes, while another has 100. The first is not automatically better.
Routes may differ in frequency, reliability, length, operating hours and the distance people must walk to a stop. A timetable may list a bus once a day at an inconvenient hour. Another area may provide flexible demand-responsive transport.
Measure the share of people able to reach a needed destination within an acceptable time and cost, especially those without a private car.
This is why a comparison of rural transport needs geography and resident access, not just the number of vehicles or kilometres of road.
See Who Pays to Keep Rural Public Transport Running? for the financing mechanisms behind routes that would not survive on fares alone.
Coverage denominators are especially important
Suppose Country A reports that 80 of 100 eligible households receive a housing benefit. Country B reports that 90 of 150 eligible households receive a similar benefit.
Country A has 80% take-up; Country B has 60%. Reporting only the raw recipients—80 versus 90—could reverse the apparent story.
But even the percentage must be interpreted carefully. Were the eligibility rules the same? Did both include temporary residents? Are estimates of eligible non-recipients reliable?
These are hypothetical numbers to illustrate denominators. Real benefit comparisons should use current country-specific definitions.
The companion benefit non-take-up article explains why approved claims and people actually receiving support can differ.
Units, currencies and time periods must match
A misleading chart often combines numbers that are individually correct but not comparable.
A country may publish a budget in nominal local currency for 2026, while another provides inflation-adjusted PPP figures for 2023.
A hospital waiting-time indicator may report the median in one country and the mean in another. One may exclude cancelled appointments while another includes them.
The OECD’s 2025 structure and indicator methodology emphasises definitions, sources and limitations accompanying each indicator.
Before comparing, standardise or disclose: – The reference year or period. – Currency and price adjustment. – Population covered by the statistic. – Units and denominator. – Average, median or distribution. – Completeness of reporting. – Methodological changes from earlier years.
If the measures cannot be aligned, explain the limitation rather than manufacture precision.
Public responsibility differs between countries
One country runs schools through national ministries. Another gives authority to states, provinces or municipalities. Public hospitals may be owned by government, managed by nonprofit providers or purchased from regulated private facilities.
Government spending can also pass through grants and social insurance rather than direct provision.
The OECD uses the System of National Accounts definition of general government for many international fiscal indicators, including central and subnational governments and social-security funds.
A fair comparison must know where the expense appears in each government’s accounts. It should not count only a ministry’s visible budget in one country and all public-sector spending in another.
Population composition changes needs
Older populations often need more health and long-term-care support. Young populations may require more school places and early-childhood services.
Remote islands have different transport and logistics costs from densely populated cities. Countries exposed to earthquakes or extreme floods may require more infrastructure resilience.
These differences do not invalidate comparison. They require context when interpreting an outcome or spending figure.
A useful report can show national averages alongside age structure, population density, rural share and relevant risk factors, without assuming that all differences are explained by demographics.
A worked fair comparison: two fictional healthcare systems
Imagine Country A and Country B, each with a public health programme.
| Indicator | Country A | Country B |
|---|---|---|
| Relevant service coverage | 90% | 85% |
| Average appointment wait | 24 days | 12 days |
| Households facing a defined financial-hardship threshold | 15% | 8% |
| Residents in remote areas with timely access | 60% | 82% |
These are fictional teaching values, not rankings of real countries.
Country A has higher overall coverage. Country B has shorter waits, lower measured household hardship and better remote access.
Which system is better? A responsible answer depends on the public question being asked and the validity of each measurement. It would be misleading to select the first row and declare a universal winner.
Several dimensions can move in different directions at the same time.
Why satisfaction surveys must be interpreted carefully
People’s views matter. Residents can report difficulty obtaining care, confusion about forms or frustration with transport.
But survey satisfaction can be influenced by expectations, culture, recent experiences and how a question is translated. A service user may report high satisfaction despite weak objective coverage, or lower satisfaction because expectations are particularly high.
The OECD’s Government at a Glance 2025 dashboard includes measures of trust and satisfaction alongside governance and public-service indicators.
Satisfaction should complement service delivery and outcome evidence, not replace it.
How to compare change over time
A country may improve from a very weak starting point but remain below a country whose services were already strong.
A fair report can show both current performance and change from the baseline.
For example, a school-meal programme increasing coverage from 20% to 45% has made a substantial improvement, even though a country with 90% coverage still serves a higher proportion at the current date.
Growth rates can be distorted when the initial base is small. Conversely, a country already close to full coverage may have little room for a dramatic percentage gain.
Readers should see both the level and the trajectory.
Do policies actually cause the outcomes?
A country can introduce a new service policy and later report lower poverty or better exam results. That does not automatically mean the policy caused the change.
Other factors may include economic growth, population shifts, changes in household behaviour or unrelated reforms.
Credible impact evaluation—through appropriate comparison groups, trials or other methods—can help estimate causality. The UK Magenta Book, updated May 2026 explains why evaluation needs a clear design and attention to the limits of evidence.
This guide therefore separates country performance comparisons from proof that one policy caused the result. They are two different research questions.
Missing data should not be treated as zero
Some countries have limited administrative systems or reporting capacity. Others may measure different groups or use surveys collected infrequently.
If a reliable figure is unavailable, the table should say not available, include the last valid year or describe the estimation method and uncertainty.
A missing figure is not evidence that a service does not exist. Nor should countries with more complete and candid reporting automatically look worse because they record more incidents or complaints.
The honesty of measurement is itself important context.
How to make a country comparison useful to parents and residents
People rarely need a ranking for its own sake. They need answers such as:
- Can my child access a school or an appropriately funded meal?
- How do I register for healthcare, and what might I pay?
- Is rural public transport available for a medical appointment?
- What happens if I move to another region or country?
- Which benefits exist, and how are decisions appealed?
- Who maintains essential infrastructure after the original construction?
- What happens when the public-service contractor fails?
The country guides answer the local institutional questions. The How Countries Work comparative series shows how a problem can be solved differently elsewhere.
A good article should help someone follow a real service from the rule to the result, rather than simply repeat a statistic.
A reusable eight-point comparison checklist
Before publishing any cross-country chart or claim, check:
- Same question: Are both countries being assessed for the same service and outcome?
- Same population: Does the denominator cover the same relevant people?
- Same definitions: Are eligibility, completion and outcome measures compatible?
- Comparable year: Do the reference periods match or is the difference explained?
- Comparable resources: Are prices, currencies and public-finance boundaries treated appropriately?
- Actual delivery: Is the indicator about a promise, an output or a verified outcome?
- Fairness: Do averages conceal groups or areas with materially worse access?
- Limitations and sources: Are uncertainty, missing values and methodological differences shown?
When one of these is missing, report a qualified comparison, not a definitive ranking.
How the 50-question series fits together
This series treats a country as a connected set of practical systems. Its articles cover access to services, responsibility between levels of government, national financing, work and pensions, healthcare, regional connections, environmental obligations, international trade, continuity and fair evaluation.
A few useful routes back into the series:
- How Countries Decide Which Public Services Residents Can Use — the legal eligibility starting point.
- How Countries Fund Public Services in Regions With Smaller Tax Bases — the distribution of public resources.
- How Countries Keep Services Available as Populations Shrink — changing needs and local service networks.
- Why the Same Policy Works Differently in Different Countries — the importance of context.
- How Countries Test a Policy Before Taking It Nationwide — gathering credible evidence before scaling.
The parent How Countries Work | A–Z Guide to 195 Countries and Everyday Life provides the country-by-country directory, allowing a reader to move between a national profile and a comparison of the specific system that interests them.
Frequently asked questions
### Which country has the best public services?
There is no single measurement covering every service, group and outcome. A useful comparison identifies the exact service and criteria before interpreting indicators.
### Is spending more always better?
No. Spending must be interpreted alongside costs, coverage, quality, outcomes and equity.
### Can an OECD or WHO ranking tell me whether I qualify for a service?
Not on its own. Eligibility depends on national law and individual circumstances, which summary indicators do not determine.
### Why do international data sometimes disagree?
Sources can use different definitions, years, population estimates or modelling methods. Check metadata before treating them as conflicting facts.
### Can comparisons still be useful when the countries are very different?
Yes. They can reveal different mechanisms and trade-offs, provided the context and limits of comparability are made explicit.
Official sources and methods
- OECD — Government at a Glance 2025.
- OECD — Structure, definitions and comparison limitations.
- OECD — Government expenditure measures and PPP comparison.
- WHO — Universal Health Coverage Service Coverage Index methodology.
- WHO — Universal health coverage factsheet, December 2025.
- WFP — State of School Feeding Worldwide, released September 2025.
- UK HM Treasury — Magenta Book, May 2026 update.
Evidence reviewed: 21 October 2026. Data series have their own dates, definitions and possible revisions; the illustrative table above is fictional.
Final takeaway
Fair country comparisons are not a contest to find one magic number. They are an evidence-based way to understand whether people who need a public service can obtain it, what it costs, who benefits and how reliably the service works.
The complete chain is same question → compatible data → honest context → actual outcomes → equity → uncertainty → useful lessons across countries.