
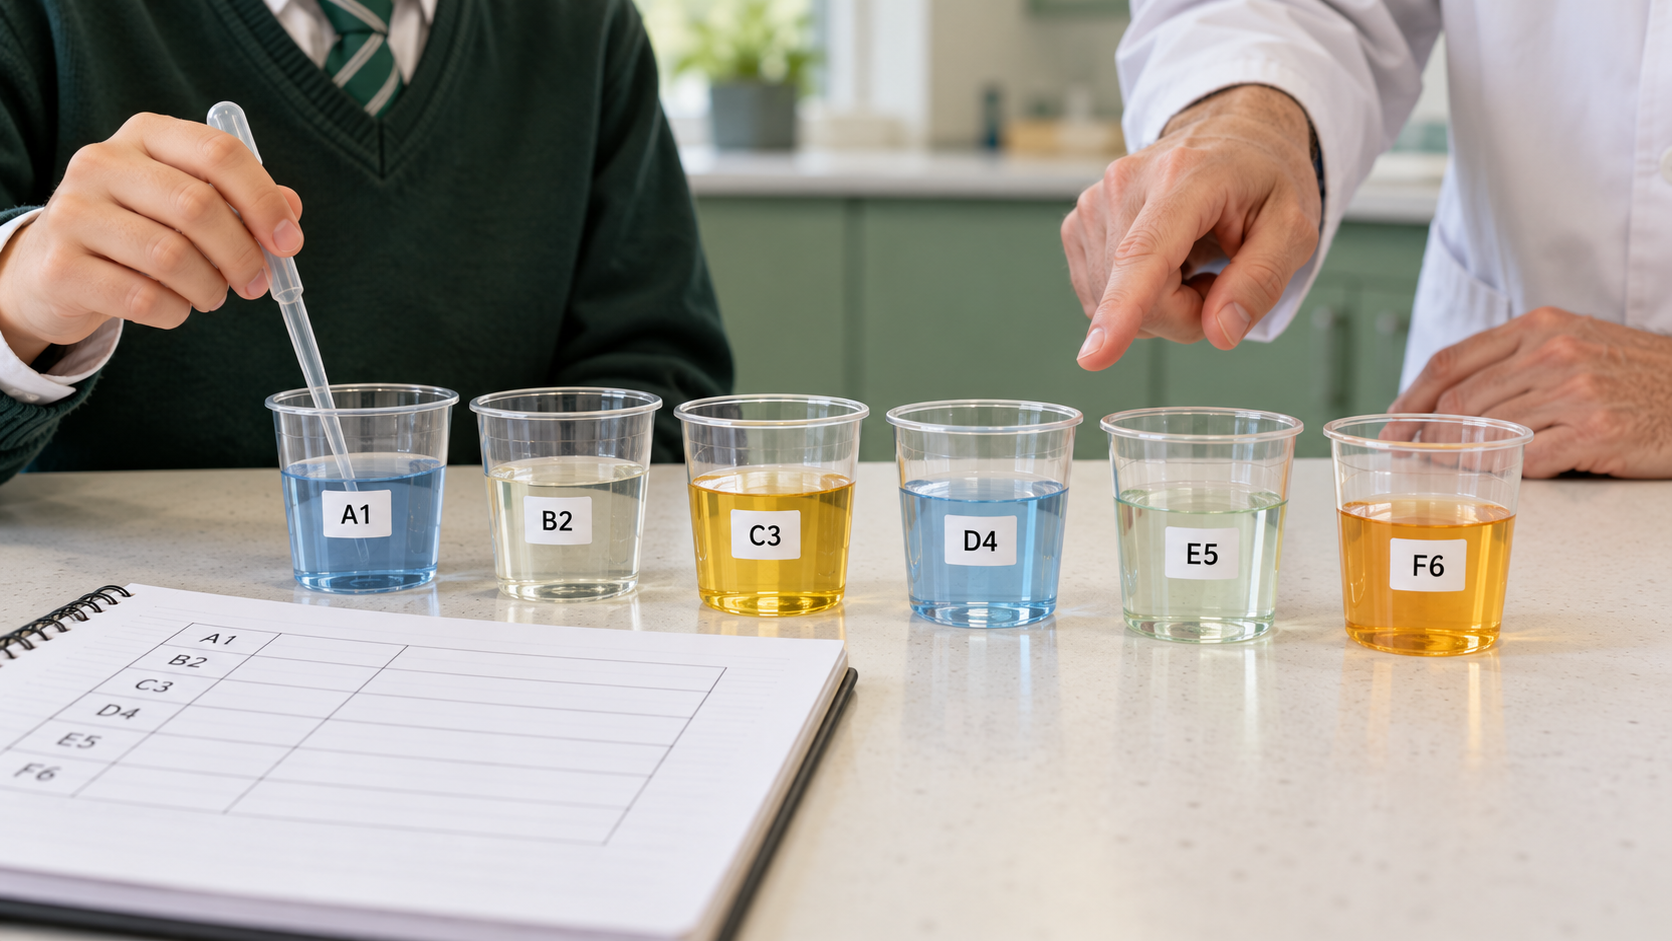
G2 Science experimental skills are tested even though the 2027 SEC G2 Combined Science examinations do not list a separate practical examination paper. In syllabuses K223, K224 and K225, SEAB expects students to read apparatus, interpret results, complete tables or graphs, evaluate methods and explain safe improvements. Experimental Skills and Investigations account for approximately 10% of the theory assessment objectives, so students who prepare only definitions and formulas are leaving an important part of their learning incomplete.
This guide explains what experimental questions can ask, how to separate observation from inference, how to identify variables, and how to deal with anomalies, scales, gradients and uncertainty. It includes original fictional data examples suitable for supervised school learning. It does not encourage unsupervised experiments using chemicals, electrical equipment, biological materials or dangerous apparatus.
- K223: Physics and Chemistry — component Papers 1, 2, 3 and 4.
- K224: Physics and Biology — component Papers 1, 2, 5 and 6.
- K225: Chemistry and Biology — component Papers 3, 4, 5 and 6.
- Assessment skills: Approximately 45% knowledge, 45% handling information and solving problems, and 10% experimental skills within theory.
- Practical-paper distinction: No separately listed hands-on practical examination under the 2027 combined-science scheme.
- Best study approach: Understand the investigation, read the data, make a justified conclusion and explain limitations.
What Does “Experimental Skills” Actually Mean?
An experimental question is not always about knowing the name of a laboratory instrument. It may provide an unfamiliar diagram, a table of observations or a description of a procedure and ask what can be concluded.
Students should be able to select suitable techniques, record and read measurements, present information clearly, interpret results and evaluate whether a method supports the question being investigated.
A student may recognise the word “thermometer” yet read the scale incorrectly. Another may plot every graph point correctly but make an unjustified claim about what caused the trend. These are different problems, and each needs its own practice.
The scientific core is to ask: What did we measure? Under what conditions? What do the measurements show? What remains uncertain?
What SEAB Explicitly Lists for 2027
The official K223/K224/K225 science syllabus describes Experimental Skills and Investigations under Assessment Objective C. It includes using techniques and apparatus, taking readings, evaluating data and methods, and suggesting improvements.
The syllabus also gives examples of theory-paper tasks, including:
- selecting an appropriate experimental technique or apparatus;
- drawing, completing or labelling diagrams;
- recording readings shown on instruments;
- completing tables and drawing or interpreting graphs;
- determining gradients, intercepts or intersections;
- identifying patterns and drawing justified conclusions;
- suggesting an appropriate modification to a method;
- identifying possible sources of error;
- commenting on safety and suitable precautions.
An unfamiliar apparatus may appear as the context for a question. However, SEAB says students will not be assessed on specialist knowledge of apparatus outside the syllabus merely because that apparatus is pictured. They may be assessed on general skills such as scale reading or data interpretation that the syllabus requires.
This is important for parents buying revision materials. Endless memorisation of obscure instrument names is not a substitute for data reasoning.
How the 2027 Combined Science Papers Are Organised
The combined-science syllabus has six component papers, of which each candidate takes four according to their combination.
For each of Physics, Chemistry and Biology, the multiple-choice component carries 20% and the structured component 30% of the chosen Combined Science qualification. A candidate therefore receives 50% from each selected science discipline.
The relevant component pair is taken in a 1 hour 15 minute session. Students are advised not to spend more than 30 minutes on the MCQ component of that pair.
The experimental skills assessed in theory can be expressed through either short objective questions or constructed explanations using supplied data. Prepare for both recognition and reasoning.
The Difference Between Observation and Inference
An observation is something recorded or directly provided: a temperature reading, a colour change, a measured distance or an instrument position.
An inference is a reasoned interpretation of that information. It may use scientific principles, but it still needs evidence.
Suppose an invented data table shows a sample temperature rising from 21°C to 28°C during an interval. The observation is a 7°C increase. A plausible explanation might involve energy transfer, but the table alone does not establish the exact energy source if the setup is not supplied.
A weak student writes “the heater was working perfectly” when the task reports only a temperature change. A stronger student states what the table shows and then applies the relevant principle only within the given conditions.
This distinction appears in Physics, Chemistry and Biology.
The Three Kinds of Variables
Understanding variables helps students design and evaluate investigations.
Independent Variable: What Is Deliberately Changed?
The independent variable is the factor the investigator deliberately varies to study a relationship. It might be duration, a prescribed condition or a selected quantity.
For example, in a fictional safe school investigation comparing how far a toy vehicle travels over different time intervals, the elapsed time may be the variable on the horizontal graph axis.
Dependent Variable: What Is Measured?
The dependent variable is the measured response that may change. In the vehicle example, it could be distance travelled.
Students must not confuse a measured response with a factor they deliberately changed. A question may state these in unfamiliar words, so focus on the experimental role instead of a memorised example.
Controlled Variables: What Is Kept Comparable?
Controlled variables are other conditions held appropriately constant to make a comparison meaningful. Their identity depends on the research question.
If one group uses a different vehicle, a different surface and a different timing method, the final distances cannot easily be attributed to one changed factor. A fair comparison requires attention to relevant alternative influences.
This is why the phrase “keep everything the same” is often too vague. State which condition should be kept comparable and why that condition matters.
Worked Example 1: A Fair-Test Investigation
Original fictional scenario: A class measures how distance travelled by a toy vehicle changes with elapsed time on a level surface. A teacher provides the equipment and safe procedures.
The planned relationship is between elapsed time and distance. The student should identify the method of measuring each, record the units and keep the relevant physical conditions comparable.
If a later trial changes both the surface and the toy vehicle’s mass, the effect of the time variable becomes harder to interpret. A good evaluation identifies the additional variables rather than merely writing “not a fair test”.
The correction would be a specific adjustment addressing the identified source of variation. A valid suggestion should say why it helps.
Reading Instruments: What Students Commonly Miss
A scale has a unit and a smallest interval that the student must recognise. Students may need to read a measuring cylinder, ruler, thermometer or other instrument described in the syllabus or question.
Before writing a reading, identify:
- what physical quantity is being measured;
- what unit the instrument uses;
- the interval between adjacent marked graduations;
- which point, meniscus or indicator is relevant to the instrument;
- the reasonable precision supported by that scale.
Do not claim more precision than the instrument warrants. Writing 24.000000°C from an instrument that cannot resolve such detail creates false confidence.
Where a reading depends on viewing position, incorrect eye alignment may produce parallax error. The appropriate precaution depends on the instrument and conditions.
Worked Example 2: Why Scale Intervals Matter
Original fictional diagram description: A thermometer has labelled marks at 20°C and 30°C, with five equal intervals between them. An indicator lies at the third small interval above 20°C.
Each interval represents (30 − 20) ÷ 5 = 2°C. The indicator therefore reads 26°C.
An incorrect answer of 23°C might come from assuming that every small interval equals one degree despite the printed scale.
The remedy is not simply “read carefully”. Teach students to calculate the value of one division before interpreting the instrument.
In the actual examination, the labelled diagram is the evidence. Do not impose a remembered graduation pattern from another instrument.
Recording Data: Tables Should Explain Themselves
A clear science table needs a title or contextual description, suitable column headings, units and consistent recording precision where appropriate.
If time is measured in seconds and distance in metres, label them as Time / s and Distance / m, or another unambiguous approved format.
A table of numbers without units can be almost meaningless. The values 5, 10 and 15 could represent seconds, grams, centimetres or any number of other quantities.
Rows should correspond to comparable trials or observations. Students should distinguish a measured value from a calculated value such as a mean, rate or percentage change.
Worked Example 3: A Distance-Time Table
Original fictional dataset:
| Time (s) | Distance (m) |
|---|---|
| 0 | 0 |
| 5 | 10 |
| 10 | 20 |
| 15 | 30 |
Distance increases by 10 m every 5 s, so the rate is 10 ÷ 5 = 2 metres per second.
A graph of distance against time would be a straight line through the origin for these idealised data. Its gradient represents speed in this context.
The student should not write “the acceleration is 2 m/s” because that confuses both the physical quantity and unit.
The correct interpretation depends on the axes. A speed–time graph uses a different relationship: its gradient concerns acceleration, not speed.
Graphs: Axis, Scale, Units and Meaning
Graphs are common because they compress many measurements into a visible pattern. They also create opportunities for mistakes.
Choose an appropriate horizontal axis for the independent variable and a vertical axis for the measured response, where the experiment warrants this convention.
Use a scale that makes the pattern readable without inventing or hiding data. Plot points accurately and follow the question’s instruction about best-fit lines, curves or joining data points.
A line’s slope is not a number to memorise. Gradient = change in vertical quantity ÷ change in horizontal quantity. Its units follow from the two axes.
A graph may be approximately linear without passing through the origin. The intercept can have a physical interpretation or reflect a limitation of the model. Do not force a zero intercept unless the evidence or model supports it.
Worked Example 4: Gradient and Physical Units
Using the previous fictional distance–time graph, choose the points (5 s, 10 m) and (15 s, 30 m).
The gradient is (30 − 10) m ÷ (15 − 5) s = 20 m ÷ 10 s = 2 m/s.
The numerator and denominator are differences, not the original coordinate values written without context.
If the plot were instead temperature against time, the same numerical calculation could yield degrees Celsius per second, not a speed. The physical meaning follows the graph labels.
A student who can calculate a gradient but cannot interpret its unit has learned arithmetic without the corresponding scientific reasoning.
What an Intercept Tells Us
An intercept is where a graph meets one of its axes. In a distance–time model, a nonzero vertical intercept might indicate a starting distance at time zero. In another graph, an intercept could reflect a background signal or an offset.
The exam may ask students to determine an intercept from plotted data. The correct method is to read the axis carefully, use the graph’s scale and interpret the numerical value in context.
Do not automatically describe every nonzero intercept as an experimental error. Some models deliberately include a starting quantity. Evaluate it against the actual system being represented.
Means, Repeats and Anomalies
Repeated measurements can help investigate variation. However, simply repeating an experiment does not guarantee correctness.
Consider three fictional measured times of 8.1 s, 8.3 s and 8.2 s. Their mean is 8.2 s. The small spread suggests reasonably consistent readings under those conditions.
Now suppose another set is 8.1 s, 8.2 s and 14.7 s. The third reading differs substantially. The learner should flag a possible anomaly and examine the method or record, rather than delete the value silently.
There may be a genuine reason for an unusual measurement. Anomalies are a prompt for investigation, not permission to manipulate data to obtain a preferred result.
Accuracy Versus Precision
Accuracy concerns closeness to an appropriate true or reference value. Precision concerns the consistency or resolution of measurements, depending on the context of the task.
A set of repeated measurements might be close together yet all shifted by a systematic calibration error. Such readings can be precise but inaccurate.
Conversely, measurements may scatter around a correct central value. A mean may be reasonable even though individual readings lack precision.
Students should be careful with broad statements like “the experiment is reliable because it was repeated.” Repetition can help explore random variation, but it does not automatically remove a systematic bias.
Worked Example 5: Percentage Change in a Biology Dataset
Original fictional school-lab dataset: A plant-tissue sample initially has a mass of 5.0 g and later has a mass of 5.6 g after a supervised treatment. Calculate the percentage change.
Change in mass is 5.6 − 5.0 = 0.6 g.
Percentage change is 0.6 ÷ 5.0 × 100 = 12% increase.
The reference amount is the initial mass, not the final mass. Using 5.6 g as the denominator would answer a different question.
If the setup concerns water movement across partially permeable membranes, the change may be interpreted using osmosis in the context supplied. But the two mass readings alone do not tell us the exact composition of the surrounding solution.
The observation must come first; the biological explanation must fit the full experimental conditions.
Worked Example 6: Reaction Data and Changing Rates
Original fictional Chemistry data: A teacher-supervised demonstration produces an observed gas volume at several times.
| Time (min) | Gas volume (cm³) |
|---|---|
| 0 | 0 |
| 1 | 12 |
| 2 | 22 |
| 3 | 30 |
| 4 | 36 |
The volume increases by 12 cm³ in the first minute, then 10, 8 and 6 cm³ in successive one-minute intervals.
The observed average production per minute decreases over the intervals. That is a description of a trend.
A more specific explanation of why the rate decreases depends on the reaction and conditions given in the question. Do not invent a reagent, temperature or concentration that the table does not identify.
Students can interpret graphs and rates without performing a hazardous home reaction. School-supervised examples and supplied data are sufficient for the reasoning exercise.
Worked Example 7: Selecting a Conclusion From Evidence
Imagine an original exercise with two sealed, safe classroom containers observed for an equal interval. The worksheet states that Sample A’s temperature changes by 6°C and Sample B’s by 2°C.
It is valid to conclude that the recorded temperature change of A is larger than B’s under the observations. It is not automatically valid to conclude that A received exactly three times as much thermal energy, because mass, specific heat capacity and other conditions are not provided.
This illustrates a principle that connects Physics and Chemistry: the same observed temperature change can correspond to different energy transfers when other variables differ.
A correct answer should be no stronger than the evidence and given scientific model allow.
Worked Example 8: Qualitative Observations
Some scientific data are descriptive rather than purely numerical. A reaction may produce a precipitate, a given indicator may change colour or a sample may display a particular appearance.
If a question provides an observation, students should reproduce it accurately and then interpret it using the specified scientific test.
A weak answer reads “a white precipitate forms” and writes “a yellow precipitate forms” because that matches a memorised example. Another weak response identifies a substance even though several substances could produce a similar observation.
Correct qualitative analysis depends on the full set of test conditions and results, not a single familiar word.
The same habit is useful in Biology when describing changes in tissues, colour tests or organism responses under supervised classroom conditions.
What Counts as a Valid Improvement?
A common exam command is “Suggest an improvement to the method.” Students often answer “repeat the experiment three times” without thinking about the actual weakness.
An improvement needs a problem and mechanism. If random timing variation is the issue, repeated trials and an appropriate summary may help. If the apparatus is miscalibrated, repetition of the same biased reading does not solve the underlying problem.
If the comparison was unfair because different sample sizes were used, standardising sample size may be more relevant. If a graph has an ambiguous scale, correcting the axis labels improves communication but does not repair a flawed experiment.
Students should phrase an improvement as: “Change X so that Y source of error is reduced or controlled.” This makes the scientific purpose visible.
Error Sources: Random and Systematic
A random error changes unpredictably across measurements and contributes to spread. A systematic error shifts measurements consistently because of an underlying bias or instrument problem.
A clock that consistently records every time one second too high produces a different issue from a human observer whose reaction time varies between trials.
Students do not need to assume every experimental problem can be eliminated. They should recognise what kind of evidence is needed to identify a cause.
A well-written evaluation is specific: “The readings could be affected by variation in reaction time when the stopwatch is operated manually” is more useful than a vague “human error”.
How to Describe an Experimental Trend Precisely
Words such as “increases”, “decreases”, “constant”, “approximately linear” and “levels off” describe different patterns.
If data rise from 10 to 20 to 30 in equal time intervals, a steady increase may be plausible. If they rise from 10 to 20 to 25, the increase continues but its incremental size changes.
A student should describe the direction and pattern, and quote values when useful. Avoid saying “increases exponentially” or “decreases linearly” unless the information actually supports that specific relationship.
Mathematical language is powerful when it is accurate. It becomes misleading when used as decoration.
Interpreting Correlation Without Claiming Causation
Suppose an invented dataset shows that two values rise together. That is a pattern, not necessarily proof that one causes the other.
There may be a third variable, a shared underlying process or a sampling problem. A well-controlled experiment can strengthen causal reasoning, but even then students should examine which factors were actually controlled.
Scientific reasoning includes asking what alternatives remain. It does not require indefinite indecision; it requires claims proportionate to the evidence.
This skill matters in real life when interpreting headlines about health, technology and the environment.
Experimental Safety: What a Written Guide Can and Cannot Do
The syllabus includes safety awareness and practical work, but the appropriate safety measures depend on the materials, apparatus and setting.
Students should follow teachers’ instructions and approved laboratory procedures. Do not independently perform experiments involving chemicals, flames, pressurised equipment, unfamiliar electrical arrangements, microbes or body fluids based on an online example.
For theory preparation, use diagrams, simulations approved by the school, teacher demonstrations and supplied datasets. These can teach experimental reasoning without an unsafe practical setup.
If a question asks for a safety measure, identify the actual hazard described, not a generic precaution unrelated to the situation.
The Different Emphases of Physics, Chemistry and Biology
Physics experimental questions may involve reading measurements, interpreting motion or electrical quantities, drawing graphs and connecting a gradient with a physical rate.
Chemistry experimental questions may involve mixtures, qualitative results, changes during reactions, separation processes and appropriate interpretation of data.
Biology experimental questions may involve observations of cells, movement of substances, food-test results or differences between biological samples under controlled conditions.
The general reasoning method is shared, but the disciplinary explanations differ. Do not apply a Physics formula when the Biology question asks about a membrane mechanism or a Chemistry test result.
The correct combined-science component is determined by whether the candidate takes K223, K224 or K225.
Common Experimental-Skills Mistakes
- Instrument error: reading the wrong graduation or recording a unit incorrectly.
- Variable error: confusing the factor changed with the result measured.
- Fair-test error: failing to recognise another condition that changed between trials.
- Table error: missing headings, units or consistent representation.
- Graph error: swapped axes, unsuitable scale, inaccurate points or wrong gradient unit.
- Calculation error: dividing a change by the wrong baseline or time interval.
- Anomaly error: deleting an unusual value without explanation.
- Inference error: claiming that the data prove something not actually established.
- Method improvement error: suggesting a generic action without identifying the source of error.
- Safety error: recommending a procedure inappropriate to the described hazard.
- Recall-only revision: memorising definitions but never practising unseen data.
The best correction targets the first step where understanding fails. A learner who plots well but explains poorly needs reasoning practice, not another graph-drawing worksheet.
The Fencing Method for Experimental Reasoning
Begin with one variable, one instrument and one clear relationship. Let the student identify what is measured, calculate a change and state what the observations show.
Then introduce a second trial, a new scale, an anomalous reading or a question about method suitability. Each added difficulty should test a particular skill.
Later, show a completely unfamiliar setup and require the learner to apply the same method without the tutor naming the answer.
This is eduKateSG’s Fencing Method: start within a bounded task, expand difficulty deliberately and check whether the skill transfers to new evidence.
A Four-Week Experimental-Skills Revision Plan
Week 1: Read and Record
Use a small set of safe instrument diagrams, tables and unit questions. Check whether the student reads scales accurately and labels quantities. Record recurring mistakes.
Week 2: Variables and Fair Comparisons
Use fictional experimental designs. Identify independent, dependent and controlled variables, and explain why an uncontrolled factor could weaken the conclusion.
Week 3: Graphs and Evidence
Plot small tables, find gradients with units, calculate simple changes and compare two possible conclusions. Ask which claim is actually supported and what evidence is missing.
Week 4: Method Evaluation and Transfer
Attempt mixed Physics, Chemistry and Biology experimental questions appropriate to the student’s registered combined subject. Explain one specific improvement and one safety consideration where applicable.
A four-week plan is a starting cycle, not a guarantee that all examination skills can be mastered without the learner’s foundation and school instruction.
What Parents and Tutors Can Do
Parents can ask a student to explain a graph, identify the measured quantity and distinguish a recorded fact from an assumption. The child does not need to perform a hazardous experiment at home to practise these skills.
A productive small-group session may begin with a diagnostic graph, correct one misread scale, compare two investigation designs and finish with an independent interpretation task.
In eduKateSG’s 3-pax learning model, each learner can be asked to explain what the data show. But tuition is not obligatory when school practicals, teacher feedback and independent work are effective.
The important objective is to make the student’s reasoning observable, not simply accumulate more practice papers.
Frequently Asked Questions
Is there a separate practical examination for K223, K224 or K225 in 2027?
The published combined-science scheme lists four theory component papers for each subject combination, with no separate hands-on practical paper. Experimental reasoning is still assessed.
How much of the assessment concerns experimental skills?
SEAB gives approximately 10% of the theory assessment objectives to Experimental Skills and Investigations.
Do all three G2 Science combinations test the same experimental skills?
They share the broad objective, but the scientific content depends on which two disciplines the student takes.
Are graphs examinable even without a practical paper?
Yes. The syllabus includes tables, plotting graphs and determining gradients, intercepts and intersections from graphical information.
Can an unfamiliar apparatus appear?
Yes, but SEAB says students will not be tested on specialist knowledge outside the syllabus merely because an unfamiliar apparatus is used as context. Required general data skills still apply.
Is “repeat the experiment three times” always a correct improvement?
No. The improvement must address the actual problem. Repeating a systematically biased measurement may not remove the bias.
Must an anomalous result be deleted?
No. First consider the possible cause and whether the dataset or question justifies any treatment of that result.
Are units important for graph gradients?
Yes. The units usually come from vertical-axis quantity divided by horizontal-axis quantity.
Can data alone prove a proposed cause?
Not always. Consider controlled variables, alternative explanations and whether the experimental design supports a causal conclusion.
Is a home chemistry experiment a good way to revise?
Students should follow school supervision and approved safety procedures. Do not perform hazardous unsupervised experiments based on online revision materials.
Official Sources and Further Reading
- SEAB 2027 G2 Science syllabus for K223, K224 and K225 — see printed pages 5–7 for Assessment Objective C and examination scheme.
- SEAB G2 school-candidate syllabus directory.
- How G2 Science (Physics, Chemistry) Works | SEC Guide.
- How G2 Science (Physics, Biology) Works | SEC Guide.
- How G2 Science (Chemistry, Biology) Works | SEC Guide.
- How G2 Mathematics Real-World Problem Solving Works | SEC Guide — useful for graphs, quantities and interpretation.
- The eduKateSG Clementi small-group tutorial reference.
Final Takeaway: The Best Scientific Answer Respects the Evidence
Experimental skills in G2 Science are about making observations useful. Students need to know what was measured, how conditions were controlled, what the results show and which explanation is justified.
For the 2027 combined-science SEC, these skills are tested within theory papers even without a separate practical examination. Careful graphs, meaningful units, honest conclusions and specific evaluation make scientific reasoning more reliable.
Examination facts checked against SEAB’s published 2027 G2 Science K223/K224/K225 syllabus on 12 November 2026. Every dataset above is fictional educational material, not a real experiment or predicted examination question.