
eduKate • Clarke Quay, Singapore • Secondary 1 Geography • River maps, conservation boundaries and independent reasoning
Choose your reading route
Quick answer: choose Secondary 1 Geography tuition when the child needs help reading a map or limiting a claim to evidence. A weekday may suit fresh schoolwork, while a weekend can help after long CCA days. Either must allow an unaided new question later.
First skill · Place boundaries · Worked scale · Footfall calculation · Timing

Contents
Fourteen Geography chapters — select the skill your child needs
1. Why the first Secondary 1 Geography skill is reading a source accurately
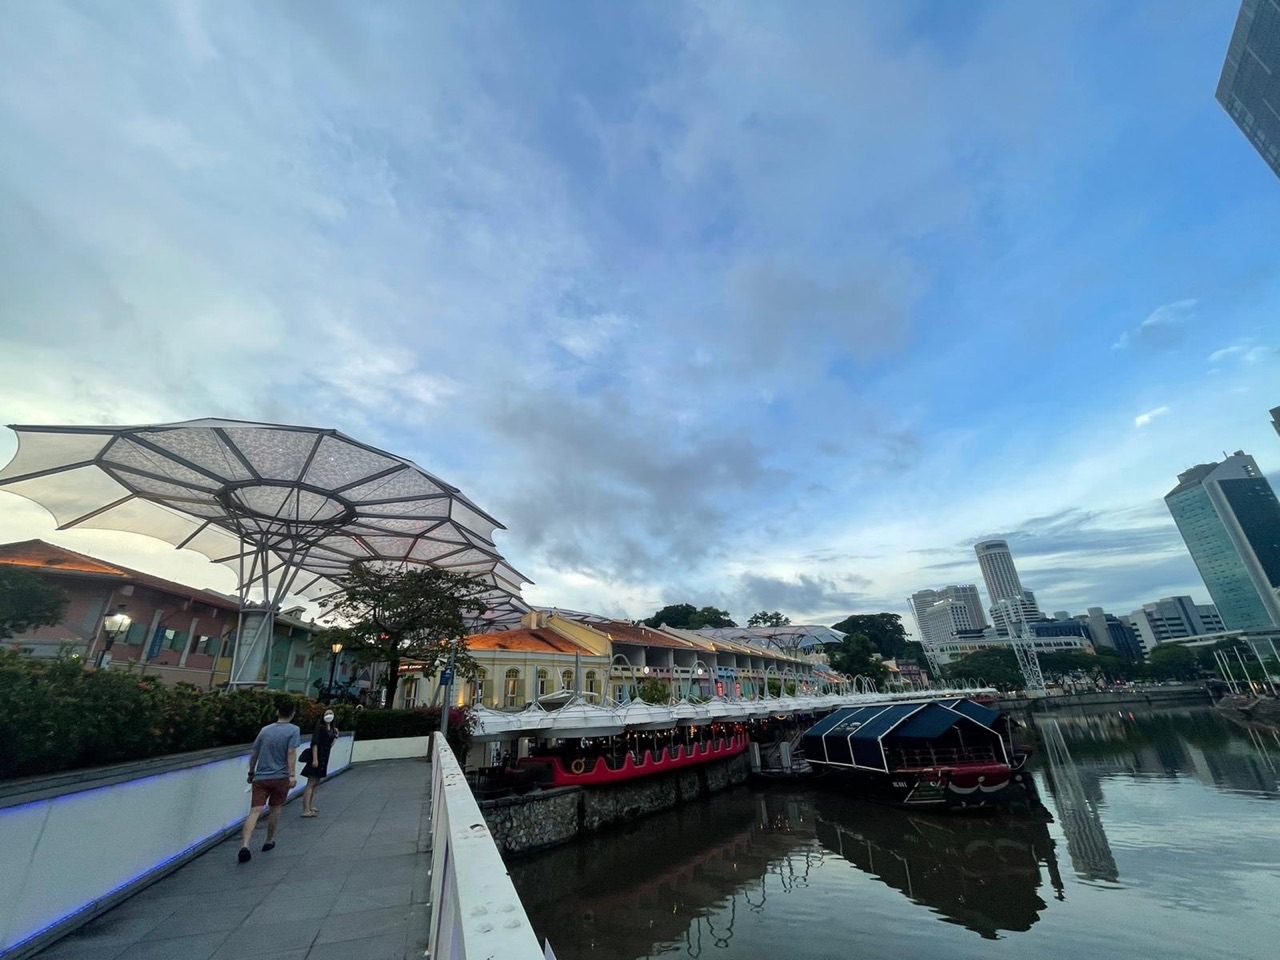
3. What a real Clarke Quay photograph shows—and what it cannot show
4. An original fictional riverside grid: compass directions before route claims
5. A centimetre on a drawing is not a guaranteed walking route
6. Historic bridges illustrate network links, not passenger or traffic volumes
7. A riverfront warehouse is not a complete history of today’s businesses
9. Invented riverside footfall: the largest count need not be the highest rate
10. Fictional frontage-density comparison: road length changes the denominator
11. Weekday or weekend Geography tuition: choose a time that leaves a second attempt
12. First Principles, the Fencing Method and three independent scripts
13. A four-week map-skills reset for parents to observe
14. Parent checklist, Clarke Quay Geography siblings and common questions
Why the first Secondary 1 Geography skill is reading a source accurately
Secondary 1 Geography tuition in Clarke Quay is useful when a child struggles to read a map, interpret a simple graph or keep an explanation within the information supplied. Recognising colourful riverside buildings does not mean a learner knows their spatial arrangement, function, dates or use. Parents can begin with one marked school question and ask which first step went wrong. A missing north arrow, a confused unit and an unsupported inference require different teaching responses.
A child moving from Primary 6 to Secondary 1 has to handle new geographical language. “Describe” asks what the evidence shows. “Explain” needs a relevant process. “Compare” requires a fair relationship between two measured things. A student who writes “Clarke Quay is the most crowded place because it looks lively in a photo” has added a population-wide claim that the photograph cannot establish. The first useful tutor intervention is to identify why that sentence outruns the source.
The MOE lower-secondary G2/G3 Geography syllabus provides subject context, but the student’s own school Humanities unit and assessment are the practical starting point. Some children need map orientation repaired; others can calculate but do not understand the denominator. A three-learner tutorial is valuable only if the teacher actually sees those individual differences. Completing the same worksheet at one table is not automatically personalised instruction.
Try a five-minute task: give the child an unfamiliar map with a legend and scale. Ask for two observable features, one comparison and one thing the map cannot prove. A learner who can say, “The river is drawn, but no water-quality test appears here,” is developing the discipline of source interpretation. That skill is more transferable than memorising several riverside attraction names.
Parents should ask for a second unseen question after the first lesson, with the model answer put away. The aim is an independent student who knows which evidence matters, can explain a reasonable conclusion and recognises the remaining uncertainty.
Clarke Quay, the Clarke Quay Conservation Area and the Singapore River are different spatial units
URA’s Clarke Quay Conservation Area record defines an area bounded by River Valley Road, North Boat Quay, Clarke Quay and Tan Tye Place, characterised by riverside warehouses and shophouses. URA’s Singapore River guidance uses a larger Singapore River planning geography, with Clarke Quay alongside other quays. The named quay, the protected area and the river corridor are related but not identical shapes or areas.
An introductory map lesson distinguishes a line representing a river, an area representing a conservation boundary and a point marking an entrance or bridge end. The same label can appear in conversation while meaning something different on a map. If a pupil sees one protected warehouse at Clarke Quay, it is wrong to conclude that every building along the entire Singapore River has the same conservation status.
The named bridges also provide a useful contrast. URA identifies Read Bridge, built in 1886–87, and Ord Bridge, built in 1886, as historic links between the quay and the south bank. A bridge is a link over the river, not a complete representation of the neighbouring neighbourhood. A learner should use map symbols and documented locations rather than guess the position of a bridge from a building photograph.
When a question asks about an area, the child needs a boundary. When it asks about a route, the child needs connections and distance information. When it asks about a building, the precise site matters. These distinctions help prevent overgeneralisation. A claim about a conserved block cannot automatically be applied to Boat Quay or Robertson Quay, whose official designations are separately documented.
Ask students to draw three simplified shapes: a blue curving line for the river, a shaded polygon for a hypothetical conservation area, and a small rectangle for a warehouse. Give each a different legend label and ask which statements belong to which. The skill transfers to parks, housing estates, river catchments and planning areas well beyond Clarke Quay.
What a real Clarke Quay photograph shows—and what it cannot show
The photograph above provides a useful visual introduction to Clarke Quay. A student can describe visible waterfront buildings, paths, river water and other features within the frame. However, the image is one viewpoint from one time, not a measured count of everyone using the area. It does not establish the condition of the whole river on other days or explain precisely why each person chose to visit.
Separate three kinds of statements. “Riverside buildings appear in the image” is a direct visual observation. “URA identifies conserved warehouses and shophouses at Clarke Quay” is a documented fact from an official conservation source. “All nearby businesses are profitable because people like the colours” is unsupported by both. The last claim would require a business study with appropriate measures and dates.
A useful child-friendly exercise has one pupil point to the source for each assertion. If the statement comes from the photograph, the child identifies the visible part. If it comes from an official history, they state the institution and date or scope. If no source supports it, they rewrite the sentence as a question: “What evidence would help us test whether the coloured buildings attract visitors?”
Photographs can also omit important aspects of a route. A visible footpath may not reveal accessible ramps beyond the frame; a calm-looking river surface does not establish water safety or pollution levels; and a bridge in a background view does not provide its precise walking distance. Geography asks students to notice this distinction rather than rely on a vivid image to answer every question.
The tutor should then show a different photo of an unfamiliar city district. If the child can still write an observation, a carefully labelled inference and a limitation independently, they have acquired a reading method instead of memorising one local scene.
An original fictional riverside grid: compass directions before route claims
Consider a fictional classroom grid that is not a real map of Clarke Quay. Columns A through E increase west to east, and rows 1 through 5 increase north to south. The north arrow points upwards. A library symbol sits at B3, a river-view point at D3 and an imaginary bridge entrance at B1. A park symbol is deliberately absent. The student must use the defined system, not memory of the actual quay.
| Invented feature | Grid location | Relationship to library B3 |
|---|---|---|
| Library | B3 | Reference point |
| River-view point | D3 | Two columns east |
| Bridge entrance | B1 | Two rows north |
| Unmarked park | Not shown | Cannot determine position |
If the child writes that the river-view point is east of the library, that is correct under these conventions. Saying “it is exactly 200 metres away” is not correct because the drawing supplies no scale. Saying “the bridge is safe and open all night” would also invent access information. The map key, north arrow and stated data determine which conclusions can be made.
Now rotate the north arrow so that the right edge of the page becomes north, without moving the visible symbols. Right on the paper no longer means east. A learner who checks the arrow can adapt, while one who repeats the first answer may simply have memorised page position. A small cut-out compass can help build understanding before the support is removed.
Change the legend so that a circle marks a landing, a square marks a building and a triangle marks a bridge. Give all three symbols the same colour. A child should use the shape and legend, not an intuition that anything blue must represent the river. Accurate symbols are the first language of a useful map.
The final check is an unseen grid with new coordinates and a different north arrow. Each child in a small group writes their own relative-direction statements. A confident classmate’s correct answer is not evidence that every learner can perform the task alone.
A centimetre on a drawing is not a guaranteed walking route
Suppose a new fictional Clarke Quay-themed map has a scale of 1:5,000. One centimetre on the map represents 5,000 centimetres, equivalent to 50 metres, on the ground. Two invented landmarks are 2.8 centimetres apart. Multiplying 2.8 by 5,000 gives 14,000 centimetres, or 140 metres of represented straight-line ground separation. This is a map problem, not an actual measured distance between local landmarks.
| Fictional measurement | Working | Valid conclusion |
|---|---|---|
| 2.8 cm at 1:5,000 | 2.8 × 5,000 ÷ 100 | 140 m represented straight-line distance |
| 3.6 cm at 1:5,000 | 3.6 × 5,000 ÷ 100 | 180 m represented straight-line distance |
| Difference | 180 − 140 | 40 m difference |
| Walking time | No walking speed or usable route | Cannot be calculated |
Two mistakes often occur separately. A pupil may report 14,000 metres, forgetting that the multiplication still yields centimetres. Or the pupil may convert correctly to 140 metres but assume that is the shortest accessible riverside route. Actual journeys follow paths, bridges, crossings and entrances, not necessarily straight ruler lines across water or built blocks.
The teacher should model both the arithmetic and its geographical interpretation. Write centimetres at the multiplication stage and metres after conversion. Then ask what additional source would establish walking distance between real places. A current detailed pedestrian map, access information and exact endpoints would be relevant; the invented paper measurement would not.
For transfer, change the scale to 1:2,000 and the paper distance to 3.4 centimetres. The correct represented separation is 68 metres. Let the pupil solve it without the previous working in view and explain why an actual route may be longer. A correct number with a limitation is stronger than a bare answer copied from a template.
A riverside setting makes the distinction memorable because water can separate places that appear close on paper. A straight line drawn across a river is not necessarily a route. But the lesson should remain a source skill, not an unverified visitor instruction about Clarke Quay.
Historic bridges illustrate network links, not passenger or traffic volumes
URA’s Clarke Quay history names Ord Bridge, dated 1886, and Read Bridge, dated 1886–87, as conserved crossings linking the quay to the opposite side of the Singapore River. For Secondary 1 Geography, a bridge can be introduced as a link in a movement network, while destinations on either bank are nodes. The presence of a link says that a connection exists; it does not tell us how many people use it today.
An imagined network may offer three routes from A to D. Route A–B–D has two segments of 65 and 85 metres. Route A–C–D has segments of 40 and 125 metres. Route A–E–D has segments of 100 and 80 metres. Ask which represented route is shortest. Students should add all segments rather than select whichever line looks straightest on a sketch.
| Imaginary route | Segment lengths | Total |
|---|---|---|
| A–B–D | 65 + 85 m | 150 m |
| A–C–D | 40 + 125 m | 165 m |
| A–E–D | 100 + 80 m | 180 m |
Under the fictional assumptions, A–B–D is shortest by distance. It is not automatically the fastest real journey: waiting at crossings, slopes, accessibility and other conditions are absent. Nor should the child convert the existence of two conserved bridges into a statement about the busiest crossing. That requires defined pedestrian observations at comparable times.
Change the second segment of A–B–D to 125 metres. That route now totals 190 metres and A–C–D at 165 metres becomes shorter. The student must revise their conclusion because the data changed. That willingness is a sign of real map reasoning, not inconsistency.
In a small group, one learner sums lengths, another checks whether all routes reach the same endpoints and a third challenges any unsupported time claim. Rotate these roles. Then give each student an individual route problem to complete.
A riverfront warehouse is not a complete history of today’s businesses
Clarke Quay’s older role is documented in URA’s conservation history: warehouses and shophouses supported trade along the Singapore River. The River House, built in the 1880s, is described by URA as a former Teochew merchant residence later used as a godown for commodities including gambier and biscuits. That provides evidence of different uses for a particular building over time, not evidence that every riverside property had an identical history.
A child can compare a warehouse symbol and a restaurant symbol on two fictional dated maps. If the same parcel changes from storage to dining use, the maps show a change of category. To establish why it happened, we would need records of planning, demand or individual decisions. A child’s answer that the building “became a restaurant because tourists are happier” invents both cause and measured feeling.
The current URA Singapore River urban-design guidance identifies conserved warehouses and a mixture of commercial, hotel and residential uses within the Clarke Quay subzone. A pupil should recognise that “Clarke Quay” is not simply another word for nightlife. Different kinds of land use can occupy adjacent parts of a district, and a single photograph cannot provide a complete classification.
The historical example also teaches the difference between physical retention and continuity of occupation. An older facade may remain visible after the activity inside changes. Conservation status therefore does not automatically mean the same goods are still stored there or the original trader still operates. Those are independent historical or economic questions.
The lesson should end by asking what a building-source fact supports, and what it leaves unknown. Secondary 1 learners who master this distinction will be better prepared to compare urban change across several time periods next year.
The Singapore River clean-up is a dated project, not a water-quality measurement from a photograph
PUB’s official water-history material records the Singapore River clean-up launched in 1977 and completed on 2 September 1987. That is a documented environmental programme involving pollution-source controls and infrastructure, not a simple claim about the colour of the water in every present-day photo. A student should keep a project’s dates and objectives separate from measured water quality at a particular location and moment.
The fact that a river surface looks calm does not prove it has high dissolved oxygen, safe swimming conditions or no pollutants. Appropriate water-quality testing requires defined variables, methods and sampling locations. At Secondary 1, the student need only learn the difference between seeing a photograph and possessing scientific measurement. There is no need to undertake actual unsupervised river sampling.
Try giving learners two cards. One is labelled “PUB clean-up completed in 1987”; the other is a fictional photo of a calm river surface. The first documents an event in environmental management, while the second shows visible conditions in the image. Neither can be used as an automatic substitute for a current laboratory report. The student should explain this in simple language.
A Geography answer can still propose a plausible relationship: controlling pollution sources may improve river conditions. But the scale, timing and amount of improvement require appropriate evidence. The child should avoid treating that reasonable mechanism as a measured figure if no data have been supplied.
This example establishes source discipline for later physical Geography questions, where rainfall, water quality, river processes and land-use impacts are examined in more detail.
Invented riverside footfall: the largest count need not be the highest rate
The following is an entirely fictional classroom table, not a real survey of Clarke Quay pedestrians. Three imagined points A, B and C are sampled for different durations. A has 36 crossings in 15 minutes, B has 52 in 20 minutes and C has 27 in 10 minutes. The question asks for crossings per ten minutes, so a fair comparison must standardise the observation windows.
| Imagined point | Crossings | Observation time | Crossings per 10 min |
|---|---|---|---|
| A | 36 | 15 min | 24 |
| B | 52 | 20 min | 26 |
| C | 27 | 10 min | 27 |
Point B has the largest raw count, but C has the highest rate per ten minutes. A’s standardised rate is 36 ÷ 15 × 10 = 24. B’s is 52 ÷ 20 × 10 = 26. C already has 27 in ten minutes. Ranking raw numbers would answer a different question from ranking rates.
The table measures crossings, not unique people. Nor does it reveal whether those crossing are residents, workers, visitors or repeat passes by the same person. A correct calculation followed by “27 tourists visit C every ten minutes” would invent the purpose of travel. Students need to define the variable before interpreting a number.
To discuss whether one path is “most crowded”, additional information would be required about width, space occupied and time-specific conditions. A high crossing rate does not automatically mean a high density of people standing in the same area. Those variables deserve different measurements.
For transfer, increase B to 60 fictional crossings in 20 minutes. Its rate becomes 30 per ten minutes and B takes the lead. Ask the child to adjust their conclusion without seeing the original solution. The change shows that the method, rather than the table order, has been learnt.
Fictional frontage-density comparison: road length changes the denominator
A second invented exercise considers five imaginary marked frontages along a short riverside section and eight along a longer one. The number of frontage marks alone is not enough to rank the density fairly. A useful comparison divides the count by the length of each sampled segment and uses a common unit such as features per hundred metres.
| Fictional section | Marked frontages | Road length | Features per 100 m |
|---|---|---|---|
| A | 8 | 400 m | 2 |
| B | 5 | 100 m | 5 |
| C | 6 | 300 m | 2 |
Although A has more total marks, B has the highest feature density per 100 metres in the fictional worksheet. A student who picks A because eight is larger than five has ignored the denominator. The correct answer should specify the count, route length and unit of comparison.
Now ask what one mark represents. A shop entrance? A separate building? A restaurant business? These are not interchangeable, especially where a building might have multiple entrances or uses. A reliable observation rule should be applied to all three sections; otherwise even correct arithmetic is applied to inconsistent categories.
Shorten section C to 120 metres while keeping its six marks. Its new rate becomes five per hundred metres, tying B. The tutor should let the student solve independently and explain why a changed length altered the ranking without changing the feature count.
All these numbers are invented, not collected from Clarke Quay. Their purpose is to teach how a spatial measure is constructed. The skill transfers to settlement density, facilities, vegetation and other mapped patterns without fabricating real statistics about the neighbourhood.
Weekday or weekend Geography tuition: choose a time that leaves a second attempt
The parent dilemma is practical. A weekday Geography lesson may repair a fresh map-reading error quickly, provided the child is still attentive after school and CCA. A weekend class may allow more rested discussion, but can also collide with family activities and remove recovery time. Neither day has a universal academic advantage; what matters is alert teaching and a later independent transfer task.
| Situation | Possible weekday fit | Possible weekend fit | Check after two lessons |
|---|---|---|---|
| Marked map just returned | Prompt correction | Unhurried review | New diagram interpreted accurately |
| Late CCA | Avoid that evening | Potentially better energy | Independent work still precise |
| Busy weekend | Protects family time | Only with real free space | Follow-up completed |
| Good with teacher, lost later | Next-day retrieval | Midweek retrieval | Method retained without help |
A complete learning cycle begins with diagnosis, then a clear explanation, guided practice, independent application and retrieval after a delay. If a class ends with an impressive model answer but the child never attempts a new question alone, the family cannot know whether the method has become secure. A ten-minute unseen map task can be a more meaningful check than many copied examples.
Parents can compare two similar questions during an ordinary school afternoon and a more rested period over a couple of weeks. Observe fatigue, error patterns and whether the student can explain their work. One trial does not determine a permanent learning style, but repeated scheduling conflicts or exhaustion should inform the class choice.
Travel matters as well. A Clarke Quay-themed article does not mean eduKate operates a teaching room in the quay. Confirm the actual teacher, venue, group size and fees before estimating a commute or deciding that a weekday is convenient.
If the child already reads unfamiliar Geography sources accurately and independently, adding another class may be unnecessary. A good consultation should identify a genuine need instead of assuming that every Secondary 1 pupil must have tuition.
First Principles, the Fencing Method and three independent scripts
First Principles teaching begins with the earliest unstable step. If a pupil cannot read a north arrow, the tutor should not race ahead to a complicated urban evaluation. If the child can calculate but confuses a rate with a total, an interpretation exercise is needed rather than another multiplication drill. A small group helps when the teacher watches each student’s reasoning and adjusts the explanation accordingly.
The Fencing Method keeps an answer within the question and available data. Identify the source’s boundary, date and variable; make a fair calculation or description; explain a geographical process only as far as the evidence allows; and state an uncertainty when necessary. A Clarke Quay river photo cannot show a current water-pollution statistic, and an old warehouse history cannot establish every present business activity.
- Identify the question verb and the correct source.
- Read the compass, legend, scale and geographical boundary.
- Check units and denominators in every comparison.
- Separate what is observed from a plausible explanation.
- Do not turn an unmeasured result into a confident fact.
- Complete a fresh task without the model after guidance.
In a group of three, one child may check the map, another the calculations and a third challenge the final claim. Rotate roles so everyone must perform each part, then ask every student to write a new answer alone. A lively conversation led by the strongest student is not proof of shared mastery.
A useful progress note says that a pupil now converts scale correctly and qualifies a claim about walking distance, or now checks a time denominator before comparing movement. Those are observable behaviours. “We completed several chapters” is less informative without an independent transfer question.
Parents should confirm that a true three-learner group applies to the proposed class, which tutor handles Geography and how independent work is marked. The Clementi three-learner Maths reference illustrates a teaching method, not proof of a current Clarke Quay Geography vacancy.
A four-week map-skills reset for parents to observe
A month provides time to test whether one or two repeated errors become less frequent, without promising a grade improvement by a fixed date. Begin with a real marked school question and identify the exact weakness. Week one repairs symbols and directional language. Week two tackles ratio scales and route interpretation. Week three compares rates or mapped density. Week four asks the child to solve a combined unseen problem using a different place.
| Week | Focus | Independent evidence |
|---|---|---|
| 1 | Direction, key and spatial unit | New map interpreted accurately |
| 2 | Scale, centimetres and route limits | Correct new conversion with qualification |
| 3 | Footfall rates and frontage density | Fair denominator comparison |
| 4 | Unfamiliar river or town map | Explanation without prompts |
Keep an error log concise and practical: north arrow ignored, wrong unit, raw count compared across unequal times, or a picture used as evidence of water quality. These are specific behaviours that teaching can address. Calling a child careless or weak in Geography does not identify a method to practise.
A parent can help by asking two short questions: “Where does the source show that?” and “What else would you need to know?” Let the learner point to the map, read its legend and form the reply. The child should gradually rely less on adult prompts, and the timetable should allow sleep, schoolwork and family activities to continue.
If the student is still exhausted or repeating the same errors after four weeks, review the teaching sequence and lesson time rather than simply adding more worksheets. If the method is secure, consider whether continued tuition is still necessary.
The result we want is a learner who can independently approach a new geographical diagram and justify what it shows. That achievement is more enduring than a memorised account of one interesting quay.
Parent checklist, Clarke Quay Geography siblings and common questions
- Confirm the child’s actual Secondary 1 Geography or Humanities school unit.
- Bring one marked map, graph or source answer and its teacher feedback.
- Ask for a fresh task without hints after guided correction.
- Check weekday/weekend travel, CCA, sleep and return-practice capacity.
- Verify current tutor, class size, fees and actual teaching venue.
- Keep classroom distance and count tables clearly labelled fictional.
- Value independent accuracy rather than a promised grade.
Does Clarke Quay mean the whole Singapore River? No. URA defines a specific Clarke Quay Conservation Area and a larger Singapore River planning context. Use the source’s boundary.
Do 1880s buildings prove current business activity is unchanged? No. River House has documented changes in use, and a conserved facade does not establish the current occupant or economic outcome.
Was the river clean-up completed in 1977? No. PUB records its launch in 1977 and completion on 2 September 1987. These are different events.
Are the grid, route and footfall examples real Clarke Quay surveys? No. They are fictional classroom exercises, not observed movement or street measurements.
Is weekend tuition always more effective? No. Choose the day that supports attention, feedback, an independent new question and enough rest.
The other learning stages are Secondary 2 Clarke Quay Geography for riverfront change, Secondary 3 for enquiry and sampling, and Secondary 4 for examination evaluation.
Verified reading: URA Clarke Quay Conservation Area · URA Singapore River guidelines · URA River House · PUB Singapore River clean-up history · MOE lower-secondary Geography. All invented numerical tasks are clearly classroom material. School fieldwork must follow appropriate supervision and safe, lawful access.
Parents may contact eduKate Singapore with their child’s school course, a marked question and realistic weekday or weekend windows. Confirm the actual teaching group, tutor, location and fees. No Clarke Quay branch or grade is guaranteed. Properly taught kids shine a bright light into the future.