

Secondary 3 G2 Mathematics Tutor Bukit Timah | Pictograms, Pie Charts and Dot Plots: Reading Data. Did you know? A pie angle measures a share of 360°, a pictogram icon represents a number from its key, and each dot in a dot plot represents one observation.
Secondary 3 G2 Mathematics learners in Bukit Timah can become more confident reading statistical data by first identifying what each display means. This guide gives quick pictogram, pie-chart and dot-plot examples with clear arithmetic and checking habits.
The official 2027 SEC G2 Mathematics K210 syllabus lists these displays in S1 Data Handling and Analysis. They are not the same as the underlined cumulative-frequency and box-plot topics designated for Paper 2 Section B.
Quick answer: how to read these three charts
- Pictogram: convert pictures into counts using the stated key
- Pie chart: use sector angle divided by 360° to find a fraction
- Dot plot: count individual dots at each numerical position
- Check the sum of all category counts or all sector angles
- Read labels, units and the total sample size before interpreting results
- Avoid claims about causes that the data alone cannot support
Jump to the data-reading question
- What can three different charts tell us?
- A pictogram needs a key
- Worked pictogram example: three activities
- A pictogram shows results, not causes
- A full pie chart is three hundred and sixty degrees
- Worked pie chart: seventy-two students
- Find a count from a sector angle
- Recover the total from a part
- Pie angles and percentages are different units
- Two identical-looking pie charts may hide different totals
- Dot plots keep the recorded observations visible
- Find mean, median, mode and range from the dots
- An extreme observation can alter the mean
- Same centre does not mean same spread
- Dot plots, histograms and bar charts are not interchangeable
- Misleading charts can contain correct numbers
- Read the axes and legend before drawing conclusions
- A short three-question self-check
- A one-week data-reading practice plan
- How small-group tutoring should identify the first error
What can three different charts tell us?
Did you know? The same observations can appear in a pictogram, pie chart and dot plot, yet each helps answer a different type of question. The key of a pictogram turns icons into counts, a pie chart shows fractions of a whole, and a dot plot preserves individual numerical observations.
The 2027 SEC G2 Mathematics K210 S1 syllabus lists all three statistical displays, alongside other tables and graphs and the skill of identifying misleading statistical representations.
The first question should always be: ‘What does one symbol, slice or dot represent?’ A Secondary 3 G2 learner who understands that meaning can avoid many errors before reaching for a calculator.
A pictogram needs a key
Imagine a school activity pictogram where one complete icon means six pupils. A category with three such icons represents eighteen pupils, not three. The key converts pictures into data.
If another category contains one and a half icons, it represents nine pupils under the stated key. A half-icon represents half of six, which is three pupils, not half a person.
Ask the learner to rewrite the pictogram as a frequency table. It forces each count to be checked against the key and makes later percentage calculations much easier.
Worked pictogram example: three activities
Suppose thirty-six fictional pupils each choose one favourite activity. Reading has three symbols, sport two and music one, with one symbol representing six pupils.
The counts are reading 18, sport 12 and music 6. Check: 18 + 12 + 6 = 36. Reading is half the class, sport is one-third and music one-sixth.
The chart is meaningful only if the categories and denominator are clear. If each person could choose multiple activities, adding response counts might exceed the number of pupils.
A pictogram shows results, not causes
Even if a pictogram indicates that eighteen pupils selected reading, it cannot by itself show why they chose it or prove that reading causes higher test scores.
A small class sample also cannot automatically describe every student in Singapore. Claims about the wider population need evidence about how the sample was collected and whether it is representative.
Good chart reading means stating what the data directly support, then acknowledging which stories would require more information.
A full pie chart is three hundred and sixty degrees
A circle represents a whole, so 100% corresponds to 360°. One-quarter of a whole is 90°, half is 180°, and one-eighth is 45°.
The central angle of a category is its fraction of the total multiplied by 360°. Students should not mistake the angle’s numerical value for the number of people in the category.
A pie chart is best suited to mutually exclusive parts of one clearly defined total. It can be misleading if its categories overlap without a special explanation of what the whole represents.
Worked pie chart: seventy-two students
Suppose an invented survey of seventy-two students records exclusive preferences: 24 choose mathematics games, 30 choose sport, and 18 choose music.
The mathematics-games sector is 24/72 × 360° = 120°. Sport is 30/72 × 360° = 150°. Music is 18/72 × 360° = 90°. The angles sum to 360°.
That last check is important. If sector angles do not sum to one full circle under exact calculation, the table has been copied incorrectly or an arithmetic step has failed.
Find a count from a sector angle
Imagine a pie chart for eighty students. A category has a central angle of 90°. Its fraction is 90/360 = 1/4, so its count is 1/4 × 80 = 20 students.
Writing ninety students would confuse degrees with people. The angle describes a proportion, which must then be applied to the given total.
Ask the student to state the fraction first. ‘One-quarter of eighty’ is easier to interpret and check than a series of unexplained calculator inputs.
Recover the total from a part
A fictional category has twelve pupils and occupies a 72° slice. Since 72/360 = 1/5, those twelve pupils are one-fifth of the full group.
Divide twelve by one-fifth to get 60 pupils in total. Verify the result: 12/60 × 360° = 72°.
This is the reverse of finding a part from a whole. A tutor should ask which number is supplied, which is unknown and whether multiplication or division reconstructs the total.
Pie angles and percentages are different units
A 45° slice is 45/360 = 1/8 of a circle, equal to 12.5%. A 150° slice is 150/360 = 5/12, equal to approximately 41.7%.
A category taking 25% of the responses should have sector angle 0.25 × 360° = 90°. You cannot simply write 25°.
Make a two-column table of ‘angle’ and ‘percentage’ for several slices. The visual comparison reinforces the meaning of both measures.
Two identical-looking pie charts may hide different totals
Thirty per cent of twenty people is six people, while thirty per cent of two hundred is sixty. The matching 30% sectors can look identical even though their counts are ten times apart.
Before comparing quantities across two charts, identify each chart’s sample size. Equal percentages do not mean equal absolute frequencies.
A chart without a total can support a proportion comparison but may not supply enough information to recover the number of respondents.
Dot plots keep the recorded observations visible
Consider seven numerical observations 2, 2, 3, 4, 4, 4 and 5. A dot plot has two dots stacked above 2, one above 3, three above 4 and one above 5.
The horizontal position tells you the observed value; the number of dots at that position tells you how often it occurs. There must be seven dots in total.
Unlike a histogram with grouped intervals, a small dot plot retains exact listed values. This makes it useful for exploring modes, medians, extreme observations and range.
Find mean, median, mode and range from the dots
For the observations 2, 2, 3, 4, 4, 4 and 5, the sum is 24. The mean is 24/7, about 3.43 to three significant figures.
The fourth observation of the sorted seven is 4, so the median is 4. Value 4 occurs most frequently, so the mode is 4. The range is 5 − 2 = 3.
A child who reads the tallest stack’s height as ‘the average is three’ has confused a frequency with a value. Ask for the definition of each statistical measure before calculating.
An extreme observation can alter the mean
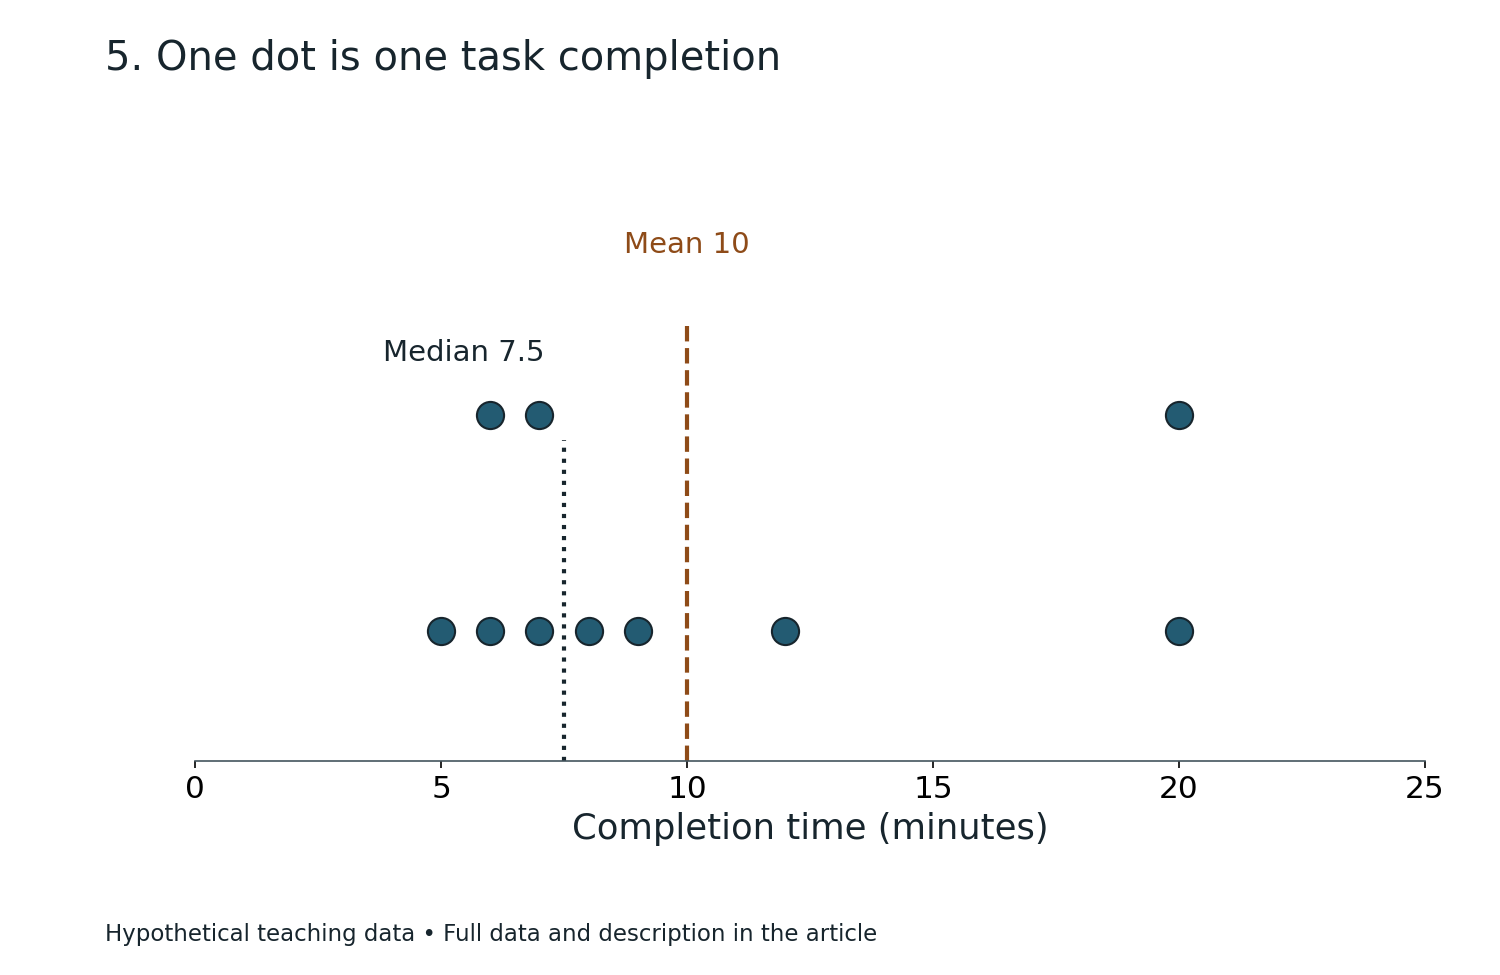
Replace the last 5 in the seven-value list with 20. The new observations are 2, 2, 3, 4, 4, 4 and 20, with total 39 and mean 39/7 ≈ 5.57.
The median is still 4 and the mode remains 4. The unusually large final value changes the mean much more than the middle ordered position.
A dot plot makes that high outlying observation visible. The exercise shows why a single summary number is rarely a complete description of a distribution.
Same centre does not mean same spread
Dataset A is 1, 2, 2, 3. Its mean is 2 and range is 2. Dataset B is 0, 2, 2, 4. Its mean is also 2, but its range is 4.
The second dataset is more spread out even though the arithmetic means match. Sketch both on the same number-line scale to see the difference.
This supports later G2 work on comparing distributions using measures of spread. An appropriate data interpretation should say which measure supports the conclusion.
Dot plots, histograms and bar charts are not interchangeable
Dot plots place repeated individual numerical observations at their exact values. Histograms summarise how many observations fall within adjoining numerical intervals. Bar charts commonly compare separate categories.
For example, a bar chart might compare bus, walk and train preferences, while a histogram might display durations from 0 to under 10 minutes, 10 to under 20, and so forth.
A learner should choose the graph based on what information matters, rather than using whichever display they have most recently drawn.
Misleading charts can contain correct numbers
A three-dimensional pie chart can visually enlarge sectors near the front. A pictogram can exaggerate a category if its icon is drawn twice as tall and twice as wide, creating four times the visual area.
A dot plot with missing numerical labels can hide whether each tick represents one unit or ten. These are visual design issues that may change a reader’s impression without changing the underlying counts.
SEAB K210 explicitly includes explaining why a statistical display may mislead. Ask what is shown, what is omitted and whether the proportions are visually fair.
Read the axes and legend before drawing conclusions
On a pictogram, a full icon may stand for four, six or ten observations; never infer the meaning from the appearance alone. On a dot plot, the horizontal scale must be read from the printed numbers.
A pie chart needs a clear definition of the whole and categories. When respondents could choose several answers, a simple pie of people may no longer represent the question as intended.
A reliable quick scan checks title, key, horizontal or vertical labels, units, total sample size and whether categories are mutually exclusive.
A short three-question self-check
Question A: one pictogram icon means six pupils. How many do two and a half icons represent? Answer fifteen. Question B: a 90° pie sector represents what count from eighty pupils? Answer twenty.
Question C: for 2, 2, 3, 4, 4, 4 and 5, give the median, mode and range. Answers: four, four and three.
Try the questions without looking at the explanations. The tutor can change the pictogram key, sample total or dot values for a later independent retest.
A one-week data-reading practice plan
Day 1: interpret pictogram keys including partial symbols. Day 2: convert pictograms into frequency tables. Day 3: construct pie-sector angles from a table. Day 4: find a missing count or total using a sector angle.
Day 5: construct a dot plot and calculate centre and range. Day 6: compare two plots with the same mean but different variation. Day 7: identify misleading displays and complete a short mixed review.
The suggested sequence is adjustable. Follow the student’s current school tasks and slow down if the key, sample-size meaning or frequency notation is not yet secure.
How small-group tutoring should identify the first error
Ask the pupil to interpret a pictogram, pie chart and dot plot independently. One learner may misread the icon key, another confuse degrees with percentages, and another mistake dot-stack height for the observed value.
A suitably matched three-pupil tutorial can provide specific feedback for those different misunderstandings. The useful evidence is a later fresh question completed without following the tutor’s steps.
The unchanged eduKateSG reference describes small-group Mathematics support near Sixth Avenue. Families should confirm Secondary 3 G2 group availability, teacher, fees, venue and timetable directly.
Frequently asked questions
Are pictograms, pie charts and dot diagrams in 2027 SEC G2 Maths?
Yes. They appear in the official K210 S1 data-handling topic, alongside other statistical representations.
Does a 45-degree pie slice mean forty-five per cent?
No. The proportion is 45/360 = 12.5%.
How do half-icons work in pictograms?
A half-icon represents half the value assigned to a full icon, provided the key and chart use that convention.
Why is a dot plot useful?
It preserves individual observed numerical values and their frequencies, making mode, median and unusual values easier to see.
Can equal pie-sector percentages represent different numbers?
Yes, when the charts represent different sample totals. Thirty per cent of twenty differs from thirty per cent of two hundred.
Are these three diagrams limited to Paper 2 Section B?
No. The 2027 K210 syllabus lists them as ordinary S1 content. Underlined Section B content includes cumulative frequency, box plots and specified quartile and spread topics.
Official syllabus and related Mathematics resources
SEAB’s K210 syllabus PDF and the 2027 G2 subject index explain the official data-handling content. The unchanged eduKateSG three-pupil Mathematics reference describes the tutorial approach near Sixth Avenue.
For adjacent skills, read Histograms, Stem-and-Leaf and Misleading Charts and Mean, Median and Mode.
Continue the Secondary 3 G2 Bukit Timah Maths series
- Secondary 3 G2 Mathematics Tutor Bukit Timah | Circle Segments: Arc, Chord and Shaded Area
- Secondary 3 G2 Mathematics Tutor Bukit Timah | Cones and Spheres: Curved Surface, Total Area and Volume
- Secondary 3 G2 Mathematics Tutor Bukit Timah | Fractional Equation Word Problems: Define the Unknown First
Ask eduKateSG about a suitable G2 Maths tutorial. Bring a marked graph question and confirm present class availability, tutor, fees, venue and timetable directly.