
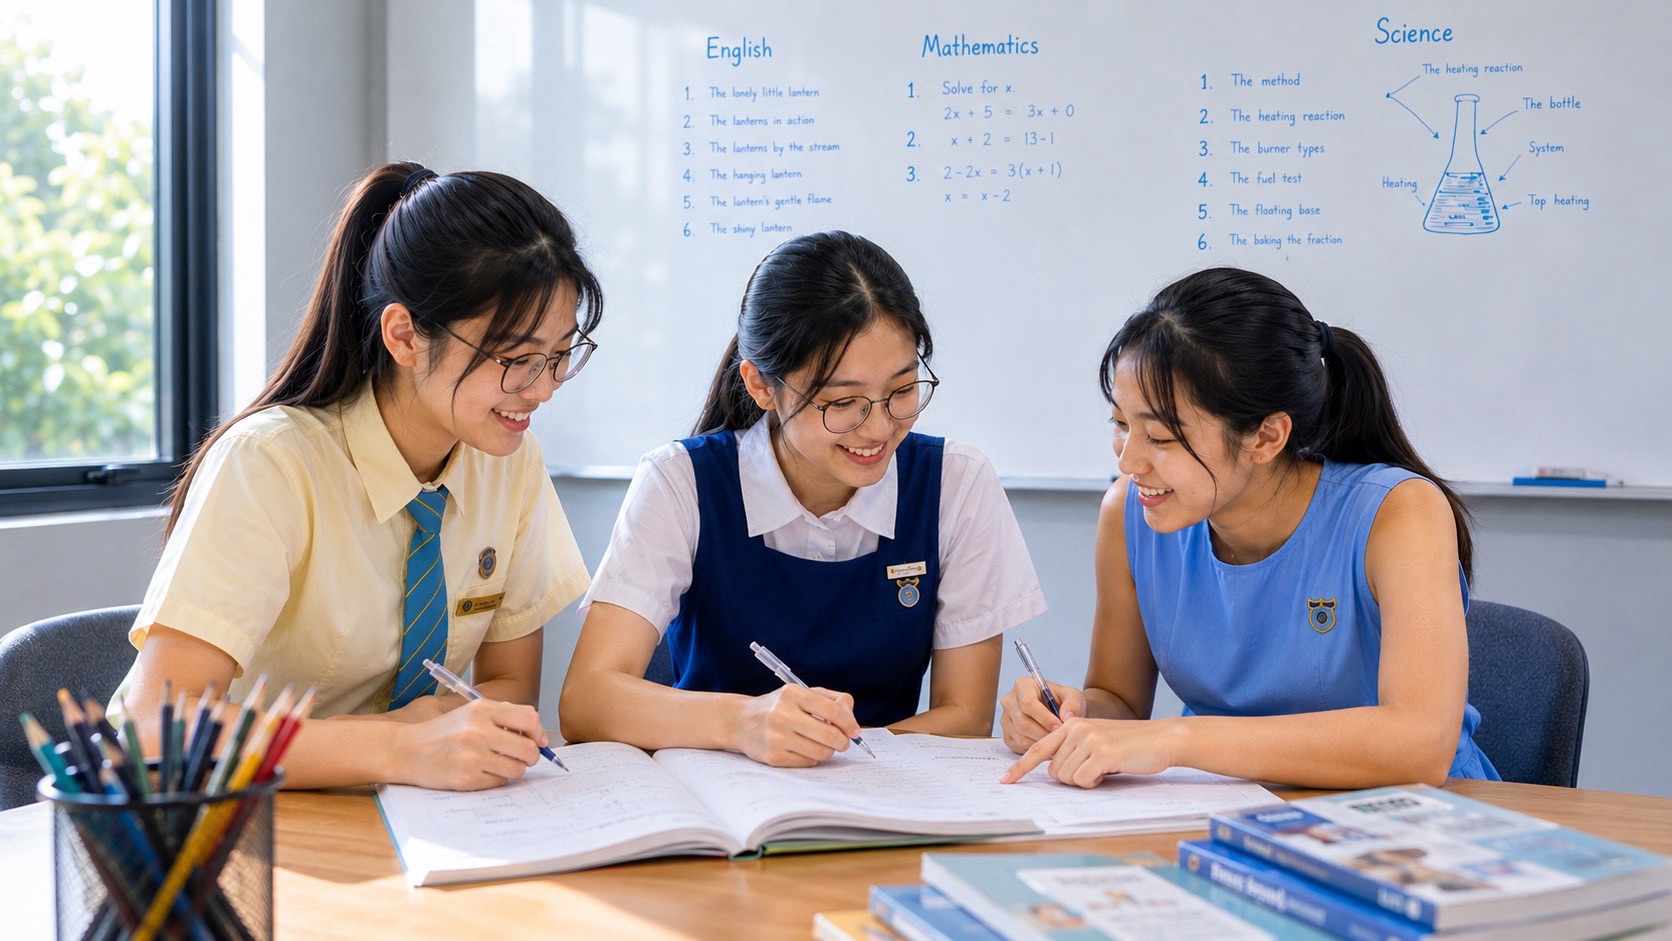
Secondary 3 Mathematics small groups tuition for Fernvale families can help when a teenager performs calculations accurately but chooses an unsuitable average, misreads a probability condition or draws an unsupported conclusion from a graph. A three-pupil class gives the tutor an opportunity to observe each first decision and check whether an unfamiliar follow-up can be solved independently.
eduKateSG’s published model involves up to three learners in a typical 1.5-hour Mathematics tutorial. Its immutable teaching reference describes lessons near Sixth Avenue MRT in Bukit Timah; this Fernvale guide does not verify a current local teaching venue or vacancy. Families should confirm the active tutor, subject level, classroom, fees and full travel.
This guide explains G1/G2/G3 under Full Subject-Based Banding and the 2027 SEC, then develops statistics, data-display and probability examples. It weighs individual feedback against costs, group mismatch, travel and excess tuition homework, and explains how families can assess progress without promised grades.
- Best-fit issue: repeated errors interpreting statistical measures, probability events or graphs.
- Curriculum: check the student’s G1, G2 or G3 Mathematics course; Additional Mathematics is separate.
- Potential benefit: close diagnostic feedback and varied individual problems.
- Possible consequences: travel fatigue, group mismatch, peer pressure and dependence on hints.
- Progress: new data and probability problems interpreted correctly without tutor cues.
- Decision: use additional tuition only when it meets a genuine need beyond school and independent revision.
1. Fernvale parents should look past the final statistics mark
Secondary 3 Mathematics can feel confusing when a pupil knows each calculation but chooses an inappropriate one. One child may calculate the mean correctly even though the question is about the median. Another can multiply probability fractions but does not understand the phrase ‘without replacement’. A third reads a graph accurately but draws a conclusion unsupported by its scale.
These errors call for conceptual feedback, not simply more arithmetic. Ask the teenager to show the original school attempt and explain why a particular method was chosen. Was the sample space correct? What was the requested comparison? Which graph axis represented time or number of observations?
A three-pupil tutorial may give the teacher enough attention to listen to each learner’s first explanation. Its benefit depends on whether the child subsequently interprets a changed problem independently, rather than only completing familiar exercises after the tutor has explained them.
2. Match the Mathematics level under Full Subject-Based Banding
Full Subject-Based Banding permits Singapore secondary students to offer subjects at G1, G2 or G3. These are subject-specific levels rather than permanent labels for a teenager’s entire potential. Two Secondary 3 classmates can be following different Mathematics requirements.
For the first 2027 Singapore-Cambridge Secondary Education Certificate, SEAB lists Mathematics K110 at G1, K210 at G2 and K310 at G3. The SEC replaces the former separate N- and O-Level qualifications for graduating candidates while keeping the different subject-level syllabus demands.
Check SEAB’s official SEC overview, 2027 G1 school-candidate syllabus list, 2027 G2 school-candidate syllabus list, 2027 G3 school-candidate syllabus list and MOE Full SBB and SEC framework. The school should confirm its actual current Mathematics course and assessment year. The worked examples below develop reasoning but are not a claim that every probability or statistics technique is examined at all G-levels.
3. Additional Mathematics is a separate course when offered
The 2027 SEC G3 list separates Mathematics K310 from Additional Mathematics K341, while G2 Additional Mathematics K232 is separately listed. Some Secondary 3 pupils study both subjects; others offer only Mathematics.
A child confident at E-Math statistics may still need A-Math algebra support, while another who handles symbolic functions well may repeatedly misinterpret data. These are different skills and should be diagnosed separately.
Ask which courses the proposed small group teaches and how students are matched when their subject combinations differ. A well-designed class should not make one child wait while others complete a different syllabus for most of the session.
4. Worked example: the mean depends on every observation
Consider the five observations 2, 3, 3, 4 and 18. Their total is thirty, so the arithmetic mean is six. The median is three, the middle observation in the ordered list. Both values are correct statistical descriptions, but they answer different questions.
The unusually high value eighteen raises the mean above most of the observations. The mean is useful for total divided equally; the median may better represent a typical middle experience when an outlier is present.
A tutor should ask the pupil which description the problem requests before any calculation. Changing eighteen to five produces mean 3.4 and median three; an independent explanation of that change demonstrates understanding beyond formula recall.
5. The median depends on order rather than magnitude alone
Take 1, 2, 3, 4 and 10. The median is three and the mean is four. Replace ten with thirty: the median remains three but the mean rises to eight. The central position has not changed, though the total has risen substantially.
A child who treats mean and median as interchangeable may calculate one when the question requests the other. More practice in adding numbers does not repair that conceptual confusion.
Ask the learner to predict what happens to each measure when an extreme value changes, then calculate to verify the prediction. A changed set of observations can test whether the teenager is reasoning about the statistic rather than simply memorising its algorithm.
6. A shared range does not imply similar distributions
Set A is 2, 5, 6, 7 and 10, while Set B is 2, 2, 2, 10 and 10. Both have range eight, the difference between maximum ten and minimum two. Yet their medians are six and two.
A pupil who states that the distributions are identical because their ranges match has used a correct formula to make an unsupported conclusion. Range tells us about the endpoints but not where most observations lie.
A tutor can ask students to construct different data lists with the same range and explain why their typical values differ. Creating a counterexample is often more revealing than computing five extra ranges.
7. A weighted mean should respect contribution size
Suppose a hypothetical assessment gives a quiz 30% weight and a larger test 70%. Scores of sixty and eighty produce a weighted result of 0.3 × 60 + 0.7 × 80 = 74. The ordinary mean seventy would give both components equal influence instead.
The student should understand what each weight represents and why the combined weights add to one. A result nearer eighty than sixty is plausible because the higher score has the larger contribution.
These weights are illustrative, not a statement about a Singapore school’s actual grading policy. A changed pair of weights should be used to test whether the pupil forms a valid weighted relationship independently.
8. Groups with different sizes need a combined total
Four students have an average of sixty and another six students an average of eighty. The first group’s total is 240, the second group’s total 480, and the combined average is (240 + 480)/10 = 72.
Simply averaging the two group means gives seventy and treats the four-student and six-student groups as equally large. The missing idea is that each group average represents a different number of observations.
A tutor can ask the learner to rebuild the total before averaging. Then change the sizes and means and see whether the teenager can work backwards without being told to use a weighted mean.
9. Missing-value means connect statistics with algebra
Five observations have a mean of twelve, so their total is sixty. Four observations are 8, 10, 11 and 13, which sum to forty-two. Therefore the missing fifth observation is eighteen.
The same relationship is written (42 + x)/5 = 12. A student who only remembers how to calculate a mean from a complete list may find this reverse problem unexpectedly difficult.
Ask what the known mean implies about the sum before writing the equation. Change the number of observations and target mean, and require the pupil to define x and create the new model without hints.
10. The mode can be useful when the question concerns frequency
Suppose the observations are 2, 3, 3, 3, 4, 5 and 10. The mode is three because it occurs more often than any other value. The median is also three here, but the mean is 30/7, approximately 4.29.
The three measures happen to share some values in this example but are defined differently. A child should not assume that mode equals median or mean merely because a particular list produces the same number.
Ask the teenager which measure would describe the most common choice and which would describe the total per observation. A changed list with two equally frequent values can expose whether the pupil understands what frequency means.
11. A question about a typical value is not always a mean problem
The word ‘average’ sometimes appears in everyday language without specifying whether the desired measure is mean, median or mode. In a precise Mathematics question, the requested measure and purpose should guide the method.
If a data set has a strong outlier, the median may provide a robust central description, but that does not make it automatically correct for every question. A task about total output divided by the number of observations specifically uses the arithmetic mean.
A tutor should present two different questions about the same data and ask for justifications. This develops judgement rather than a habit of performing whichever formula the last worksheet taught.
12. Read a frequency table before choosing a denominator
A small table lists values 1, 2 and 3 with frequencies 2, 3 and 5. The total number of observations is 2 + 3 + 5 = 10. The sum of all recorded values is 1×2 + 2×3 + 3×5 = 23, so the mean is 23/10 = 2.3.
A student who divides 1 + 2 + 3 by three has averaged the distinct labels rather than the ten observations. The arithmetic is correct for a different data set but not for this frequency table.
A tutor should have the pupil explain what each frequency means and how often each value contributes. A changed table with different frequencies tests whether the student can construct the weighted total independently.
13. A frequency table’s median depends on positions
In the previous frequency table, the ordered ten observations are two ones, three twos and five threes. The fifth observation is two and the sixth is three, so the median is (2 + 3)/2 = 2.5.
A student who takes the middle label of the table, which is two, has not accounted for how many times each value occurs. The table has only three rows but represents ten observations.
A tutor can ask the learner to locate cumulative positions or expand a small table into a list. Then a changed frequency distribution should be analysed without the teacher already marking the middle entry.
14. Graph scales can change visual impression without changing the facts
Three observations 96, 99 and 102 can look dramatically different on a bar chart whose vertical axis begins at 94. With an axis beginning at zero, the same values appear closer. The numbers and their differences have not changed.
A pupil who announces that one value doubled based on the relative bar heights has ignored the scale. The correct description must use the printed values, tick intervals and units rather than a visual guess.
Show both charts and ask which numerical conclusions remain valid. A new chart with a truncated vertical scale can test whether the teenager reads evidence carefully before describing a trend.
15. A line graph and a bar graph do not answer every question identically
A line graph can be useful for showing change across ordered time observations, while a bar chart can compare categories. The graph type should be chosen according to what the data represent and what relationship is being shown.
A teenager might connect unrelated categories with a line and imply that intermediate values exist when the categories have no meaningful order. Another may use bars to compare time trends but overlook the spacing between observations.
A tutor can ask the student to describe why a particular display fits the question. Presenting a changed set of categories and time observations helps learners make defensible representation choices instead of copying the last chart type.
16. Graph gradient carries an interpretation from the axes
A line through points (1, 4) and (5, 12) has gradient (12 − 4)/(5 − 1) = 2. On a cost-versus-quantity graph this means two dollars per item, while on a distance-versus-time graph it means two kilometres per hour if those are the units.
One child may calculate two correctly but attach the wrong unit because the axes were not read. Another may reverse only one coordinate subtraction and get a negative slope for an increasing line.
A tutor should ask the learner to identify vertical and horizontal changes in words, predict the sign and then calculate. A changed graph with new axes provides a useful unaided check.
17. A horizontal segment must be interpreted by its vertical quantity
A distance-time graph that remains level across an interval shows no change in recorded distance. A speed-time graph that is horizontal above zero shows constant speed during that interval. The same visual line shape does not represent the same physical behaviour.
A student who memorises ‘horizontal means stopped’ without looking at axis titles will fail the second example. The problem begins with the interpretation of the graph, not the gradient formula.
A tutor can present both graphs side by side and ask each pupil to explain what remains constant. Then provide a new graph with different labels and request a short independent verbal interpretation.
18. Probability starts by counting every possible outcome
A bag contains four red and three blue counters, all equally likely to be selected. The probability of drawing red on one draw is 4/7 because four of the seven counters are favourable outcomes.
A pupil who writes 4/3 has confused red relative to blue with red relative to all possible counters. A probability greater than one is a warning that the denominator or event was not modelled correctly.
Ask the teenager to list the sample space, count favourable outcomes and only then write the fraction. A changed mixture of counters tests whether this concept has been learned without a tutor selecting the numbers.
19. Ratios are related to probabilities but are not identical
If three counters are green and two are yellow, the green-to-yellow ratio is 3:2. The probability of green in a fair single draw is 3/5. Both statements use the same group sizes but different reference quantities.
A teenager who always puts the second group in the fraction’s denominator may produce impossible probability values. The teacher should ask ‘out of which total?’ and distinguish part-to-part from part-to-whole reasoning.
A tutor can ask students to write a ratio and a probability from the same changed bag. Clear explanations make the distinction transferable to surveys and percentages as well as simple counter questions.
20. Without replacement changes the sample space
Two counters are drawn without replacement from a bag with four red and three blue. The probability of drawing two red is (4/7) × (3/6) = 12/42 = 2/7. After the first red is removed, the bag holds three red among six.
A pupil who multiplies 4/7 twice has silently assumed the first counter was put back. That expression is suitable for a with-replacement experiment, not for the stated one.
Ask the child to describe the contents after the first draw, then change the condition to with replacement. The two-red probability becomes 16/49. The important learning is why the second fraction is different.
21. One red and one blue can occur in two orders
Red followed by blue without replacement has probability (4/7) × (3/6) = 2/7. Blue followed by red has probability (3/7) × (4/6) = 2/7. Both sequences meet the requirement of one counter of each colour.
If the task permits either order, the two mutually exclusive paths add to 4/7. A student who gives only 2/7 has solved one valid path but omitted another outcome required by the wording.
A tutor can ask for a list of successful sequences before any multiplication. A changed set of counters should then be solved without hints about which paths count.
22. The complement of an event can simplify thinking
On one fair draw from the bag of four red and three blue counters, the probability of not drawing red is the probability of blue, 3/7. It also equals one minus the probability of red: 1 − 4/7 = 3/7.
The two methods should agree because red and not-red together cover all possible outcomes without overlap. A teenager who subtracts from the wrong total may not understand what the whole sample space represents.
A tutor can use a new event with several colours and ask whether it is easier to calculate the desired event directly or through its complement. Formal task complexity should match the child’s syllabus.
23. A probability is not the same as an expected count
If a fair event has probability one quarter on each comparable trial, its expected frequency in eighty trials is 80 × 1/4 = 20. This is a statistical expectation, not a guarantee that exactly twenty occurrences will happen.
A student may correctly perform the multiplication but interpret the answer as certainty. The missing concept is that realised outcomes can fluctuate even when the mathematical probability stays unchanged.
Discuss what could happen if the experiment were repeated under the same conditions. The pupil should learn the meaning of ‘expected’ at the appropriate syllabus level rather than memorise a multiplication with no interpretation.
24. Independent trials and replacement should not be confused
When a counter is replaced and the bag returns to the same composition before each fair draw, the probability distribution remains unchanged. With no replacement, the second draw depends on which counter left the bag.
A pupil who looks only at the number of draws may not see why the models differ. A tutor can draw the before-and-after contents and ask which information is still the same.
Then a changed problem should alter the replacement condition while retaining the initial bag. Correct independent explanations show that the teenager understands assumptions rather than selecting a familiar tree-diagram template mechanically.
25. A sample can support a claim about itself without proving everything
A chart showing results from one class can accurately describe those particular students. It does not automatically prove that the same proportions describe every secondary student in Singapore, especially when the sample is small or selected in a non-representative way.
Even perfect arithmetic does not justify an unsupported population-wide conclusion. The question is what observations were collected, whom they represent and what claim the data actually permits.
A tutor can present a fictional classroom survey and ask the learner to rewrite an overconfident conclusion as a precise statement about the respondents. This develops numerical literacy without requiring advanced sampling theory in every G-level course.
26. A cost table is another interpretation problem
A price table lists total costs $5, $8, $11 and $14 for zero, one, two and three items. The constant difference is three dollars per item, while the five-dollar intercept is an initial charge. The model is c = 5 + 3n.
A pupil who writes c = 3n has ignored the fixed fee. Another who writes c = 8n has combined two unlike quantities. Checking at n = 0 immediately reveals the need for a constant term.
A tutor can change the starting fee and rate, then ask the child to infer both from a new table and explain them in words. This links data reading to algebra without presupposing the relevant model.
27. Algebra can be hidden inside an average problem
Five values have a mean of twelve, but one value is missing. A pupil can form an equation from the mean definition rather than guess: if the other four total forty-two, then (42 + x)/5 = 12, giving x = 18.
The same idea can be expressed verbally: the five values must sum to sixty, and forty-two is already known. Both approaches describe the same relationship.
A tutor should compare a numeric method and an algebraic method and then give a changed question where the student chooses an approach independently. Transfer between representations is more valuable than one memorised formula.
28. Group discussion should not replace individual judgement
Three learners may select different statistics or probability expressions for the same question. This can create useful discussion about the assumptions and what the requested answer means. A tutor should welcome a well-explained disagreement rather than immediately reveal the marking scheme.
But a confident student may convince peers of a wrong sample space. The teacher must check the mathematics and protect quiet first-attempt time before conversation.
Every pupil should finish with a changed question completed alone. Parents can then compare the child’s original and later decisions rather than rely on the class’s shared final answer.
29. A ninety-minute tutorial can have a clear learning cycle
eduKateSG’s published three-pupil approach uses a typical 1.5-hour session. A useful lesson should retrieve earlier concepts, explain a priority misconception, allow differentiated individual practice and end with unfamiliar work without tutor hints.
- 10 minutes: retrieve older averages, fractions or event definitions.
- 20 minutes: explain one misconception using a contrasting correct and wrong model.
- 25 minutes: individual tasks while the tutor observes original choices.
- 20 minutes: unfamiliar mixed data or probability problems with chapter cues removed.
- 10 minutes: check calculations, interpretations and error patterns.
- 5 minutes: choose manageable follow-up work and a delayed retrieval task.
The timings are illustrative rather than a statement of an active Fernvale class. The independent final attempt matters because a correct answer after a full demonstration may not survive a changed question.
30. Three pupils need compatible curricula and prerequisites
Students in Secondary 3 can offer different Mathematics levels and have different foundations. One may need more work on fractions, another can calculate probabilities but misreads conditions, and a third may require deeper mixed data interpretation.
A tutor can sometimes share a core idea and offer tasks at different difficulty, but not every group combination works. A child who spends much of the lesson idle or lost may need a different group or one-to-one foundational help.
Ask how pupils are placed, how level-appropriate practice is protected and when a change in group would be recommended. A group of three is not automatically a group of three compatible learning needs.
31. Peer pressure can reduce a child’s willingness to ask
Some teenagers are encouraged when another learner explains an idea differently. Others hesitate to reveal confusion if one classmate finishes quickly. In a small room, the contrast can feel particularly visible.
A good tutor provides private thinking time, discusses incorrect attempts respectfully and rewards justified explanations rather than response speed. Peers should not be allowed to answer on behalf of a learner who has not attempted the question.
If the student repeatedly becomes silent or anxious, a different group or individual teaching may be more productive. The emotional setting influences whether genuine learning needs can be diagnosed.
32. Fernvale travel is part of the educational cost
This article is written for Fernvale families, not confirmation of an active eduKateSG Secondary 3 Mathematics classroom at a Fernvale address. The immutable reference describes tuition near Sixth Avenue MRT in Bukit Timah. Confirm actual venue, teacher, subject level and vacancies before planning attendance.
Fernvale is served by Fernvale LRT on the Sengkang LRT system. But the teenager may begin the journey from school or CCA elsewhere rather than from home. Walking, waiting, transfers, meals and returning home all form part of the weekly burden.
A ninety-minute tutorial may use much more than ninety minutes of the evening. A tired pupil can struggle with subtle statistics and probability questions, making the full time and wellbeing cost part of the family’s choice.
33. Worksheet volume is not the same as understanding
A worksheet headed ‘Probability Without Replacement’ tells the learner one of the most important conditions before the question is read. Such focused practice can build early fluency but does not prove method selection during a mixed examination.
A tutor should eventually remove labels, mix topics and revisit old mistakes after several days. A small, varied set that asks the student to choose and justify a method may be more useful than many nearly identical calculations.
Parents should ask why extra homework is assigned and how it fits schoolwork, CCA and rest. More pages can become a consequence rather than a benefit when the learner is rushed.
34. Too many tutor prompts can create fragile success
A pupil may complete all lesson questions because the tutor immediately points to the relevant average or identifies which counters remain. When the student faces the school paper alone, those cues disappear and the same difficulty returns.
Effective teaching reduces assistance gradually: demonstration, one neutral prompt on a variation, then a new problem attempted completely independently. The amount of help needed should become smaller over time.
Parents can request work completed after a delay without assistance. The goal is a teenager who recognises a statistical or probability relationship independently, not an immaculate notebook produced under constant guidance.
35. Research supports careful group design, not promised examination grades
The Education Endowment Foundation evidence for small-group tuition reviews targeted small-group tuition with about two to five pupils and reports positive educational effects on average. The studies vary by student age, subject, lesson intensity and implementation, with secondary-school evidence generally less extensive than primary-school evidence.
Those findings cannot guarantee a particular SEC Mathematics grade or marks improvement from a weekly commercial ninety-minute tutorial. A tutor’s ability to diagnose, differentiate and check independent practice is essential.
Parents should use research to ask better questions, then judge the actual child’s work over several weeks. A small class size creates opportunities for feedback but is not itself an outcome.
36. A six-week progress review can reveal meaningful change
Week one can preserve original school attempts on an average, a two-draw probability event and a graph. Record the first incorrect decision and how much prompting was needed. Weeks two and three address the priority misconception.
Weeks four and five revisit the principle using changed data, altered conditions and delayed retrieval. In week six, ask for comparable unfamiliar problems without hints. Look for correct statistic selection, updated sample spaces and graph claims supported by actual values.
School marks provide additional evidence but can vary with paper difficulty. If independent judgement remains unchanged, revise the teaching method or group rather than continuing identical tuition by habit.
37. When a family may not need private tuition
A teenager who understands school teaching, corrects errors independently and maintains steady progress may not need another paid Mathematics class. A short home revision routine and teacher consultation can already provide the necessary support.
A pupil with substantial fraction or number gaps may benefit more from one-to-one foundational work before entering a group. Another whose main difficulty is an exhausting timetable may need more rest, not more scheduled lessons.
The one-to-one versus small-group Mathematics comparison compares different formats. Effective tuition should make the teenager less dependent over time, and a responsible tutor can recommend a pause when the original need has been repaired.
38. Questions Fernvale parents should ask before paying
- Which G1, G2 or G3 Mathematics syllabus and examination year apply?
- Does the teenager offer Additional Mathematics, and how are those goals separated?
- What first reasoning mistake appears in original statistics or probability work?
- Do all three pupils complete initial and changed problems independently?
- What happens if the group contains incompatible prerequisites or course levels?
- What are the confirmed current venue, tutor, timetable, fees and vacancies?
- How much added homework fits around school, CCA, transport and sleep?
- Which unseen tasks will be reviewed after six weeks, and when might reducing tuition make sense?
39. Frequently asked questions
Does every Secondary 3 pupil require Mathematics tuition?
No. School teaching, teacher corrections and independent revision may already meet the student’s needs. Tuition should target a specific gap.
Are all G1, G2 and G3 Mathematics requirements identical?
No. The subject levels have distinct syllabuses and assessment demands.
Is Additional Mathematics compulsory?
No. A-Math is a separate subject taken by some secondary pupils.
Are every probability example and graph task here examinable at all levels?
No. They illustrate reasoning. Formal revision must follow the student’s actual course and examination year.
Does this guide confirm a Fernvale classroom?
No. This article is information for Fernvale parents, not a verified local class or vacancy listing.
Does a class of three guarantee better marks?
No. A smaller group can permit closer feedback, but no examination result can be guaranteed.
How can a parent test statistical understanding?
Alter an outlier and ask the teenager to choose and justify an appropriate summary without hints.
What does without replacement mean?
The first selected item is not returned, so the sample space for the second draw can change.
When should tuition end?
When the earlier learning gap is repaired and the student can sustain progress independently, reconsider the need for weekly paid lessons.
40. Official references and related learning
The 2027 SEC and Full SBB framework is documented by SEAB’s official SEC overview, 2027 G1 school-candidate syllabus list, 2027 G2 school-candidate syllabus list, 2027 G3 school-candidate syllabus list and MOE Full SBB and SEC framework. The child’s school confirms current teaching sequence and subject combination.
The Education Endowment Foundation evidence for small-group tuition provides independent research context about targeted groups. Its average outcomes are not guarantees for an individual commercial tuition programme.
For related eduKateSG guides see immutable Clementi small-groups Mathematics teaching reference, the Sengkang Mathematics parent guide, the Buangkok Mathematics guide, the Seletar Mathematics guide and the one-to-one versus small-group Mathematics comparison.
The desired educational consequence is a teenager who interprets evidence accurately, chooses a mathematical model, calculates with appropriate assumptions and verifies an unfamiliar answer without relying on the tutor’s next hint.