
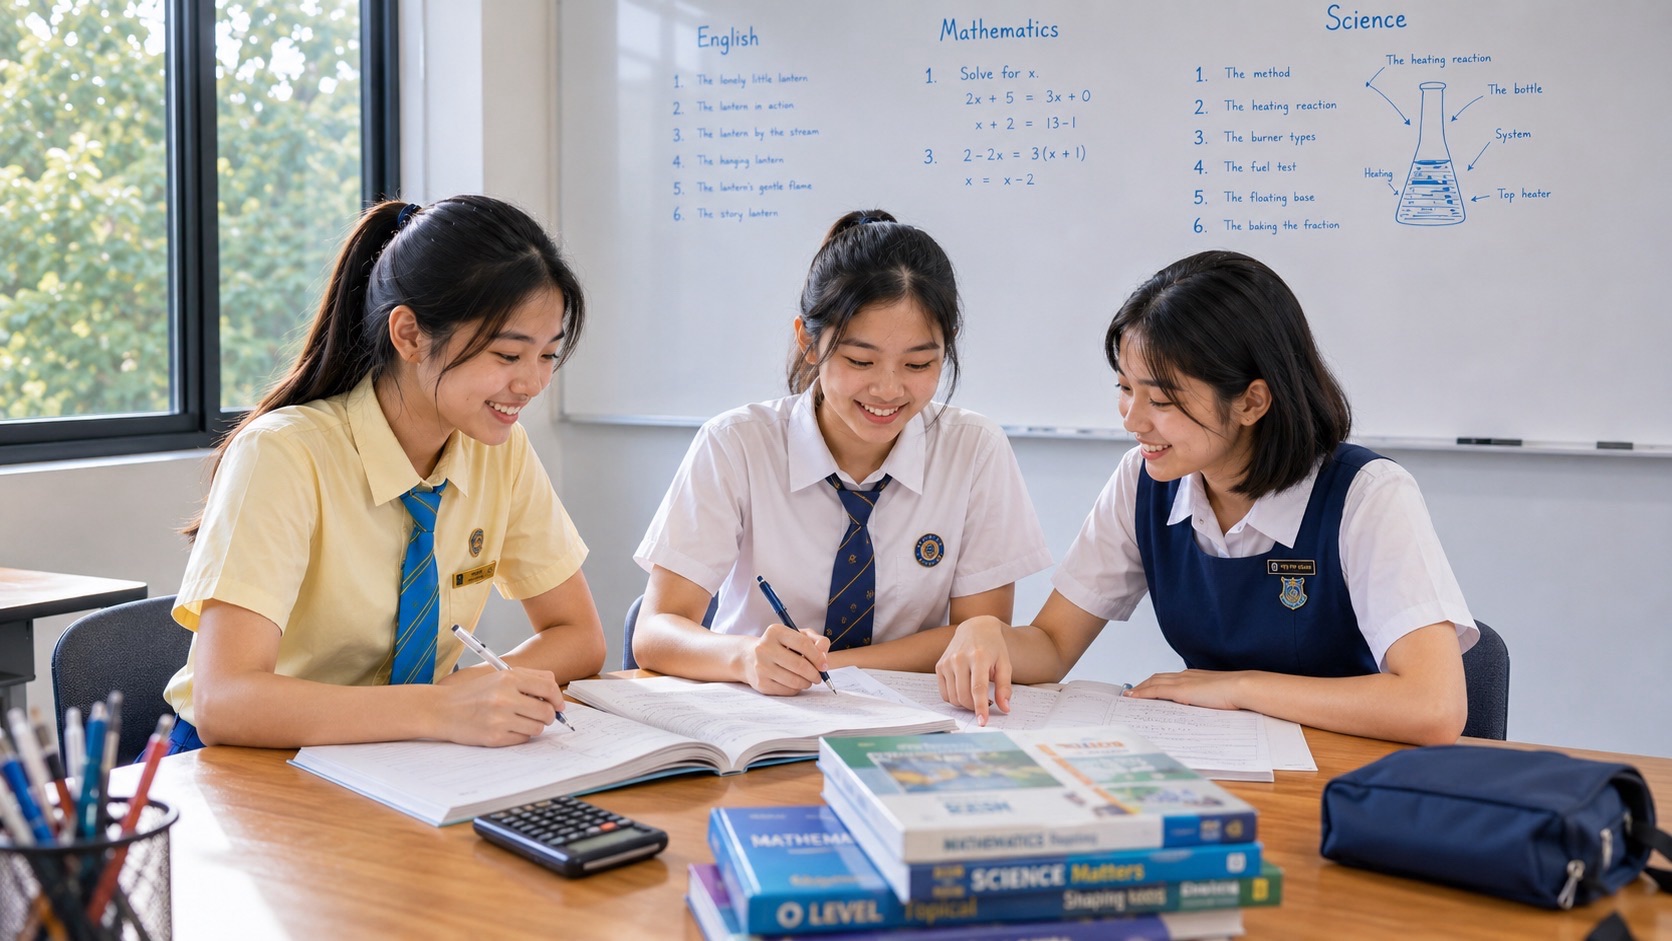
When your child can calculate with numbers but answers the wrong question in a Secondary 1 table, graph or notice, start by checking what each number describes. Ask who or what was counted, which period it covers and what unit belongs beside it. Then ask your child to point to the part of the question that tells them what to find. This workbook gives families original practice material with worked answers across English, Mathematics, Science and common classroom tasks.
Use one short task at a time and let your child explain their first answer before looking at the solution. The examples are fictional teaching material, with all the information needed supplied here. They are for practice alongside your child’s school learning. Posting Group 1 guides secondary admission and the indicative starting levels, while the actual class and subject determine what your child is learning now. For a wider explanation of graph and table concepts across secondary subjects, use the guide to data reading across subjects.
- Read the task. Underline what to find and any limits such as “among”, “at least”, “using the table” or “give two”.
- Name the quantity. Say what was measured or counted, who is included, and the unit and time period.
- Choose the evidence. Find the relevant row, column, sentence or pair of values before calculating.
- Explain the answer. Show a calculation when useful and finish with a sentence that answers the actual question.
- Check the conclusion. Decide whether the information supports the claim or leaves something unknown.
- Try a fresh version later. Change a detail or ask another question to see whether your child can use the same skill independently.
In this guide
- Start with a question your child can point to
- Practice one. Read a notice before making a plan
- Practice two. Find the denominator in a survey table
- Practice three. Describe a graph from its actual data
- Practice four. Read a Science measurement table
- Practice five. Read a missing value honestly
- Practice six. Make a decision with two constraints
- Practice seven. Compare counts and rates
- A parent’s check of the answer, step by step
- Choose the next exercise from the error
- Try a fresh task without looking at the model
Start with a question your child can point to
Put the question beside the information rather than reading it once and putting it aside. Ask your child to find the requested action. A question might ask them to state, calculate, compare, suggest or explain. These actions need different responses. “State the number who attended” can be answered with a count. “Explain why a booking was unsuitable” needs a connection between the booking and the relevant rule. A learner who starts calculating immediately may produce a correct number with no answer to the question.
Next find any condition that limits the response. “Among the afternoon visitors” selects a group. “Use Monday’s data” selects a period. “Give two details” asks for two relevant pieces of information. “Suggest a reason” invites a possible explanation, while “state the reason given in the notice” requires the stated explanation. Ask your child to say the condition aloud. Then choose the evidence that belongs to it. This small step can prevent a whole page of working based on the wrong group.
The official English teaching syllabus describes reading and viewing as part of making meaning from information, with writing and speaking used to communicate meaning. The Mathematics syllabus includes reasoning with quantities and percentages, while the G1 lower-secondary Science syllabus includes measurement and appropriate units. This workbook draws on those broad learning goals through new examples. Your child’s teacher determines the sequence and depth of classroom tasks. MOE English Language syllabus, G1 Mathematics syllabus and G1 lower-secondary Science syllabus
Give an answer a quantity and a unit
When a child says “twelve”, ask “Twelve what?” It could mean twelve students, twelve minutes, twelve dollars or twelve bottles. The number may have been copied correctly while the quantity has changed in the child’s mind. Ask them to read the heading above the value and the label beside its row. Then put the quantity into a sentence. “Twelve students selected the afternoon session” gives more meaning than “the answer is twelve”.
A unit can also reveal a calculation that does not fit. Suppose a question asks for a total cost in dollars. Adding a head count to a price per person gives a sum that combines different quantities. Multiplying the number of people by the price per person may produce the required total, depending on the task. Let your child explain which quantity they are finding before choosing an operation. If they are unsure, have them describe a smaller example in ordinary words.
Allow the first attempt to show the misunderstanding
Use the first answer as information. If your child chooses the wrong column, ask what that column represents. If the denominator is wrong, ask who the question includes. If the conclusion says more than the table shows, ask which measurement would be needed to support it. The correction becomes more useful when the child identifies the point at which the meaning changed.
Write a small note about that point and try a different task later. A learner who needed help with “among afternoon visitors” can practise a new question about “among those who brought a bottle”. A learner who confused quantity with unit can read a different heading. Keep the next attempt short enough that the child can use the idea without rereading a long explanation. When they apply it to new information, you have evidence of a skill they can reuse.
Practice one. Read a notice before making a plan
Here is a fictional notice for a school learning fair.
School Learning Fair: Saturday, 10 am to 2 pm. General entry is free. The repair demonstration has two sessions, at 10.30 am and 12.30 pm. Each session lasts 40 minutes and has 24 places. Visitors must reserve a place before attending a demonstration. Reservation does not reserve general seating elsewhere in the fair. Children attending a demonstration must be accompanied by an adult. One adult may accompany up to two children. Every person attending needs a reserved place. Arrive at the demonstration desk ten minutes before your session. Unclaimed demonstration places may be offered to waiting visitors five minutes before the start. The borrowing booth closes at 1.30 pm.
Read the whole notice once. Ask your child to tell you which parts concern every visitor and which concern people attending a demonstration. Free general entry and opening hours apply to the fair. Demonstration reservations, adult accompaniment and desk arrival apply to the demonstration. The borrowing booth has its own closing time. A person who remembers only the fair’s final closing time may reach that booth too late.
Question A. How many places should this family reserve?
A parent and two children all want to attend the same demonstration. Ask your child how many places the family needs and why. The answer is three reserved places, one for each person attending. The notice permits one adult to accompany up to two children and requires a place for every person attending. If a real notice leaves an accompaniment rule unclear, the family should ask the organiser. For this fictional task, the three people attending each occupy a place.
A child who answers two may be counting only the children. Ask them to point to the sentence about the adult’s place. A child who answers four may have interpreted the wording as a separate accompanying adult for each child. Discuss what the text actually specifies and why the group should avoid adding a rule that is absent. The reasoning matters because a timetable or booking question can depend on understanding who is included.
Question B. When should the family reach the desk?
For the 12.30 pm session, arrival at the demonstration desk is required ten minutes before the session. That gives 12.20 pm. The answer should name the desk and the time. Arriving at the fair entrance at 12.20 pm may leave no time to get to the desk. The task asks for the desk arrival, so use that precise location.
Now ask whether arriving at 12.25 pm guarantees a reserved place remains available. The notice says unclaimed places may be offered to waiting visitors five minutes before the start. The family should follow the required desk arrival at 12.20 pm. The word “may” gives the organiser an option under the stated rule; it does not guarantee that a late arrival keeps a place. This answer uses two connected details instead of one isolated time.
Question C. Can the family finish the demonstration and then use the borrowing booth?
The 12.30 pm session lasts 40 minutes, so it ends at 1.10 pm. The borrowing booth closes at 1.30 pm. On the stated schedule, there are 20 minutes between the end of the demonstration and the booth’s closing. The notice does not give a walking time or a queue time. A careful answer is that the timetable leaves 20 minutes, but the family would need to allow for getting to the booth and completing any borrowing process.
If the question asks only “How many minutes are available?”, 20 minutes answers it. If it asks “Explain whether the plan is certain to work”, the response needs the missing practical information. The same calculation can support two different tasks. Ask your child to check which response the wording requires.
Question D. Write a message to a friend
Ask the child to write a two-sentence message to a friend who thinks the free entry includes a guaranteed demonstration place. A possible answer is, “General entry to the fair is free, but you need to reserve a place for the repair demonstration. Reserve a place for each person attending and reach the demonstration desk ten minutes before your session.” The message addresses the misunderstanding and gives the action needed to attend.
Give the child a new reader. The friend now has a reservation and plans to arrive at the desk at 12.28 pm. The useful message changes. It should say that the desk arrival for the 12.30 pm session is 12.20 pm and unclaimed places may be offered to waiting visitors at 12.25 pm. A good answer uses the information that helps this reader make the next decision. Repeating all the opening hours would leave the immediate problem unresolved.
Practice two. Find the denominator in a survey table
The fictional fair team surveys 60 visitors who chose to answer a question about bringing a reusable bottle. Thirty-six respondents attended in the morning and 24 in the afternoon. Each respondent is counted once. The table shows only those respondents. It does not describe every visitor at the fair.
| Survey respondents | Brought a reusable bottle | Did not bring a reusable bottle | Total respondents |
|---|---|---|---|
| Morning | 27 | 9 | 36 |
| Afternoon | 12 | 12 | 24 |
| Total | 39 | 21 | 60 |
Ask your child to check the totals before finding a percentage. In the morning row, 27 plus nine is 36. In the afternoon row, 12 plus 12 is 24. The columns add to 39, 21 and 60. The completed table shows the groups used in the questions. Read one cell in a full sentence. “Twelve afternoon respondents brought a reusable bottle” preserves both the time group and the response.
Question A. What percentage of morning respondents brought a bottle?
The selected group is morning respondents, so the denominator is 36. Of those, 27 brought a bottle. The percentage is 27 divided by 36, multiplied by 100, which is 75%. Finish with “Seventy-five per cent of the morning respondents brought a reusable bottle.” The phrase “morning respondents” tells the reader exactly which group the percentage describes.
If the child uses 60 as the denominator, the result is 45%. That answers a different question: the morning respondents who brought a bottle as a percentage of all respondents. The arithmetic can be correct while the question remains unanswered. Ask the child to circle the words that selected the denominator and try again before doing more calculation practice.
Question B. Among respondents who brought a bottle, what percentage attended in the afternoon?
Now the selected group is everyone who brought a bottle. Its total is 39. Twelve of those respondents attended in the afternoon. Twelve divided by 39, multiplied by 100, is approximately 30.8% to one decimal place. The denominator is a column total. The afternoon row total of 24 would answer a different question.
Compare the wording with “What percentage of afternoon respondents brought a bottle?” That second question uses 12 out of 24, giving 50%. Both calculations use the cell containing 12. They describe different groups. Let the child draw a small box around the selected group each time. Then ask them to explain why the denominator changes even though the numerator stays the same.
Question C. Can the fair team say that 65% of all visitors brought a bottle?
Thirty-nine out of 60 respondents brought a bottle, giving 65%. The table supports that statement about respondents. It does not tell us the bottle habits of all visitors who did not answer. A careful sentence is, “Sixty-five per cent of the 60 survey respondents brought a reusable bottle.” The group can discuss whether its survey process gives enough information for any broader claim.
A learner should avoid solving this by dismissing the table altogether. The responses are still useful information about the people counted. The task is to keep the conclusion at the scope supported by the information. If the team wants to describe all visitors, it needs an appropriate way to collect information about that wider group and to understand any gaps.
Question D. Compare morning and afternoon percentages
Morning bottle use among respondents is 75%. Afternoon bottle use is 50%. The difference is 25 percentage points. If the question asks for the percentage decrease relative to the morning percentage, the calculation is 25 divided by 75, multiplied by 100, or approximately 33.3%. These two answers use different comparisons.
For an initial task, ask only for the percentage-point difference and the two percentages used. Once the child can explain it, ask about the relative change. The question must specify the baseline. A statement saying simply “bottle use decreased by 25%” does not communicate the same calculation as a 25 percentage-point difference. Use the full sentence that fits the task.
Practice three. Describe a graph from its actual data
The next fictional dataset gives the number of visitors entering the fair in successive half-hour intervals. Each visitor is counted once on entry. The counts are for intervals, rather than the total number inside at each moment.
| Entry interval | Number entering |
|---|---|
| 10.00–10.30 am | 30 |
| 10.30–11.00 am | 45 |
| 11.00–11.30 am | 60 |
| 11.30 am–noon | 45 |
| Noon–12.30 pm | 30 |
| 12.30–1.00 pm | 15 |
| 1.00–1.30 pm | 15 |
| 1.30–2.00 pm | 0 |
If students draw a bar chart of these counts, label the horizontal categories with the intervals and the vertical axis “Number entering”. A vertical scale from zero to 60 with equal intervals of 15 can represent all the values. The bars for 30, 45 and 60 rise to their corresponding marks. The last interval has a count of zero. The chart describes arrivals across time periods. It cannot tell the number still inside without information about departures.
Question A. Which interval had the greatest count?
The greatest number entering is 60, during 11.00–11.30 am. The answer needs the complete interval. “At 11 am” would suggest a single moment rather than everyone counted over the following half-hour. A child can read the tallest bar accurately and still misstate the period. Ask them to use the category label exactly.
The total entering during the eight intervals is 240. Add 30, 45, 60, 45, 30, 15, 15 and zero. Ask your child whether the survey of 60 respondents in the previous exercise included every visitor. On these fictional figures it included a quarter of the 240 arrivals, assuming these are the fair’s visitors. The table alone still does not tell us whether the respondents were representative of all arrivals.
Question B. Describe the pattern using two values
A possible answer is, “The number entering rose from 30 in the first interval to 60 in the 11.00–11.30 am interval, then fell to zero in the last interval.” This description uses the measured quantity, periods and values. It does not invent a reason. A student could also mention that the two intervals from 12.30 pm to 1.30 pm each had 15 arrivals.
Now ask whether the pattern proves that the later demonstration was unpopular. The arrival count covers entry to the fair. It does not count attendance at each demonstration, and people who arrived earlier could attend a later session. The graph can suggest a question worth investigating, but a claim about demonstration popularity needs the relevant booking or attendance information.
Question C. How could a scale change the appearance?
Imagine the same data displayed in two charts of equal height. One uses a vertical range from zero to 60. The other uses zero to 120. A count of 60 reaches the top of the first chart and halfway up the second. The numerical values are the same, while the chosen vertical range changes the height of the bars on the page.
Ask the child to check labels and values before judging the visual difference. If the scale marks are equally spaced and accurately labelled, the reader can recover the values. A chart can still be easier or harder to interpret depending on its design. The task is to read what is actually displayed and describe any design choice that affects the impression.
Question D. Does zero mean that the fair was empty?
No visitors entering between 1.30 pm and 2 pm means the count of arrivals for that interval is zero. Visitors who entered earlier may still be inside. We would need departure information to calculate occupancy. A clear answer is, “The table records no arrivals in the last interval. It does not state how many earlier visitors remained.”
This distinction transfers to many contexts. Zero new books borrowed is different from zero books held by borrowers. Zero new rain during an interval is different from no water remaining in a container. Zero new members joining a club is different from no club members. Ask your child to invent one more example with a flow during a period and an amount present at a time.
Practice four. Read a Science measurement table
This fictional classroom dataset describes the temperature of water in two containers at recorded times. The teacher’s sample says that the containers were identical apart from the presence of a lid, and each began with the same volume of water at 60°C. The containers were placed in the same room and measured at the same intervals using the stated method. One container had a lid and the other did not. These are supplied numbers for reading practice. There is no need to heat water or run an experiment at home.
| Time after start, minutes | Container with lid, °C | Container without lid, °C |
|---|---|---|
| 0 | 60 | 60 |
| 5 | 55 | 50 |
| 10 | 51 | 43 |
| 15 | 48 | 38 |
Read the heading above each column. The first contains elapsed time in minutes. The other two contain temperature in degrees Celsius. A child who says the uncovered container is “38 minutes” has combined a row value with the wrong unit. Ask them to trace the value up to the column heading and then read the row in one sentence. “At 15 minutes, the water in the container without a lid was 38°C.”
The lower-secondary G1 Science syllabus includes recording measurements with appropriate units and using measurements as evidence in investigation. The task here begins with those habits, then asks the learner to distinguish an observation from an explanation. Use your child’s taught scientific ideas when extending the discussion. Measurement in the G1 lower-secondary Science syllabus
Question A. Find the temperature decrease over 15 minutes
For the container with a lid, subtract the final temperature from the starting temperature: 60 minus 48 is 12°C. For the container without a lid, 60 minus 38 is 22°C. The calculation describes the amount by which temperature fell across the recorded period. An answer saying that the lidded container “fell by 48°C” has copied the final temperature instead of finding the change.
Ask the child to write both quantities. “Final temperature, 48°C. Temperature decrease, 12°C.” Then change the task. At ten minutes, the container with a lid is at 51°C, a decrease of nine degrees from the start. The learner has to read the specified row before calculating. A method applied to the wrong time will still give an answer to a different question.
Question B. Use the data to compare the containers
A suitable answer is, “Over the recorded 15 minutes, the water without a lid had a greater temperature decrease: 22°C compared with 12°C for the water with a lid.” Another answer could compare the temperatures at 15 minutes: 48°C with a lid and 38°C without a lid. Which version is best depends on whether the question asks about temperature decrease or final temperature.
If the question asks for evidence that the lidded container retained a higher temperature at the measured times after the start, use matched times. At five minutes it was 55°C compared with 50°C. At ten minutes it was 51°C compared with 43°C. Comparing 55°C at five minutes with 38°C at 15 minutes combines different moments and does not provide the same evidence. Pair the rows before choosing values.
Question C. Can we state the temperature at 20 minutes?
The table stops at 15 minutes. It supplies no measured value for 20 minutes. A learner might extend a pattern, but any such value would be a prediction based on assumptions, rather than an observation in the table. For a task asking for recorded data, say that the 20-minute temperature is not provided. For a task inviting a prediction, explain the basis and uncertainty as the teacher expects.
The steps between readings also differ. The lidded container falls by five, four and three degrees in successive five-minute intervals. The uncovered container falls by ten, seven and five. The table does not show the same temperature drop in every interval. A student who subtracts another fixed five degrees at every later time has added a rule the data do not establish. Ask what the numbers actually suggest before making a prediction.
Question D. Which factors were kept the same?
The fictional description specifies identical containers apart from the lid, equal starting volume, equal starting temperature, the same room, the same measurement intervals and the stated measurement method. Those conditions make the comparison more informative than a table whose containers began under very different conditions. The feature described as changed is the presence of the lid.
Now change the description. Suppose one container began with 200 ml of water and the other with 500 ml. A difference in cooling could involve the different volumes as well as the lids. The original one-factor interpretation would need reconsideration. A careful learner reads the method with the table. The numbers show what happened in those conditions; the method helps the reader judge what the comparison can support.
Question E. Write an observation and then a possible explanation
An observation states what the supplied results show. “At 15 minutes, the water with a lid was 10°C warmer than the water without a lid” is an observation calculated from 48 minus 38. An explanation uses scientific ideas to account for a pattern. The learner should use the ideas taught in class and refer to the relevant conditions. If they have not studied the mechanism yet, keep the task at observation and ask the teacher how to extend it.
Avoid treating the difference of 10°C as a direct measurement of energy. Temperature and energy are different quantities. The table gives temperature values and does not provide an energy measurement. A child who writes “the lid saved 10°C of energy” needs help naming what the number represents. Ask them to replace the phrase with a statement about the measured temperatures.
Practice five. Read a missing value honestly
The next fictional table records the amount of paper collected at a classroom reuse station. The amount is measured in kilograms each day. A dash means the amount was not recorded that day.
| Day | Paper collected, kg |
|---|---|
| Monday | 2.4 |
| Tuesday | 3.1 |
| Wednesday | — |
| Thursday | 2.5 |
| Friday | 0.0 |
First ask what Friday means. The amount recorded for Friday is zero kilograms. Then ask what Wednesday means. The amount was not recorded, so its value is unknown from the table. The two entries have different meanings. Replacing Wednesday with zero would add information that was never collected.
Question A. Find the total of the recorded amounts
The recorded total is 2.4 plus 3.1 plus 2.5 plus zero, which equals 8.0 kg. Call it the total of the recorded amounts. The full Monday-to-Friday total cannot be established from the table because Wednesday’s amount is missing. A precise answer preserves that condition. If the question asks for “the total paper collected that week”, explain the missing value rather than presenting 8.0 kg as the complete weekly figure.
A student may want to estimate Wednesday using neighbouring days. That could be a separate estimation task, but it changes the nature of the answer. For this question, we are adding recorded amounts. If an estimate is requested, state it as an estimate, explain the chosen basis and avoid mixing it into a measured total without a label.
Question B. Find the mean of the recorded daily amounts
There are four recorded daily amounts, including the zero on Friday. Their total is 8.0 kg, so the mean of those four recorded days is 2.0 kg. Divide by four. Dividing by five would treat the missing day as though it contributed a known amount to the total. Dividing by three would leave out a real recorded zero.
Ask your child why zero counts as a recorded day. The measurement can be zero and still be a valid observation for the dataset. Wednesday lacks an observation. The denominator follows what the question defines. A mean of four recorded days is a useful summary with a clear scope. It does not automatically become the mean of all five weekdays.
Question C. What would you ask before plotting a weekly line graph?
Ask how the missing observation should be shown for the assigned task. A plot should communicate that Wednesday is missing rather than show it as zero. The teacher may want a gap, a marked missing entry or a different display. If a chart uses connected lines, make sure the reader does not mistake a connection across a missing observation for a measured Wednesday value.
The learner should also label the vertical quantity as paper collected in kilograms and the horizontal categories as days. A value of 2.4 kg placed as 24 kg would distort the display. Read the table aloud before plotting and check one point afterwards. Small checks on units and decimal places can catch a mistake before the child writes an explanation from the wrong graph.
Practice six. Make a decision with two constraints
A fictional class plans packs for a demonstration. It has a budget of $36 and wants at least 12 packs. Each pack uses one card sheet and two clips. Card sheets cost $0.80 each. Clips are sold only in bags of ten at $2 per bag. Other materials are already available and have no extra cost in this task. The class must buy enough whole bags for the number of clips needed.
Ask your child to identify both constraints. The cost must be no more than $36 and the number of packs must be at least 12. “At least” includes 12. A plan with 11 cheap packs misses the quantity condition even if it is below budget. A plan with 20 packs could still fail if it ignores the price of whole bags or another stated condition.
Question A. What does a plan for 12 packs cost?
Twelve packs need 12 card sheets and 24 clips. The sheets cost 12 multiplied by $0.80, which is $9.60. Twenty-four clips require three whole bags of ten, costing $6. The total purchase cost is $15.60. Six clips remain unused in those packs, but the class still has to buy the three bags.
If the child calculates clips at $0.20 each and pays $4.80 for 24, point to the buying rule. The per-clip price can help compare costs, but the task says clips are sold in whole bags. The amount the class must pay for enough clips is $6. A mathematically sensible unit price can be used incorrectly when the transaction has a package constraint.
Question B. Can the class make 25 packs within the budget?
Twenty-five packs need 25 sheets, costing $20, and 50 clips, requiring five bags costing $10. The total is $30. It meets the budget and quantity constraints. A complete answer states both. “Twenty-five packs cost $30, which is within $36, and 25 is at least 12.”
Now try 30 packs. Thirty sheets cost $24 and 60 clips cost $12, giving $36 exactly. It also meets the stated conditions. Thirty-one packs need sheets costing $24.80 and 62 clips, so seven bags cost $14. The total is $38.80, which exceeds the budget. Under these prices and conditions, 30 is the largest feasible number of packs. Ask the child to explain why checking 31 helps establish that boundary.
Question C. What should a recommendation include?
If asked to recommend one plan, the child should use the task’s goal. A plan for 12 packs meets the minimum and uses less money. A plan for 30 makes the greatest number under the stated budget. If the question asks for the maximum number, 30 answers it. If it asks for a practical recommendation with money left for a possible extra cost, the task would need to specify that requirement or allow the learner to state it as a proposed reason.
Teach your child to identify a condition they are adding. “I suggest making 25 packs so that $6 remains” describes a choice supported by the calculated cost. “We must leave $6” invents a rule absent from the original task. A student can make a reasoned recommendation while making its basis clear. The reader should be able to tell which conditions came from the task and which came from the student’s judgement.
Practice seven. Compare counts and rates
A fictional class checks reusable-cup returns at two booths. Booth A lends 40 cups and receives 36 back by the stated cutoff. Booth B lends 80 cups and receives 64 back by the same cutoff. The figures refer to cups lent during the same event and returns recorded by the same deadline. Every lent cup is counted once, and every returned cup belongs to that booth’s lending record.
Booth B receives more cups back in absolute numbers: 64 compared with 36. Booth A has the higher return percentage: 36 out of 40 is 90%, while 64 out of 80 is 80%. Both statements can be accurate. The question must tell the learner which comparison matters. Ask the child to name the measure before declaring one booth “better”.
Question A. How many cups were outstanding at the cutoff?
At Booth A, 40 minus 36 gives four cups outstanding. At Booth B, 80 minus 64 gives 16. Across both booths, 120 were lent and 100 were returned, leaving 20 outstanding. “Outstanding at the cutoff” is the precise description. The figures do not state that all 20 were permanently lost. Some might be returned later, but that would need a later record.
The combined return percentage is 100 divided by 120, multiplied by 100, which is approximately 83.3%. It is not the simple average of 90% and 80%, which would be 85%. The booths lent different numbers of cups, so the combined calculation must use the combined counts. For learners just beginning percentages, work with the counts first and return to the combined rate later.
Question B. Does Booth A’s return percentage prove its reminder sign caused the difference?
The data show a difference in return percentages under the stated conditions. They do not describe a controlled comparison of reminder signs. Booths could differ in location, visitors, collection arrangements or other features. A careful answer says that Booth A had the higher recorded return percentage and that more information would be needed to identify why.
If the class wants to investigate signs, it can ask the teacher what a suitable comparison would involve. The practice task is to match the conclusion to the evidence already supplied. The learner can propose a question for further investigation while preserving the result they actually observed. That combination supports curiosity and accuracy together.
A parent’s check of the answer, step by step
Ask your child to explain one answer using the question, the selected evidence, the working and the conclusion. If they hesitate, find the first unclear part. A wrong denominator needs a look at the group named in the question. A correct result with a weak explanation needs a sentence connecting the evidence to the claim. A neat graph with incorrect labels needs a check of the quantities. Each error points to a different next task.
Keep help brief enough that the next decision still belongs to the child. You might ask, “Who is included in this percentage?” or “Where did you find the unit?” Let them point and revise. Once the answer works, change one detail. Replace morning with afternoon, ask for a final temperature instead of a decrease, or change the requested quantity from minimum to maximum. The fresh version shows whether the child understands the relationship.
A record for three short practice sessions
| Session | Task attempted | What the child did independently | Point to practise next |
|---|---|---|---|
| One | Notice and arrival-time question | Found the session and subtracted ten minutes | Include the desk location in the answer |
| Two | Survey percentage | Selected the morning group and used 36 as the denominator | Explain why another question uses the bottle column total |
| Three | Science comparison | Used matched times and calculated the difference correctly | Keep an observation distinct from a scientific explanation |
Use examples from your child’s actual work if you want to talk to a teacher. The fictional exercises here can help identify a question, but the teacher will know the current classroom task and expected depth. Bring a first attempt and the part the child can now explain. Ask what a suitable next example would look like. The aim is to connect home practice to school learning.
When a command word changes the answer
Ask the child to respond to four versions of the same item. “State the final temperature” needs the recorded endpoint. “Calculate the temperature decrease” needs subtraction using the start and endpoint. “Compare the decreases” needs both changes and their relationship. “Suggest why the decreases differ” needs a scientific explanation appropriate to the taught context. The same table supplies evidence, but the requested thinking changes.
A task may also constrain the form. “Use two values from the table” requires two relevant values. “Give one limitation” asks for one supported limitation, with enough explanation to show why it matters. “Write a message to a visitor” needs information organised for that visitor’s action. Encourage the child to check the completed response against the full instruction before adding more detail.
Choose the next exercise from the error
A wrong answer can begin with a correct skill. The learner may subtract accurately after choosing the wrong time, calculate a percentage correctly for the wrong group or write a fluent reason about a quantity never measured. Keep the part they understood and repair the point where the meaning changed. Ask them to explain the difference between their original answer and the revised one. That explanation can be more revealing than completing several similar calculations.
If your child keeps selecting the grand total, use two questions from the survey table and physically cover the irrelevant groups. For the morning percentage, leave the morning row visible. For the percentage of bottle users attending in the afternoon, leave the bottle column visible. Once the child can explain each denominator, uncover the table and repeat with fresh wording. The temporary support gives them a way to recognise a condition in the question.
If the problem is an overconfident conclusion, ask what information would settle it. To describe demonstration attendance, the class needs demonstration attendance records. To compare waiting times, it needs waiting-time measurements under the specified conditions. To claim a change in speed, it needs a suitable measure of time. The child can then write an answer stating what is known and a question about what remains unknown.
If the issue is an answer that ignores the reader, change the audience. A visitor needs the session time and booking action. The organiser may need a count or a reason to change the arrangement. A teacher marking a calculation needs enough working to see how the student found the result. Let your child choose the evidence each reader needs and explain why a detail belongs in the response. The same data can support different useful answers when the task and audience change.
Before the fresh task, ask your child which checkpoint they want to remember. Write their choice in their own words. It could be “choose the group before the denominator” or “find the measured quantity before explaining a pattern”. Let that reminder guide the next independent attempt.
Try a fresh task without looking at the model
A fictional club offers two activity sessions. The first begins at 3.20 pm and lasts 35 minutes. The second begins at 4.10 pm and lasts 35 minutes. Students should arrive five minutes before a session. A learner leaves school at 3.40 pm and needs 15 minutes to reach the venue. Ask which session they can reach under this timetable and what time they should be ready.
They reach the venue at 3.55 pm. They have missed the first session’s arrival time of 3.15 pm. For the second, they should arrive by 4.05 pm, so the stated journey gets them there ten minutes before that arrival deadline. They can reach the second session under the given timings. This answer uses the travel time, required arrival and session start as separate quantities.
Now give a small table. Session one has 18 respondents, of whom 12 prefer a written instruction. Session two has 24 respondents, of whom 12 prefer a written instruction. Ask whether the groups have the same percentage preference. They have the same count of 12, but 12 out of 18 is about 66.7% and 12 out of 24 is 50%. Ask the child to state the group in each answer.
Finish with a claim. “Written instructions make students finish faster because more session-one respondents preferred them.” The survey records a preference, without measuring completion time. It cannot support the claimed effect on speed. A better sentence states the observed preference and its group. If your child can explain that distinction, calculate the percentages and use the notice to plan the journey, they have practised three different uses of evidence from a small amount of information.