
How old was an animal when it died—and what, if anything, does that tell us about ancient hunting or herding? The gold standard of teaching zooarchaeological age-at-death analysis begins with observable teeth and bones, works through defensible age ranges, and ends with a historical interpretation that stays within the evidence.
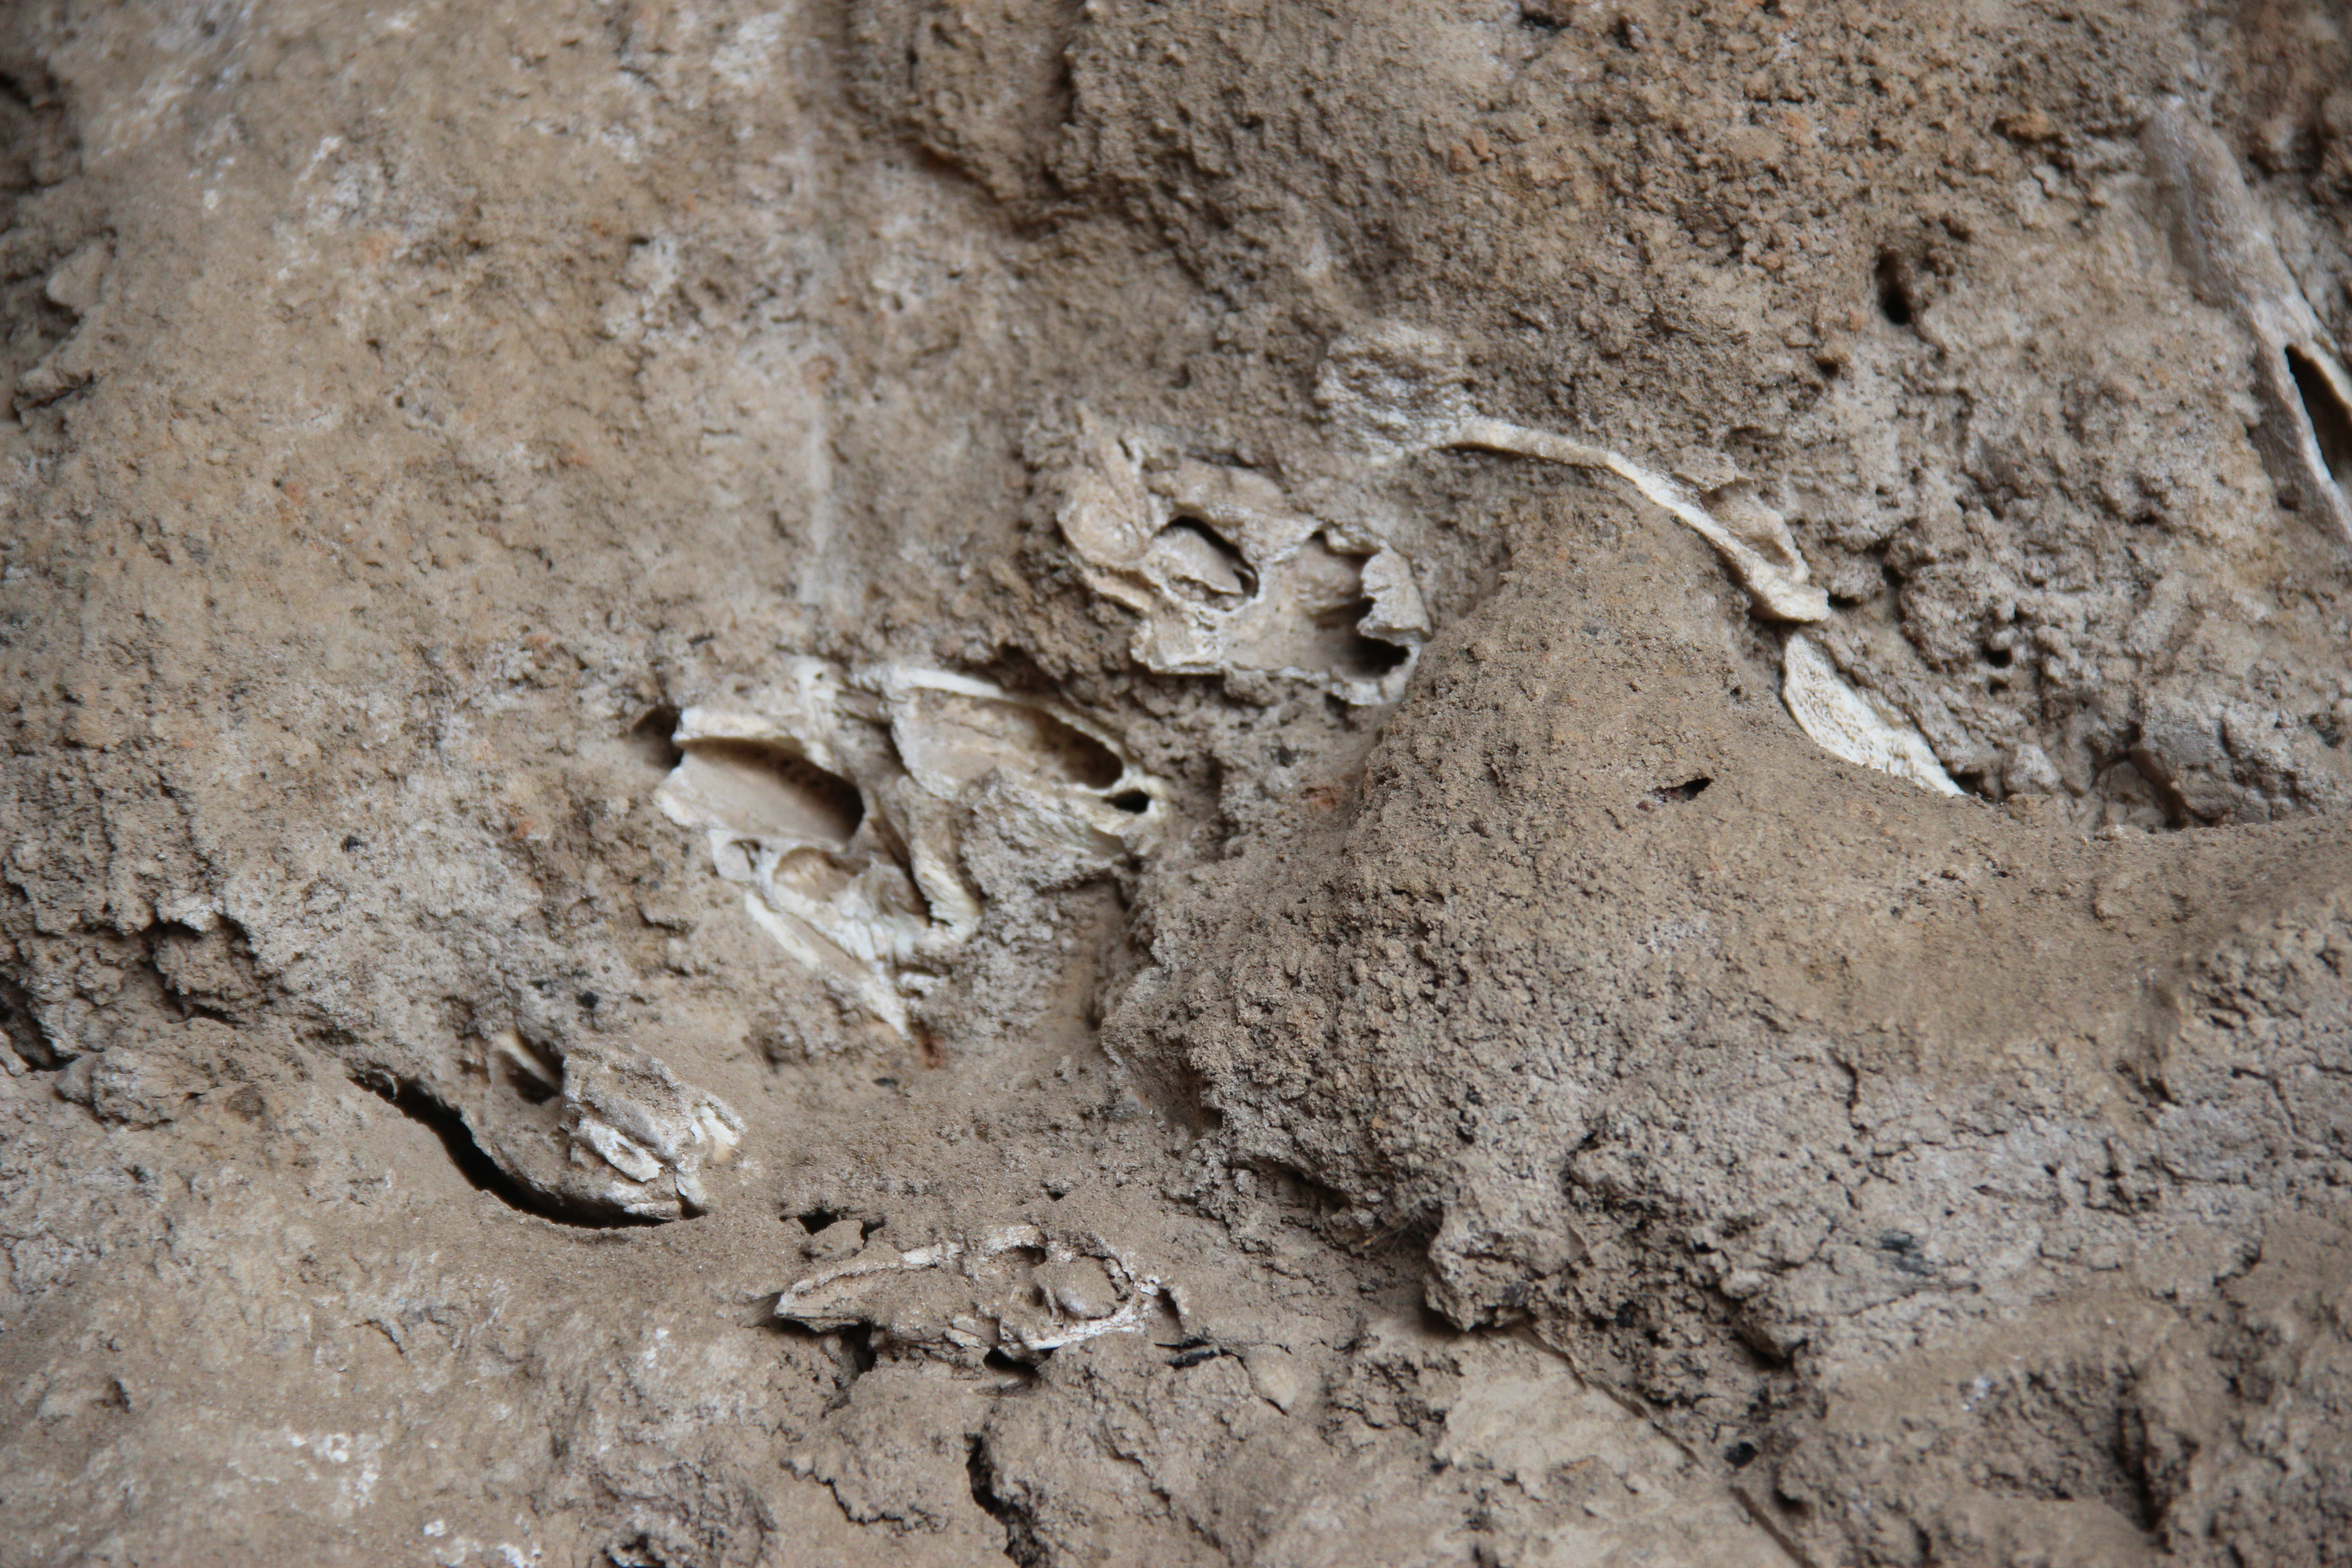
This guide uses the entirely fictional Riverside Yard specimen set for calculations. The featured photograph shows genuine archaeological animal bones from a different site; it is a reference image, not a record of the imaginary exercise.
For professional context, see Historic England’s animal-bones guidance and our Zooarchaeology teaching overview.


1. A mortality profile is not a ready-made story about farming
Zooarchaeological age-at-death analysis investigates how old an animal may have been when it died. Patterns across identified specimens can help evaluate hunting, slaughter, herd management and site formation. The first lesson is to distinguish an observed pattern of teeth and bone fusion from an explanation of why animals died. A collection containing many young animals might reflect selective slaughter, seasonal hunting, a catastrophe or selective preservation.
Students should open by writing the chain: anatomical identification, taxon, age indicator, calibrated age range, archaeological sample, mortality profile, interpretation. Each link can introduce uncertainty. A table of ages may be useful without proving that a settlement was dairying, specialised meat production or a particular type of pastoral economy.
2. Species and anatomical element come before age
A tooth-wear category for one species cannot simply be pasted onto another. Even within one taxon, eruption schedules and skeletal fusion depend on anatomical element and the reference population. Start with taxon and element identification using an appropriate comparative collection, then record uncertainty rather than converting a ‘probably caprine’ fragment into a precisely aged domestic sheep.
Teach the difference between a complete mandible, a loose molar, a proximal long-bone end and an unidentifiable shaft. Their information value is not interchangeable. Expert reference collections and osteological guides help students recognise which observable features support species, element, side and age.
3. Know how tooth eruption provides a developmental sequence
Young mammals develop and replace teeth in a reasonably ordered biological sequence. Dental eruption and replacement can often support broad age categories when suitable taxon-specific standards exist. Record exactly which tooth is present, whether it has emerged into wear and whether the jaw position is secure. An isolated tooth may lose crucial context when it has detached from the mandible.
Challenge students with two diagrams: a partially erupted tooth in a jaw and an isolated tooth crown from a disturbed layer. Ask which observations remain defensible in each case. Do not assign a birthday from a single feature; a developmental range is usually more honest than a point age.
4. Read tooth wear without mistaking abrasion for a clock
Occlusal wear accumulates over life but is influenced by diet, abrasive particles, enamel structure and individual history. Species-specific scoring systems encode stages of wear and eruption rather than treating every worn crown as precisely dated. Surface damage after burial and breakage can disguise true wear. Scorers should follow a stated protocol and compare against modern reference material.
Use an exercise where two observers independently score the same set of mandible photographs. Rather than forcing agreement by discussion, first tabulate disagreements and identify which tooth or score boundary caused them. Repeat after standardising the criteria. Reproducibility is part of the finding, not an optional classroom nicety.
5. Understand epiphyseal fusion as a threshold
Many limb bones develop with growing ends that eventually fuse. Fusion can establish whether an animal survived beyond an approximate developmental threshold for that particular element. An unfused end indicates that fusion was not complete when the animal died, subject to correct identification and preservation. A fused end tells us it survived at least to the relevant stage but does not by itself say how long afterwards.
Different bones fuse at different stages, so the researcher must not pool all fused and unfused elements as though they share one age cut-off. Teach students to create separate element-specific fusion groups, with the reference interval and confidence written beside each group.
6. Distinguish an observed tooth sample from an entire death population
A sample of surviving jaws reflects what entered the deposit, what preserved, how it was excavated, and what the analyst could identify. Fragmented bones from butchered carcasses, secondary disposal and recovery screen size can all reshape the result. Young animals may be underrepresented if their small, fragile elements did not survive or were not collected.
Students should trace the path from an animal death to a recorded row in the spreadsheet. Missing individuals are not a footnote: they determine whether a proposed mortality curve is a plausible approximation of a herd’s history or a narrow description of the recovered material.
7. Choose and state the counting unit
NISP, the number of identified specimens, does not equal the number of animals. Multiple fragments can derive from one bone, while one individual can contribute many different elements. Minimum-number-of-elements and minimum-number-of-individuals methods answer related but distinct questions. A survivorship exercise needs a unit that is consistent with its age assignments and avoids counting one animal repeatedly without acknowledgement.
Give a tray with a right mandible and three loose teeth likely belonging to the same mandible. Counting every specimen as an independent animal produces a fictitious mortality profile. Students should explain their aggregation rule, element overlap and uncertainty before any percentage is calculated.
8. Work the fictional Riverside Yard tooth sample
In a hypothetical Riverside Yard assemblage, forty ageable caprine mandibles are classified using one documented reference system: twelve are placed in a broad juvenile category and twenty-eight in an adult category. Under those classifications, 12/40, or 30%, of the ageable mandibles are juvenile. This is a description of the recovered and aged mandibles, not proof that 30% of the whole herd died young.
The teaching data intentionally omit mandibles that were too damaged to score and any animals whose remains were never recovered. Ask learners which denominator belongs on the graph, whether right and left mandibles were combined appropriately, and how reclassification of three borderline jaws would affect the observed percentage.
9. Audit the fused and unfused sample separately
A second fictional dataset comprises thirty elements from a single anatomically matched fusion group. Twelve are unfused and eighteen are fused: 40% of scored elements are unfused at that developmental threshold. That 40% is not automatically a second estimate of juvenile mortality. It is a different indicator with a specific biological cut-off, perhaps sampled from partly different individuals.
Students must make a two-panel result: dental categories in one panel, fusion-group observations in another. Before comparison, ask whether the reference-age windows overlap, whether the elements come from the same excavation contexts and whether recovery differences explain the apparent disagreement.
10. Visualise sensitivity rather than hide classification choices
If three of the forty Riverside Yard mandibles are scored as borderline, reassigning all three between broad categories would move the observed juvenile share from 9/40 (22.5%) to 15/40 (37.5%), depending on the original classification scheme. This is a deliberately simplified sensitivity range, not a statistical confidence interval. It shows what the classification decisions alone can change.
An advanced exercise can add specimen-level uncertainty, stratigraphic mixing and sampling intervals. Students should never report a percentage to two decimals while leaving the scoring method unnamed. The uncertainty calculation must match the real sampling process and the question being asked.
Worked calculation: two indicators, different denominators
| Fictional sample | Observed groups | Arithmetic | Permissible description |
|---|---|---|---|
| Ageable caprine mandibles | 12 juvenile, 28 adult | 12/40 = 30% | Share of classified mandibles in one age category |
| Matched fusion group | 12 unfused, 18 fused | 12/30 = 40% | Share of elements still unfused at one stated threshold |
| Three borderline mandibles | Reclassification affects juvenile share | 9/40 to 15/40 = 22.5–37.5% | Sensitivity demonstration, not a confidence interval |
11. Reconstruct mortality before proposing human motives
A concentration of juveniles may be consistent with certain herd-management objectives; older-animal survival could be compatible with continued reproduction, traction or other husbandry choices. But selective hunting, predators, natural deaths, ritual deposition and refuse disposal may generate different assemblages. Seasonality and multiple occupations complicate the picture further.
Good teaching asks for a falsifiable alternative. If someone proposes seasonal culling, what independent evidence would help? Stratigraphic separation, species-specific seasonal tooth development, isotopic studies and comparisons across contexts may contribute, but no one age curve can select an economic strategy without other data.
12. Combine profiles with context, pathology and taphonomy
Cut marks, burning, butchery patterns and skeletal-part representation can help distinguish food refuse from whole carcass disposal or unusual deposits. They too must be interpreted cautiously: similar marks may arise through different activities. Context, contemporaneity and formation processes are often decisive.
Introduce a simple disagreement: an age profile suggests routine herd culling, but the same layer contains articulated skeletons without butchery marks. Instead of discarding one observation, students should revise the working model and ask whether two phases or two kinds of deposition were mixed in excavation.
13. Calibrate against species, population and reference limits
Growth rates and tooth wear are biological, not universal mechanical clocks. Historic England’s cattle study demonstrated that tooth and fusion approaches could give different results in a tiny sample. Modern known-age material supports age ranges, but its relevance depends on taxon, environment, diet and the archaeology under study.
Explain the distinction between an observation score and the age interval inferred from a reference. If the reference population is poorly matched, report the methodological limitation and avoid claiming exact months. Where a dataset is small, separate what can be said about that assemblage from any proposed general pattern.
14. Make recording and archive recovery part of the lesson
Students should identify specimens with durable catalogue codes and record provenience, side, element, taxon confidence, fragmentation, fusion state, wear score, preservation, photographs and analyst identity. Images with scales can help later checking; the original material should be handled and retained according to archaeological collection and conservation requirements.
An attractive graph without linked raw observations is not a reproducible result. Require learners to submit both a short interpretation and a data dictionary explaining each field. A later reviewer should be able to recalculate the percentages and understand exactly which specimens were excluded.
15. Transfer the method to a mixed hunting assemblage
Now change the setting. A fictional cave contains red deer, caprines and fragmented bones whose species are uncertain. The tooth-wear standards and fusion thresholds used for the Riverside Yard caprines no longer apply indiscriminately. Students must separate taxa, reconsider the reference data and identify elements that cannot be aged reliably.
The strongest answer may give one narrow caprine profile and an explicitly incomplete deer description rather than a grand ‘all animals’ mortality curve. This transfer checks whether students learned a scientific principle instead of memorising one spreadsheet procedure.
16. Assess interpretation, transparency and ability to change course
Use four scoring dimensions: correct anatomical recording, explicit reference-based age intervals, sound denominators and alternative historical explanations. Award higher marks for reproducible decisions, acknowledgement of contradictory indicators, and identification of the next useful sample. Penalise false precision and confusing a fragment count with a population count.
The gold standard is not a student who can instantly name a herding strategy. It is a student who can show how dental wear and fusion observations constrain possibilities, and who knows when the deposit will not support a stronger conclusion.
How to teach this in four structured seminars
- Seminar 1: anatomical identification, reference collections and reliable specimen records.
- Seminar 2: tooth eruption, tooth wear and fusion thresholds with independent scoring.
- Seminar 3: age-profile calculations, honest denominators and a reproducibility audit.
- Seminar 4: competing interpretations, archive reporting and transfer to another taxon.
What an excellent student report contains
- Catalogue and context for every observed bone or tooth.
- Taxonomic confidence, element, side, preservation and scoring protocol.
- Reference population and age interval rather than unexplained exact dates.
- Transparent specimen counts and individual-estimation assumptions.
- Alternative explanations for the observed mortality pattern.
- A conclusion tied to the available evidence and the next data needed.
Frequently asked questions
Are NISP and number of animals the same?
No. One animal can contribute many identifiable fragments, and fragmentation can raise NISP. Report the unit and aggregation rule.
Can fused bones provide an exact death age?
Usually not. Fusion is commonly a developmental threshold or interval, and fused specimens can be older by widely differing amounts.
Do adult-heavy assemblages prove dairy production?
No. Several economic and non-economic processes may yield adult-dominated profiles. Context and independent data matter.
Why might tooth and fusion profiles disagree?
Different age thresholds, taxon-specific growth, skeletal-part representation, preservation, sampling and scoring are possible causes.
What does 30% juvenile mean in the worked example?
Exactly 12 of 40 ageable fictional mandibles were assigned to the study’s juvenile category; it does not establish herd-wide juvenile mortality.
Should unageable remains be discarded from the archive?
No. Record why they could not be aged, retain appropriate material and allow future re-examination.
Authoritative sources and connected articles
- Historic England, Animal Bones and Archaeology: Recovery to Archive (2019)
- Historic England, Zooarchaeology research (updated 2026)
- Greenfield and Arnold, sheep/goat tooth eruption and wear reference (2008)
- PLOS One, suid age estimation using tooth wear and fusion
- Historic England, cattle tooth and epiphyseal fusion age comparison
- The Gold Standard of Teaching Zooarchaeology
- The Gold Standard of Teaching ZooMS
- The Gold Standard of Archaeology
- Gold Standard master hub
The gold standard of teaching zooarchaeological age-at-death analysis is the ability to move from measured anatomy to calibrated biological intervals, then to a testable—but not overstated—history of the animals and people who shared a landscape.