
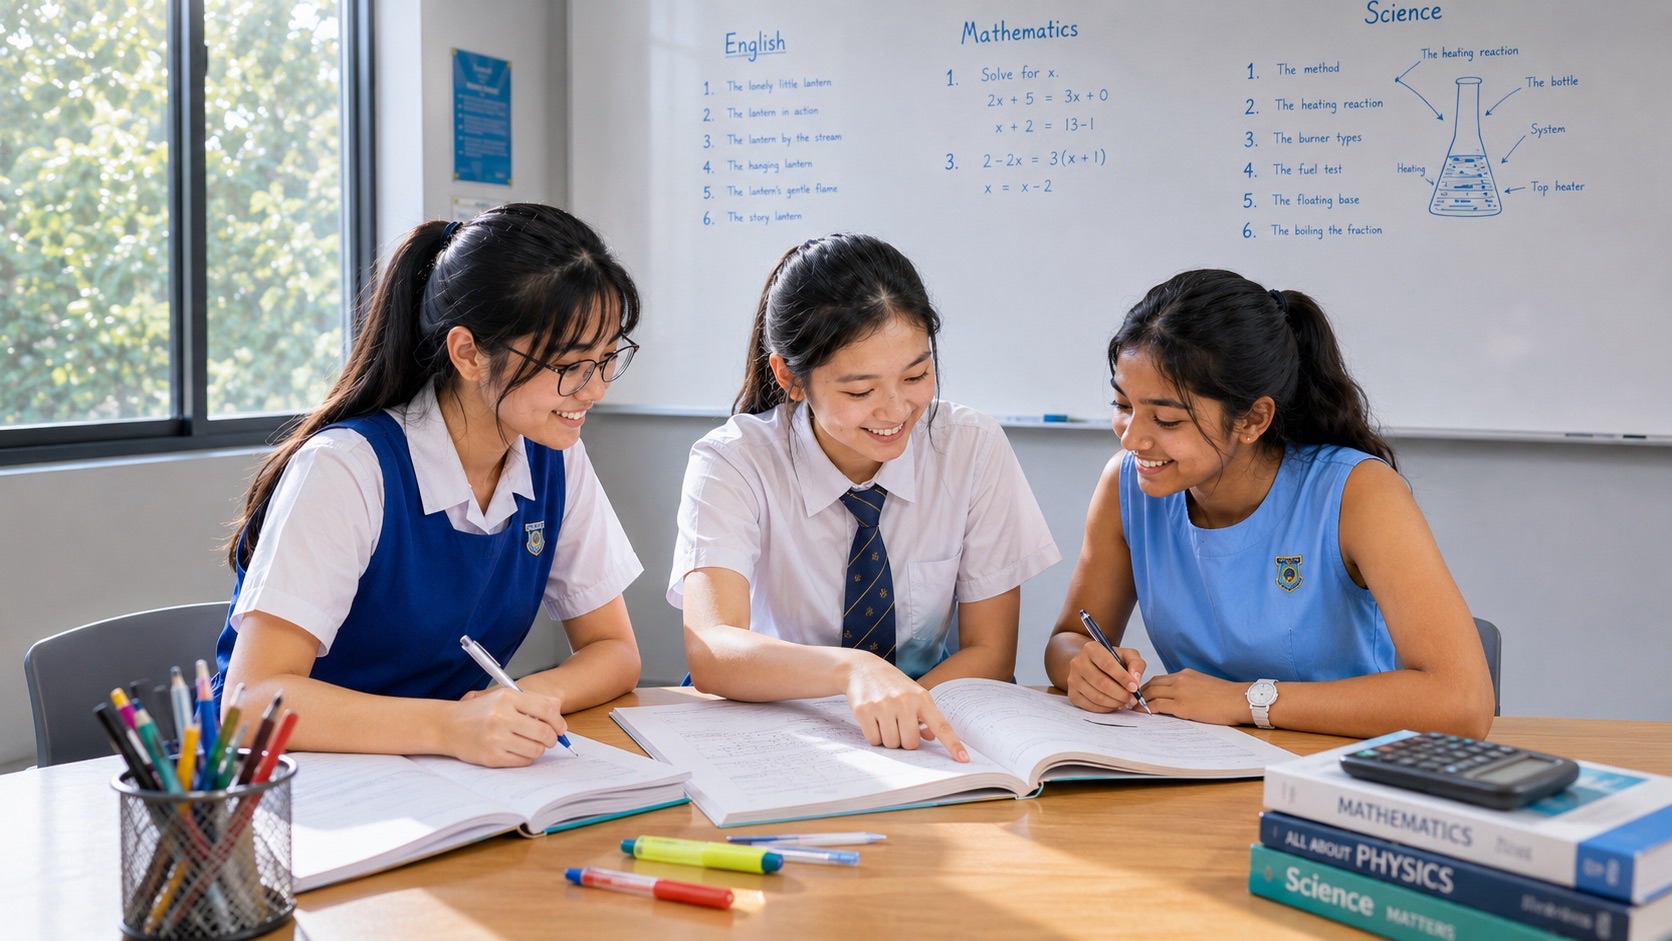
Secondary 2 G2 Mathematics goes beyond algebra. Students also learn properties of polygons and quadrilaterals, congruent and similar figures, Pythagoras’ theorem, surface area and volume, data displays, averages and probability. These are part of the MOE G2 syllabus, and they are assessed by schools during Secondary 2 rather than through a national Secondary 2 SEC examination.
For parents, the best approach is to help the child move from a memorised formula to a defensible choice of formula. A small diagram, clearly labelled measurements, an explanation and a unit check often prevent more errors than another rushed worksheet. This guide shows how to work through the strands carefully without assuming that every school follows the same chapter order.
- Geometry: identify the property before carrying out a calculation.
- Similarity and scale: match corresponding sides and read map scales correctly.
- Measurement: distinguish perimeter, area, surface area and volume, with correct units.
- Data: interpret a chart and use mean, median or mode appropriately.
- Probability: define the possible outcomes and count favourable outcomes for a single event.
- Parent action: request the actual school scope and review diagrams and written reasons, not just final answers.
1. Why diagrams are a language, not decoration
A geometry diagram is a compact record of relationships. Equal lengths, parallel lines, a right angle and the dimensions of a solid each provide information that can justify a mathematical step. A common Secondary 2 problem is that the student recognises the topic but does not know which fact in the diagram allows a particular conclusion.
Teach a consistent sequence: circle the question, mark the givens, identify the relevant property, calculate, and check whether the result is possible. This order is useful in quadrilaterals, similarity, scale and three-dimensional measurement. It also improves written explanations in Mathematics and evidence-based reasoning in Science.
2. Polygon and quadrilateral properties: start from definitions
A rectangle has four right angles; a rhombus has four equal sides; a square has both sets of properties. A child who memorises only pictures may fail to recognise a tilted square or a trapezium in a differently oriented question. Use definitions and counterexamples. Ask: Is every square a rectangle? Yes. Is every rectangle a square? No, not necessarily.
For a convex polygon with n sides, the sum of interior angles is (n − 2) × 180°. Thus a hexagon has an interior-angle sum of 720°. If the hexagon is regular, each interior angle is 720° ÷ 6 = 120°. The formula is more useful when students see why a polygon can be divided into n − 2 triangles.
A parent’s two-minute test
- Draw a rectangle, a rhombus and a square in unconventional orientations.
- Ask the student to name the defining property rather than just recognise the shape.
- Change one property and ask whether the shape still belongs to the same category.
- For a polygon, ask the child to draw diagonals from one vertex and explain the triangle count.
3. Congruence and similarity: two ideas that must not be mixed
Congruent figures have the same shape and size. Similar figures have the same shape, but their corresponding lengths may be scaled by a common factor. For triangles, equal corresponding angles and proportional corresponding sides are central. The first challenge is usually not arithmetic; it is matching the correct corners and sides.
Suppose the shorter side of one similar triangle is 4 cm and the corresponding side of the other is 10 cm. The length scale factor is 10 ÷ 4 = 2.5. A 6 cm corresponding side in the first triangle becomes 15 cm in the second. That reasoning is safer than taking an unrelated pair of sides and writing a proportion.
For a map marked 1 : 50,000, each 1 cm on the map represents 50,000 cm on the ground. A measured 3.2 cm corresponds to 160,000 cm, or 1.6 km. Ask students to annotate the units before converting; many scale errors are unit errors rather than poor multiplication.
4. Pythagoras’ theorem: when is it admissible?
Pythagoras’ theorem applies to a right-angled triangle: the square of the hypotenuse equals the sum of the squares of the shorter sides. If the perpendicular sides measure 6 cm and 8 cm, the hypotenuse is √(6² + 8²) = √100 = 10 cm. A diagram that is merely drawn to look right-angled does not automatically justify using the theorem; the question must give or establish that fact.
The converse also helps test whether a triangle is right-angled. For sides 5, 12 and 13, 5² + 12² = 13², so the triangle is right-angled. When a child writes 6² + 8² = 10² but labels the wrong side as hypotenuse, the first repair is to identify the longest side opposite the right angle.
5. Surface area and volume: units expose conceptual errors
Area covers a two-dimensional region and is expressed in square units. Surface area adds up the exposed faces of a three-dimensional object and is also measured in square units. Volume measures the space inside a solid and is measured in cubic units. These differences must be taught before formula memorisation.
For a sphere with radius 3 cm, its surface area is 4πr² = 36π cm² and its volume is (4/3)πr³ = 36π cm³. The numerical coefficients happen to be equal here, but the quantities are not interchangeable. Ask the student to explain why the units are different; this reveals more understanding than recalling either formula by name.
The G2 Secondary 2 syllabus also includes pyramids and cones. In a composite solid, ask the child which surfaces are exposed and which faces are hidden at the join. Surface area may require subtraction of the joining face; volume may require addition or subtraction of component volumes. A sketch and a labelled plan are essential.
6. How data handling changes Mathematics into interpretation
Secondary 2 G2 includes dot diagrams, histograms and stem-and-leaf diagrams, together with measures of central tendency: mean, median and mode. These are more than methods of drawing. The question is what the data show, what they hide and whether a conclusion is justified.
For the five values 2, 3, 3, 5 and 7, the mean is (2 + 3 + 3 + 5 + 7)/5 = 4, the median is 3 and the mode is 3. None of those answers is automatically the ‘best’ average. For a set with an extreme outlier, the median may be a more representative summary of a typical observation than the mean.
When reading a histogram, students must look at bin boundaries and scales; they cannot infer precise individual values from a grouped chart. For grouped data, the school may teach estimated means using class midpoints. Ask the teacher or textbook which convention and notation the school uses.
7. Probability: define the experiment before calculating
In a bag containing three red and two blue identical counters, if one counter is selected at random and each counter is equally likely, the probability of red is 3/5. The result follows from the ratio of favourable outcomes to all possible equally likely outcomes. If the selection process is biased, that simple count may no longer model the experiment accurately.
A good question for the student is not just ‘What is the probability?’ but ‘What outcome are you counting, what are the possible outcomes, and what assumptions make the calculation valid?’ That reasoning transfers to data interpretation, scientific experiments and later probability topics.
8. A real-life problem-solving loop for Mathematics and Science
- Frame: what is the practical problem? Example: estimate a walking distance on a map or the volume of a storage container.
- Represent: draw the figure or organise measurements and units in a table.
- Choose: identify a relevant theorem, proportional relationship or statistical measure.
- Calculate: show the steps in an order that can be checked.
- Interpret: return to the actual situation. Would this distance, price, volume or probability make sense?
- Communicate: write a complete conclusion with units and assumptions.
The transfer from Mathematics to Science becomes clearer when the student learns to read scales, choose representations and explain evidence. A Science graph may require the same coordinate and proportional reasoning learned in Mathematics. That is a reason to strengthen understanding rather than train isolated tricks.
9. A gentle geometry and data practice schedule
| Day | Short task | Success check |
|---|---|---|
| Monday | One polygon property and one counterexample | Student names the property in words |
| Tuesday | One similarity or map-scale problem | Corresponding lengths and units are labelled |
| Wednesday | One right-triangle and one solid-measurement problem | Theorem or formula is justified; units are correct |
| Thursday | Create and interpret a small set of data | Mean, median and mode are calculated and compared |
| Friday | A single-event probability and one mixed word problem | Sample space and assumptions are explained |
| Weekend | Redo errors from the week, then stop | Corrections survive without referring to the model answer |
These are examples of short retrieval sessions, not another tuition timetable. A student with heavy CCA or who already has effective school support can shorten the plan. Regular, focused explanation matters more than hours spent copying model answers.
10. Mistakes a tutor or parent should diagnose
| Visible mistake | Likely misunderstanding | Better response |
|---|---|---|
| Using an angle-sum formula on the wrong polygon | Shape identification and counting sides | Trace the vertices before counting n |
| Matching non-corresponding sides | Similarity is treated as free-form ratio | Mark equal angles and pair vertices in the same order |
| Applying Pythagoras without a right angle | The theorem’s condition is ignored | Identify or establish the right angle first |
| Writing cm³ after an area answer | Dimensions are confused | Explain area versus volume with a physical object |
| Choosing the mean automatically | Data summaries are memorised without context | Discuss how an outlier changes the picture |
| Counting an event without defining outcomes | Probability assumed without sample space | List the equally likely outcomes explicitly |
11. What will this mean for future subject choices?
A G2 Mathematics learner who enjoys geometric reasoning, measurement or graphs may find related ideas in Science, Design and Technology, computing and some applied pathways. This is not a promise of admission to a particular course; admission criteria later depend on examination performance, the full subject combination and updated post-secondary rules.
If a student wishes to attempt more demanding Mathematics, discuss the evidence with the school. Secondary 2 provides a useful checkpoint, but an individual school’s policies determine opportunities to offer subjects at G3 and which upper-secondary electives are available. SEC G2 Mathematics K210 is a later examination, not a Secondary 2 paper.
Frequently asked questions
Are Pythagoras, similarity and statistics definitely in Sec 2 G2?
They appear in the official MOE Secondary 2 G2 curriculum. The order, time devoted and local assessment emphasis can differ across schools. Ask for the current topic list to avoid practising the wrong chapter ahead of a test.
Should my child memorise formulas first?
The student should know the applicable formulas but also understand when they are valid and what each variable and unit represents. Memory without conditions often leads to plausible-looking but wrong answers.
Does this article replace the school’s instructions?
No. It is a parent-facing interpretation of published syllabus material. Your child’s teacher and the most recent school assessment scope should decide what is prioritised this week.
Sources to check, and how to use this guide responsibly
This guide draws on the Ministry of Education G2 Mathematics syllabus, the Yishun Secondary School 2026 Sec 2 G2 Mathematics topic outline as a real-school example, SEAB’s official SEC explanation, and the SEAB 2027 G2 Mathematics K210 examination listing. The MOE syllabus is the authority for content; SEAB controls examination details; your own school controls its current assessment schedule and subject-level decisions.
eduKateSG’s original Secondary 1 Clementi small-group Mathematics tutorial reference describes the patient first-principles approach, checking students’ reasoning and a 3-pax weekly 1.5-hour structure. It is a possible form of support, not a condition for academic success. Consult the child’s school before assuming more tuition is the answer.
Continue the SEC Sec 2 G2 Mathematics parent series
- Syllabus, assessments and SEC K210
- Algebra, graphs and simultaneous equations
- Geometry, measurement, statistics and probability
- School assessments, G3 readiness and Sec 3 choices
- Secondary 2 Mathematics: Full SBB G1, G2 and G3 syllabus comparison