
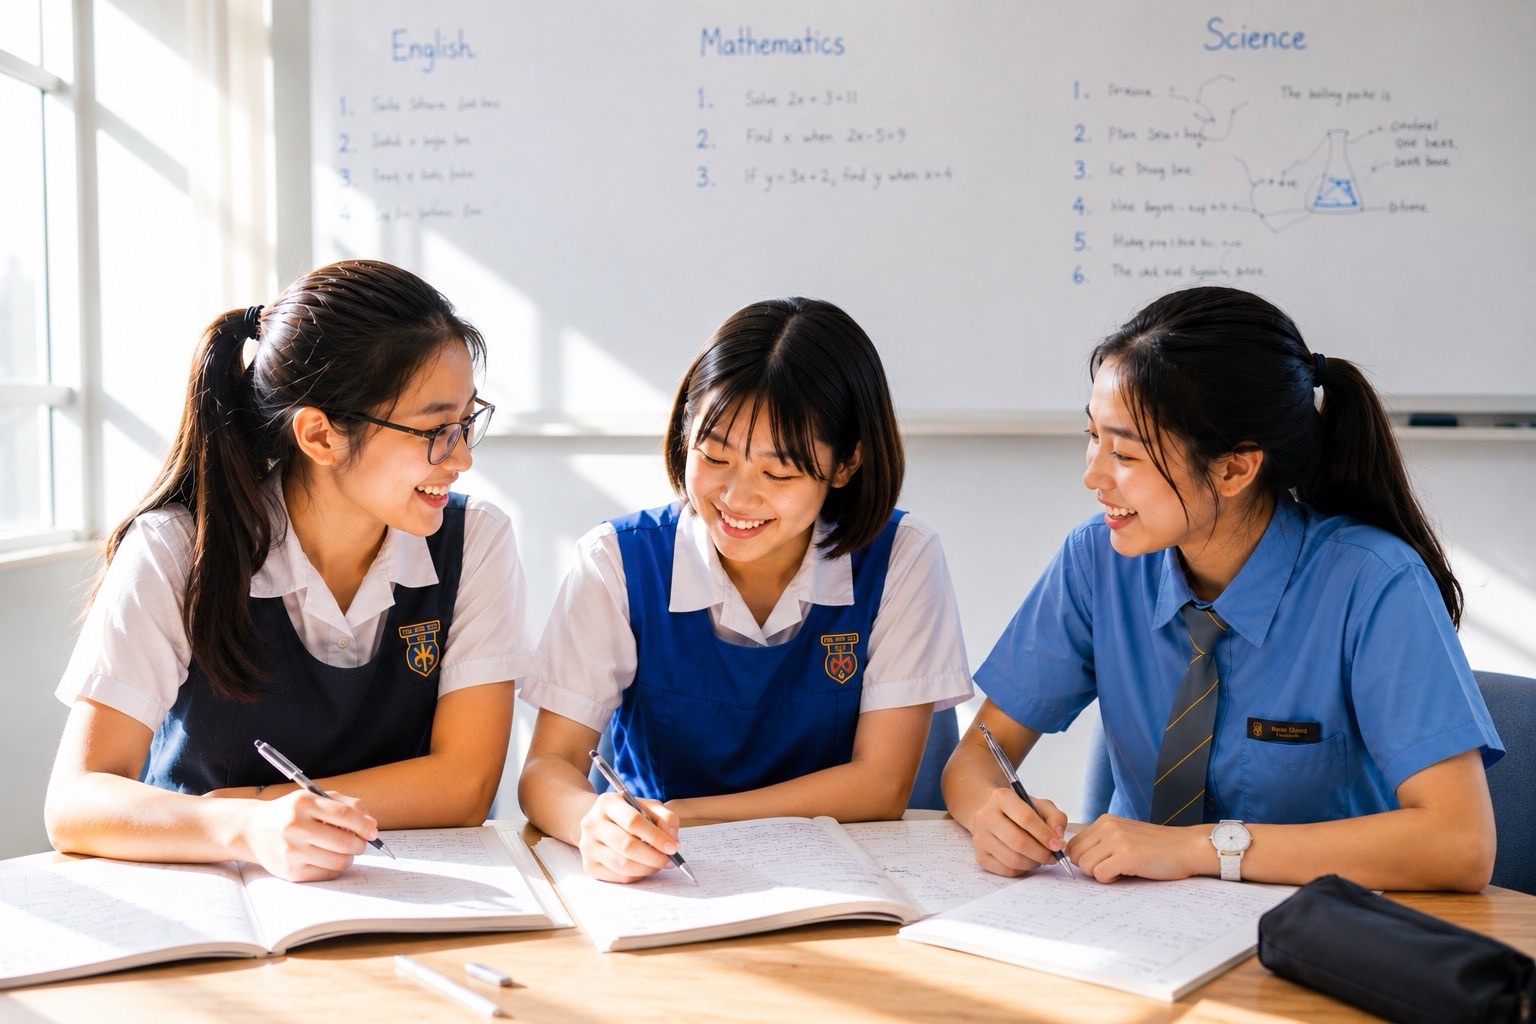
What is SEC Secondary 3 G2 Mathematics beyond algebra? It is a subject that asks students to reason with shapes, measurement, coordinates, information and chance—not simply perform calculations. In the 2027 Singapore–Cambridge Secondary Education Certificate (SEC), G2 Mathematics is K210. The published syllabus includes Geometry and Measurement as well as Statistics and Probability. A parent evaluating whether the subject suits a child should look for growing accuracy in reading a diagram or dataset, selecting a method and explaining what the result means.
The sensible approach is to teach from first principles, use the child’s actual school exercises and build confidence by checking each step before increasing difficulty. This follows eduKateSG’s immutable Clementi Mathematics teaching reference: deliver useful information immediately, diagnose the real difficulty, rebuild the missing relationship and release the student to independent work. The K210 document describes a complete examination course, not a fixed list of Secondary 3-only chapters. Each school decides its year-by-year sequence and parents should verify that sequence and the student’s SEC examination year.
- Subject: Secondary 3 Mathematics at G2 level, in preparation for the end-of-Secondary-4 SEC.
- Official 2027 SEC Mathematics code: K210; G2 Additional Mathematics K232 is a different subject.
- Geometry includes angles, similarity, circles, trigonometry, mensuration and coordinate geometry.
- Statistics includes reading displays, averages, measures of spread and comparisons between datasets.
- Probability requires a careful description of possible outcomes and event relationships.
- Real-world problems may combine several topics, so reading, working and checking are as important as formulas.
- School chapter order varies; use these examples as teaching guidance, not an official Secondary 3 timetable.
The overlooked problem: mathematics needs interpretation
A child can calculate correctly and still get a geometry question wrong. Perhaps a 35-degree angle was measured from the wrong line, a similar triangle was matched to the wrong side, or a ruler showed centimetres while the question asked for metres. A statistics question can fail in the same way: the student computes a mean accurately but answers a question that asked for the median. These are not merely careless arithmetic mistakes. They reveal a missing habit of interpreting the structure and context before applying a procedure.
Secondary 3 is an appropriate time to build a disciplined order: read, annotate, identify, model, calculate, interpret and check. The first three stages are often invisible in a polished textbook answer, yet they make the last three possible. Parents can reinforce these steps without becoming experts in every geometric theorem. Ask your child to point to the stated information, explain what is unknown and name the reason for the chosen method. A calm explanation of the first step is a better sign of understanding than fast calculator use.
1. Read the official K210 course map accurately
The SEAB K210 2027 G2 Mathematics syllabus has three main content strands: Number and Algebra, Geometry and Measurement, and Statistics and Probability. It explicitly includes problems in real-world contexts, such as travel plans, household finance, timetables, navigation and data from graphs. The content across these strands may be combined in a question. For parents, this is a reminder that understanding one chapter in isolation is necessary but not sufficient. A student must learn to select a technique when the paper does not provide a chapter heading.
The document contains content studied across the secondary years. Some geometric ideas, such as basic angle properties, may be introduced earlier and reused at a more demanding level. Others may appear later depending on school pacing. It would be misleading to call every listed topic a compulsory Secondary 3 Term 1 topic. Ask the teacher for the actual unit plan, the rules for the school assessments and the level of familiarity expected by the next test. Use the national document to see how today’s concept fits the eventual course.
2. Geometry begins with what the diagram really tells us
A figure on paper may appear to have a right angle or equal sides, but appearances are not proof. Students should use the stated markings and facts. If a question says two lines are parallel, the student may apply corresponding or alternate angle relationships, but must identify which angles are connected and why. If a triangle looks isosceles without any supporting information, the equal sides must not simply be assumed. This habit separates geometry from guesswork. It also helps students communicate reasons clearly, an assessed skill in Mathematics.
A parent can perform a simple exercise. Cover the solution to a geometry problem and ask the child to list the facts that are genuinely supplied. Then ask what new fact can be deduced from each. The student might say that vertically opposite angles are equal, or that angles in a triangle sum to 180 degrees. Have them connect each deduction with a reason. If they cannot name it, pause before doing the arithmetic. The missing skill is likely recognising a property rather than using a calculator.
3. Similarity and congruence: the difference matters
Two congruent figures have the same shape and size. Similar figures have the same shape but may have different sizes, with corresponding angles equal and corresponding sides in proportion. Imagine a small triangle with sides 3, 4 and 5 centimetres, and a similar triangle twice as large. The corresponding sides of the larger triangle are 6, 8 and 10 centimetres. The length scale factor is 2, but its area is four times the area of the small triangle. That distinction is the key lesson, not the arithmetic.
If a child uses a length ratio to compare areas, ask them to draw a rectangle that is twice as wide and twice as tall. The new area is four times as large. This visual check helps them understand why area depends on two dimensions. For similar solids, volumes depend on three dimensions, although particular syllabus expectations should be checked. Geometry becomes more reliable when the student locates the correct corresponding parts before inserting numbers into a proportion. A wrong pairing can produce a plausible-looking answer that is still mathematically invalid.
4. Pythagoras’ theorem: know when a right angle is required
For a right-angled triangle with perpendicular sides of 6 cm and 8 cm, the hypotenuse has length √(6² + 8²) = √100 = 10 cm. The longest side is opposite the right angle. If the triangle is not right-angled, this calculation is not automatically valid. Ask the child to mark the right angle, identify which side is opposite it and only then name the theorem. A student who simply squares every number shown on a diagram may not yet understand the condition for applying the method.
The theorem can also be used to check whether a triangle with sides 6, 8 and 10 is right-angled: 6² + 8² = 10². When students study distances between two coordinate points, the same relationship appears inside a constructed right-angled triangle. This connection matters because it turns a familiar geometry rule into a tool for coordinates, maps and practical measurements. Encourage your child to draw the helpful right triangle instead of memorising a disconnected distance formula.
5. Trigonometric ratios are descriptions of a triangle
In a right-angled triangle, sine, cosine and tangent relate an acute angle to ratios of side lengths. If an angle θ has opposite side 6 cm and adjacent side 8 cm, tan θ = 6/8 = 0.75, so θ is about 36.9 degrees to one decimal place. Before using the calculator’s inverse tangent function, the student must understand which side is opposite and which is adjacent to the angle. Changing the reference angle changes those descriptions even if the triangle stays exactly the same.
Ask the child to label the angle first, then describe each side in relation to it. A mnemonic can support memory but does not replace orientation. If the student becomes confused about elevation or depression, draw a horizontal reference and describe the line of sight. For bearings, draw north and follow the convention specified by the question. These diagrams protect the student from errors that an electronic calculator will never detect. Good trigonometry starts with clear geometry and ends with an answer whose size seems reasonable.
6. More general triangles: know the matching pairs
For triangles that are not right-angled, the K210 syllabus includes the sine rule and cosine rule. The sine rule links each side to the sine of the opposite angle. If one side is 10 cm opposite a 30-degree angle, and another side is opposite 45 degrees, the second length is 10 × sin45° / sin30°, approximately 14.1 cm to three significant figures. The critical step is matching each angle with its opposite side. Students who put the lengths and angles in different orders may calculate an answer with no valid geometric meaning.
The cosine rule is useful when two sides and the included angle are known, among other cases. For sides 5 cm and 7 cm enclosing 60 degrees, the opposite side c satisfies c² = 5² + 7² – 2 × 5 × 7 × cos60°, giving c² = 39 and c ≈ 6.24 cm. A useful estimation check is that the unknown side should be between the difference and sum of the given sides. Parents need not demand instant memorisation of every formula; ask the child to mark given information and justify why the chosen rule fits.
7. Circle geometry: every theorem has a condition
A chord, radius, tangent and angle at the circumference describe different relationships. If an angle at the centre subtending an arc is 100 degrees, an angle at the circumference subtending the same arc is 50 degrees. However, this rule depends on which arc and angles are involved. Merely seeing 100 and 50 in a diagram does not prove it. Similarly, a radius to a point of tangency is perpendicular to the tangent at that point, but a line that only looks tangent may need evidence.
Build a small theorem bank using diagrams. Each entry should contain the statement, conditions, a clear sketch and one deliberately misleading sketch where the condition is absent. For example, draw a line through a circle and ask whether it is a tangent; then draw a true tangent and mark its point of contact. Students begin to understand that mathematical reasons are conditional. A parent can praise a child for correctly refusing to apply a theorem. Resisting an invalid shortcut is a sign of growing mathematical maturity.
8. Mensuration: dimensions, units and compound shapes
Perimeter measures length, area measures two-dimensional surface and volume measures three-dimensional capacity or space. A student who writes square centimetres for a volume calculation has not finished the problem correctly, even if the number is right. For a cylinder with radius 3 cm and height 10 cm, volume equals πr²h = 90π cm³, approximately 283 cm³ to three significant figures. The radius is not the diameter; if the question gives a diameter of 6 cm, halve it before substitution.
Composite figures add another layer: the student must decide whether to add or subtract component areas or volumes. Ask the child to shade the part being found. When converting units, remind them that one metre is 100 centimetres, but one square metre is 10,000 square centimetres and one cubic metre is 1,000,000 cubic centimetres. The change in power is fundamental. Do not teach unit conversion as a decoration added after the calculation. Units are evidence that the quantities and formula agree.
9. Sectors and radians without fear
A 90-degree sector of a circle with radius 8 cm occupies one quarter of the circle. Its area is (90/360) × π × 8² = 16π cm², and its arc length is (90/360) × 2π × 8 = 4π cm. The fractions express part of a whole circle, so students can check whether the answer is sensible. For instance, the arc length must be less than the full circumference. This reasoning works even before the student has learnt any radian formula.
The K210 course also includes radian measure. Because 180 degrees equals π radians, 90 degrees equals π/2 radians. Arc length can be calculated as rθ when θ is in radians: for radius 8 and θ = π/2, the result is again 4π cm. The two methods describe the same geometry. A common error is to insert 90 into rθ as though 90 were a radian value. Teach the child to identify the angle unit before choosing the form of the formula.
10. Coordinate geometry is geometry written in numbers
Suppose A = (1,2) and B = (4,6). From A to B, the horizontal change is 3 and the vertical change is 4. These form the perpendicular sides of a right triangle, so AB = √(3² + 4²) = 5 units. The gradient of AB is 4/3 because it is vertical change divided by horizontal change. The same pair of points therefore supports a distance question and a gradient question, but the answers describe different properties. Students must read what the question is requesting.
A straight line can be represented by y = mx + c, with m describing gradient and c its intercept on the vertical axis. Students who copy an equation but cannot explain the meaning of m are vulnerable when a question is written in words. Practise with a small table, then two plotted points, then the equation. If the horizontal axis measures hours and the vertical axis measures kilometres, the gradient’s units become kilometres per hour. The symbols should acquire physical meaning where the context allows.
11. Statistics begins with the question being asked
Consider the five numbers 2, 3, 3, 4 and 18. Their sum is 30, so the mean is 6. The middle value is 3, so the median is 3, and 3 is also the mode. Which number is the best summary? That depends on the question. The unusually large value of 18 pulls the mean upwards while the median remains at the centre of the ordered data. A student who can calculate all three but cannot explain the difference is not yet reasoning about the dataset.
Parents can use everyday examples: journey times, sports scores, daily reading minutes or prices of items. Ask what a ‘typical’ value would mean in that context. One advantage of these examples is that children can test their intuitions. They may recognise that an average affected by an unusual day tells a different story from the middle value. A good statistics lesson connects calculation to interpretation instead of asking students to memorise definitions in isolation.
12. Choose the right data display
Tables, bar graphs, line graphs, pie charts, histograms, cumulative frequency diagrams and box-and-whisker plots can communicate different aspects of data. A line graph may help show change over time. A bar chart may compare categories. A box plot can help compare median and spread. The K210 syllabus includes different representations and asks students to analyse what they show. Parents should not assume that every diagram is equally appropriate for every dataset or that familiarity with a graph’s shape means the child can interpret it.
A deceptively simple graph-reading question can expose weak numeracy. The vertical axis might count in twos, tens or hundreds; the first visible label might not be zero. Ask the child to point to the scale before reading a bar height. Then ask whether a visual comparison has been exaggerated by a truncated axis or an unusual design. Students benefit from learning to challenge a chart respectfully: a picture may be precise, misleading or simply unhelpful. This is mathematical literacy that matters well beyond examinations.
13. Spread is different from centre
Two classes may have the same mean test score while showing very different performance patterns. One may cluster closely around the mean, while another has high and low values far apart. Range, interquartile range and standard deviation describe aspects of spread. The published K210 syllabus includes these concepts and comparisons between datasets. The parent’s first question is not how quickly the child can press a calculator key. It is whether the child understands why two distributions with the same average can still tell different stories.
A manageable starting example is to compare sets A = {4,5,6} and B = {1,5,9}. Both have mean 5. The range of A is 2, while the range of B is 8. Set B is more spread out. This observation does not teach every formal measure of dispersion, but it establishes the need for them. Then the student can study the exact calculations in their school unit, use appropriate technology when allowed and describe the conclusion in words. Avoid reducing statistics to isolated button sequences.
14. Probability: define the event before counting
A bag contains two red counters and three blue counters. The probability of drawing a red counter at random is 2/5 because there are two favourable outcomes among five equally likely individual counters. If two counters are drawn without replacement, the probability of two reds is (2/5) × (1/4) = 1/10. After the first red is removed, only one red remains among four counters. The second fraction is not 2/5. A student who multiplies the same fraction twice has overlooked what the phrase ‘without replacement’ means.
Use a tree diagram when the sequence of events is difficult to hold mentally. Ask the child to name the branches and check that probabilities from a single branching point sum to one. For independent events, such as tossing a fair coin and spinning a separate fair four-section spinner, the chance of heads and one named spinner section is 1/2 × 1/4 = 1/8. The underlying structure is different from drawing without replacement. Teach the event relationship first, then choose the calculation.
15. More probability: distinguish ‘and’ from ‘or’
Parents can check understanding through language. ‘Both events occur’ often points to a joint event; ‘either event occurs’ may mean one or the other or both, depending on context. For mutually exclusive events, they cannot occur together in one trial. If a fair six-sided die is rolled once, the outcomes ‘a 2’ and ‘a 5’ are mutually exclusive; the probability of either is 1/6 + 1/6 = 1/3. The student must explain why the events do not overlap before adding.
It is tempting to give the child a single rule for every ‘and’ or ‘or’ question. That shortcut fails when events are dependent or overlapping. Start with an outcome table or small possibility diagram. Let the child circle favourable outcomes and describe them in plain language. Then move to a probability rule. The calculation becomes easier because the student already knows what is being counted. This approach gives a practical route from reading comprehension to mathematical reasoning.
16. Real-world context: travel time and speed
Suppose a student travels 60 km at 30 km/h, then another 60 km at 60 km/h. The first segment takes 2 hours and the second takes 1 hour. The total distance is 120 km and the total time is 3 hours, so the average speed is 40 km/h—not the simple average of 30 and 60, which would be 45. The key is the definition of average speed as total distance divided by total time. This example demonstrates why reading the quantity being asked is more important than reacting to the visible numbers.
Encourage your child to draw a two-row table of distance, speed and time. The student then sees which quantities add across the journey and which must be calculated from totals. Similar logic appears in transport planning, sports, household budgets and other SEC real-world contexts. A paper may combine a table, graph and written description. The student should expect to move between representations while keeping the meaning of each number clear.
17. Real-world context: reading a scale drawing
A map has a scale of 1:25,000, meaning one unit on the map represents 25,000 of the same units in the real world. If two points are 4 cm apart on the map, the actual distance is 100,000 cm, or 1 km. The mathematical multiplication is simple, but students must understand the ratio and convert units correctly. If the question asks for estimated travel time, the result becomes one input into another calculation. Each layer should be checked before proceeding.
A parent can use a local neighbourhood map or a classroom floor plan to discuss scale without inventing a claim about a particular route. Ask the child whether the estimate represents straight-line distance or the actual path travelled. This is mathematical interpretation: the diagram may not contain enough information for a precise journey time. A useful answer is sometimes ‘we need more information’. The discipline of recognising missing information is an important skill when solving practical problems.
18. Real-world context: making a choice from data
Imagine two travel options. Route A takes 25 minutes on most days but occasionally 50 minutes; Route B regularly takes about 32 minutes. Which is preferable? It depends on whether the family values the fastest possible journey, reliable arrival or avoiding exceptional delays. Without data on the full distributions, no universal claim is justified. This illustrates why statistics is not only about calculating a mean. A parent can ask what evidence is missing and whether the given diagram supports the conclusion.
The same habit applies to claims about tuition, exam scores and academic pathways. Averages without context can mislead, and an isolated result does not prove that one course is suitable for every student. A numerate child learns to ask what was measured, how observations were selected and whether the conclusion follows. These are academic skills and civic skills: the student can make better decisions when numbers are presented as persuasive evidence.
19. Three levels of checking for every topic
- Check the given facts: Did you copy angles, units, scales and definitions correctly?
- Check the method: Are the conditions for the theorem, graph interpretation or probability rule satisfied?
- Check the answer: Is the size plausible, are the units correct and does the conclusion answer the question?
A correct calculation can fail at any of these three levels. For example, a student might accurately compute the area of an entire circle when the question asks for a sector; the arithmetic is correct but the object being measured is wrong. Another may use the correct sector fraction but substitute degrees into a formula requiring radians. A third may produce a correct result in square centimetres and report it as metres. Help your child distinguish the failure point so that the correction targets a real misconception.
20. A practical twelve-week geometry-and-data support plan
Weeks 1–2: locate the difficulty
Use one current school geometry question, one graph question and one data or probability question. Ask for the first step and the reason. Record whether the failure is diagram interpretation, formula selection, arithmetic, working presentation or an unfamiliar word. Make a small baseline portfolio rather than administering an enormous unofficial examination. The school’s chapter sequence remains the main guide; the diagnostic checks skills underneath it.
Weeks 3–4: stabilise diagrams
Practise marking known information, stating geometry reasons and drawing helpful constructions. For trigonometry, add labels for the reference angle and relevant sides. For scale drawings, label the units and conversion. Reuse one diagram with different questions so that the student sees how a single representation can support multiple valid conclusions. Avoid timing until the child can explain the choice of method.
Weeks 5–6: stabilise quantities
Work with perimeter, area, volume, rate and unit conversion. The student must name the quantity and its unit before selecting the formula. A collection of mixed dimensions is useful: one question in centimetres, one requiring a square-unit conversion and another involving a composite figure. The priority is not advanced speed; it is recognising whether the answer should be a length, an area, a volume or a rate.
Weeks 7–8: stabilise evidence from data
Read several displays, compare means or medians, and explain a change in spread. Include at least one graph with a non-zero starting axis to check whether the student is paying attention to the scale. Ask the child to say what cannot be inferred as well as what can. Use this distinction to introduce probability, where a clear set of possible outcomes is essential.
Weeks 9–10: integrate real-world tasks
Combine a table with a rate calculation or a diagram with a distance question. Have the student write down the known quantities and the reason for each operation. Return to an earlier error in a different context. If the child can now make a mathematical decision without first being told the topic, that is evidence of transfer rather than short-lived familiarity.
Weeks 11–12: review and adjust
Try a modest mixed set based on the current school assessment format, then compare it with the baseline. Count the errors that came from interpretation, method choice, arithmetic and presentation. Discuss one improvement and one remaining weakness. If a child is still overwhelmed, speak with the school about access to support and the current subject level; the solution need not be more hours of unsupervised drill.
21. The eventual K210 examination: what parents should expect
For the 2027 SEC K210, Paper 1 is two hours with about 23 short-answer questions and 70 marks, contributing 50 per cent of the result. Paper 2 is also two hours and 70 marks, with a compulsory Section A containing a real-world question and Section B offering two questions from which candidates choose one. One Section B alternative covers specified Geometry and Measurement content; the other specified Statistics and Probability content. Candidates must read the exact instructions, not assume both alternatives must be answered. The syllabus marks the relevant Section B content.
For the 2027 national examination, approved calculators may be used in both papers, and omission of essential working can result in loss of marks. Relevant formulae are provided. Unless an individual question says otherwise, non-exact numerical answers generally follow the syllabus conventions for significant figures and angles. This is a useful reminder that reasoning and presentation matter in a calculator-permitted examination. However, do not apply these national-paper details uncritically to a Secondary 3 school test: the teacher sets the actual school assessment.
22. Suitability: a child may be stronger at visual than symbolic mathematics
A student might understand diagrams and data well but be less comfortable with algebraic manipulation. Another might solve equations efficiently yet struggle with angle properties and real-world questions. These are learning profiles, not a hierarchy of intelligence. Parents should avoid describing the child simply as good or bad at Mathematics when the evidence is more specific. Identify the student’s strongest representations and use them to support weaker ones. A visual learner may understand an algebraic relation more quickly when it is graphed; an algebraically confident learner may need extra work on labelling geometry diagrams.
Whether the child should continue G2 Mathematics, be considered for G3 at a later school checkpoint or receive targeted support requires discussion of broader attainment, effort, wellbeing, school rules and future goals. G2 Mathematics is a legitimate subject level, not a failure to select something harder. If the child needs a stronger challenge and the school confirms eligibility, plan a deliberate transition. If the child benefits from a stable, manageable level, strengthen mastery there. Decisions should improve learning conditions rather than satisfy an adult’s preferred label.
23. Mathematics with Science, Accounts, Computing and other interests
The value of geometry and data extends beyond the Mathematics classroom. Physics may use graphs, units and trigonometric reasoning. Chemistry may involve ratios, rates and quantitative interpretation. Biology may use data displays, probability and proportional reasoning. Principles of Accounts demands accurate numerical relationships, while Computing makes use of patterns and logical structure. Applied and design-related learning can use scale, measurement and estimation. These connections can help a child see the purpose of Mathematics without implying that every school offers every possible subject combination.
When selecting upper-secondary electives, ask what the child likes doing, what their teachers observe and what the entire timetable requires. A practical interest in design or laboratory work is valuable, but subject suitability also depends on prerequisites and academic foundations. Check the school’s own subject list, whether the child is eligible to offer a level and how many demanding commitments can fit alongside CCA and family life. No single interest test or mock question should be used as a final verdict.
24. Pathways and why parents should avoid guarantees
Students taking G2 Mathematics may later consider pathways including the Polytechnic Foundation Programme, ITE and other routes, depending on the combination of subjects, results and current criteria. For the 2028 polytechnic Year 1 intake, MOE announced an ELR2B2 approach allowing one G2 subject in the five-subject aggregate while requiring the other four to remain at G3, subject to programme prerequisites. This does not mean G2 Mathematics alone grants admission. For SEC implementation and results timing, read the official SEAB overview and the current MOE admissions information.
A student with an interest in science, engineering, business or design deserves an accurate list of programme requirements, not an emotional promise that a particular examination grade will open every door. Parents can shortlist possible courses and check Mathematics entry requirements for each. Make room for alternative routes, including foundational programmes where eligible. Good subject choices are based on a specific child, the school’s actual offers and verified progression rules for the relevant admissions year.
25. When school support is enough—and when to seek more help
The three-student tutorial described in the Clementi reference is designed to make working visible so that a tutor can identify an exact misconception. This can be useful for a child who misreads diagrams or can compute statistics but cannot interpret the result. Yet not every student requires tuition. If school feedback is specific and the student can repair a misunderstanding independently, staying with school resources and a short home routine may be the better choice.
If errors persist despite attempts to understand, discuss targeted support with the teacher or an appropriately qualified tutor. Ask for a simple evidence measure: can the child now annotate a fresh diagram, explain the conditions for the chosen rule, and solve without prompts? A large collection of completed pages does not prove progress if most questions were copied or heavily guided. The goal is mathematical independence and a healthier relationship with learning, not an endless expansion of homework.
Frequently asked parent questions
Does G2 Mathematics have trigonometry and statistics?
Yes, both appear in the published 2027 K210 syllabus. The precise timing at which they are taught in Secondary 3 depends on the school’s plan. Confirm which topics are already expected for the next school assessment.
Is G2 Mathematics the same as G2 Additional Mathematics?
No. G2 Mathematics uses K210 for the 2027 SEC, while G2 Additional Mathematics uses K232. Schools also determine which subjects and combinations are available and the entry criteria. Do not confuse an A-Math tuition worksheet with the syllabus for ordinary Mathematics.
Can a calculator solve geometry and statistics problems for my child?
A calculator can accelerate accurate computation and some statistical calculations, but it cannot choose a theorem, interpret an ambiguous graph or know whether an answer should be in square centimetres. The 2027 K210 allows an approved calculator in both national papers, yet essential reasoning and working remain assessable.
Should parents prioritise geometry or algebra?
Prioritise the current school work and the error that blocks understanding. If a student’s algebraic weakness prevents use of a formula, repair it while supporting geometry. If algebra is stable but diagrams are misread, geometry deserves focused attention. An evidence-based plan can balance both without pretending a single chapter represents the whole subject.
How do I help when I have forgotten secondary Mathematics?
Ask the child to teach you what the question says, what is known, which method they chose and how they checked the result. Use the school teacher and the official syllabus as references when needed. You do not need to bluff your way through a theorem. Your most helpful role is to support good questions, calm routines and access to accurate feedback.
Conclusion: make every mathematical result explain itself
A solid Secondary 3 G2 Mathematics student can go beyond performing a familiar calculation. They can decide whether a shape is similar, recognise what a gradient describes, distinguish mean from median and decide how a probability event should be counted. These habits protect marks and support practical decisions. For the bigger orientation to subjects and options, see the parent’s K210 overview; for the algebra and functions side, see the algebra and graphs guide. Keep the school’s learning sequence central and treat every new question as a chance to check understanding.
Verified references, 14 November 2026: SEAB K210 G2 Mathematics syllabus for the 2027 SEC · SEAB SEC examination overview · immutable Clementi teaching reference. Examples in this article are original teaching examples, not official examination questions or promises about school-specific coverage.