
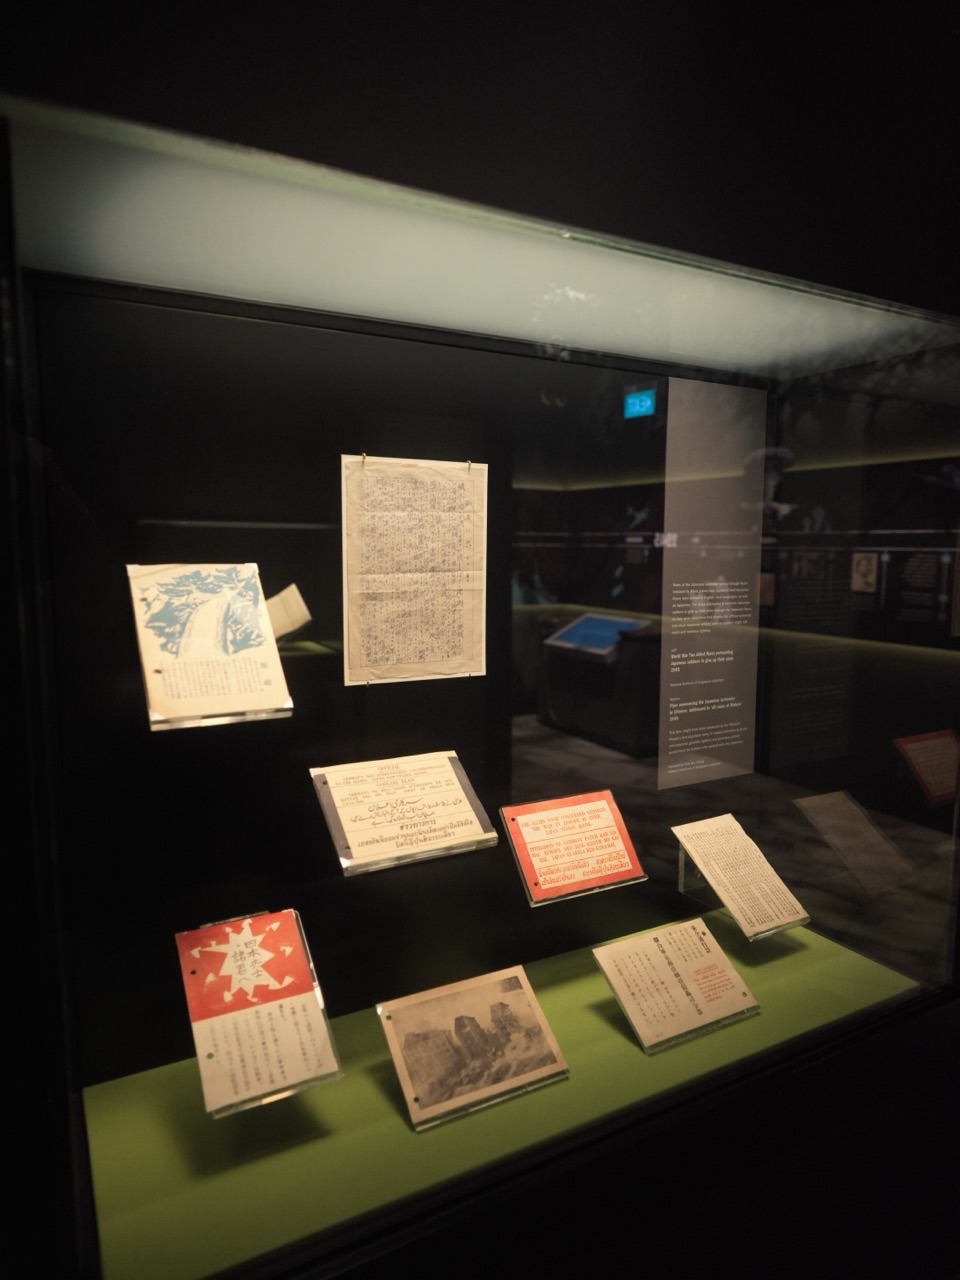
A museum room can look perfectly calm while the collection is being damaged very slowly.
The air is too dry.
The humidity cycles too widely.
The light exposure is accumulating.
Pollutants are reacting with surfaces.
The problem is invisible because deterioration is happening at a rate too slow for ordinary human attention.
Environmental monitoring gives the museum senses that operate continuously even when nobody is looking.
The Canadian Conservation Institute provides environmental monitoring support for museums specifically to detect relative humidity, temperature, lighting and ultraviolet radiation in collections. Smithsonian preventive conservation likewise treats environmental management as a core strategy for slowing deterioration and reducing risk. The point is not to chase a magical perfect number for every object. It is to understand what conditions the collection actually experiences and whether those conditions are compatible with long-term care.
This article owns the measurement-and-feedback layer. The Museum and the Climate owns the broad climate problem. The Museum Is a Building That Never Sleeps owns facilities operation. This article asks how the museum knows what the room is actually doing.
Quick Read: The Environmental Monitoring Mechanism
COLLECTION VULNERABILITY → MONITORING PLAN → SENSOR PLACEMENT → BASELINE → CONTINUOUS DATA → VALIDATE SENSOR → IDENTIFY TREND → COMPARE WITH RISK → DISTINGUISH NORMAL VARIATION FROM EXCURSION → INVESTIGATE CAUSE → ADJUST HVAC / LIGHT / CASE / OPERATIONS → VERIFY EFFECT → DOCUMENT → REVIEW LIMITS → REPEAT.
Temperature Matters Because Materials Are Chemical Systems
Many degradation reactions accelerate as temperature rises.
That does not mean every museum should become cold storage. Human comfort, building capacity, energy use and material needs all matter.
The useful question is not simply “Is the temperature 21°C?” It is “What risk does this temperature create for these materials over this time?”
Relative Humidity Is About Moisture Balance
Wood, paper, leather, textiles and other hygroscopic materials exchange moisture with surrounding air.
As relative humidity changes, materials can swell and shrink.
Large or repeated changes can create stress in composite objects whose components move differently.
Averages Can Hide Dangerous Swings
Average relative humidity: 50%.
Sounds excellent.
But if the room cycles between 30% and 70% every day, the average hides the mechanism.
Environmental interpretation needs range, rate of change, duration and recurrence—not just averages.
Light Damage Is Cumulative
One hour of light may create no visible change.
Thousands of hours can fade sensitive dyes and pigments.
Light therefore behaves like a dose.
Monitoring should consider both intensity and exposure time.
Ultraviolet Radiation Adds a Different Damage Path
UV is not required for seeing most displays.
Where practical, museums reduce unnecessary UV from daylight and lighting sources because it contributes to photochemical deterioration.
Pollutants Can Come From Outside and Inside
Traffic pollution enters.
Fresh paint emits compounds.
Wood products off-gas.
Cleaning chemicals contribute vapours.
Environmental monitoring sometimes needs to look beyond climate variables toward material-specific pollutant risks.
The Room Is Not One Environment
Near exterior wall.
Inside display case.
Top shelf.
Behind blackout curtain.
Under air-conditioning supply.
These can behave differently even within one gallery.
Sensor placement should reflect the object environment, not merely the easiest wall socket.
Display Cases Create Microclimates
A sealed case can buffer short-term room changes.
It can also trap pollutants or moisture if designed badly.
Case monitoring may be more relevant than room monitoring for especially sensitive objects.
Sensor Placement Is a Hypothesis
Put one logger in the middle of a huge store.
It cannot prove every shelf experiences the same environment.
Monitoring design should test suspected gradients and vulnerable zones rather than assume uniformity.
A Sensor Can Be Wrong
Battery weak.
Calibration drift.
Placed in direct sunlight.
Mounted against cold exterior wall.
Environmental data should be quality-controlled before expensive conclusions are drawn from it.
One Spike Is Not Automatically a Disaster
Door opens.
Humidity jumps briefly.
Does that matter?
Duration, magnitude, object vulnerability and recurrence determine significance.
Monitoring should prevent both complacency and alarmism.
Patterns Matter More Than Isolated Numbers
Every weekday at 8 a.m., humidity dips.
Why?
HVAC startup schedule.
Every Monday, temperature rises.
Why?
Maintenance shutdown over weekend.
Time-series data can reveal operational signatures invisible to spot checks.
The Building and Collection Data Should Talk to Each Other
Environmental spike at 14:03.
Building management system shows air-handling fault at 13:58.
Condition report shows active movement in a vulnerable object months later.
Integrated data allows the museum to move from correlation toward plausible cause.
The Best Setpoint Is Not Always the Tightest Setpoint
Very tight climate control can consume large amounts of energy and may be unrealistic for some historic buildings.
Preventive conservation increasingly uses risk-based environmental management: understand material vulnerability, local climate, building capacity and the actual consequences of variation.
Precision should serve preservation, not become an unquestioned ritual.
Energy and Conservation Can Be Optimised Together
If the collection safely tolerates a wider environmental band than old practice assumed, energy use may be reduced without increasing meaningful deterioration risk.
But loosening controls without collection-specific evidence simply transfers cost from electricity to heritage loss.
Monitoring Can Reveal That the Problem Is the Display, Not the Room
Gallery data looks stable.
One case runs hotter because of internal lighting.
Another case has pollutant problems because of construction materials.
Environmental diagnosis should narrow from building to room to case to object.
Temporary Exhibitions Need Baselines Too
Lender asks for twelve months of environmental data.
Why?
Because one good reading on installation day does not prove the gallery is consistently suitable.
Historic data demonstrates operational performance.
Environmental Excursions Need Context
Power failure.
Door left open.
HVAC maintenance.
Extreme weather.
Annotating events on environmental charts turns unexplained spikes into institutional knowledge.
Alerts Should Be Actionable
If a system sends so many alarms that staff ignore them, monitoring becomes noise.
Thresholds should be tied to response routes: who gets notified, what they check, and when escalation becomes necessary.
Data Retention Creates Long Memory
Five years of data can reveal seasonal patterns, building drift and the effects of refurbishment.
Deleting history because the dashboard only shows the latest month destroys the ability to compare systems across time.
AI Can Find Patterns Humans Miss
Compare temperature, humidity, weather, visitor density, HVAC state and maintenance events.
Models can flag unusual deviations or predict recurring instability.
But an anomaly score is not a conservation diagnosis. Qualified staff still determine material significance and response.
How to Read Environmental Monitoring Intelligently
- Material: What is vulnerable and to which environmental agents?
- Variable: Which temperature, humidity, light, UV or pollutant measurements matter?
- Placement: Does the sensor represent the object’s real environment?
- Quality: Is the sensor functioning and calibrated?
- Trend: What pattern exists over time?
- Range: Are swings hidden by averages?
- Duration: How long do excursions last?
- Microclimate: Does a case or local zone behave differently?
- Cause: Which building or operational event explains the change?
- Action: What adjustment is justified by actual risk?
- Verification: Did the intervention improve the environment?
- History: Is long-term data preserved?
Environmental Monitoring Failure Tests
| Failure | What Goes Wrong | Repair Question |
|---|---|---|
| One number = environment | Variation and duration disappear | What does the time series show? |
| One sensor = room | Microclimates are missed | Does placement represent vulnerable objects? |
| Average = safe | Large cycles remain hidden | What are the peaks, troughs and rates of change? |
| Alarm = action | Staff receive noise without response logic | Who acts and under what threshold? |
| Tighter = better | Energy costs rise without proportional preservation gain | What material risk justifies the control? |
| Data = knowledge | Numbers remain disconnected from building events | What caused the pattern? |
Current Evidence and Professional Anchors
- Canadian Conservation Institute — Preventive Conservation Services for environmental monitoring of relative humidity, temperature, lighting and ultraviolet radiation.
- Smithsonian Museum Conservation Institute — Preventive Conservation for systematic risk identification, environmental management and data-informed decision-making.
- Hirshhorn Museum — Conservation for environmental trend monitoring and collaboration between conservators, registrars, handlers, facilities staff and engineers.
Where This Fits in the Museum Series
How Museums Work remains the canonical root. The Museum and the Climate owns climate broadly. The Museum Listens to the Room owns the measurement system that turns invisible environmental conditions into evidence for preventive conservation.
Final Thought
The room is always doing something.
Heating.
Cooling.
Drying.
Wetting.
Brightening.
Polluting.
Environmental monitoring is how the museum stops treating the room as background and starts treating it as an active participant in the long life of every object inside it.