
Weather seems ordinary until the day a road floods, a crop is damaged, a ferry cannot operate or a school needs an authoritative warning. Rain, wind, heat and storms affect the ability of people to plan and remain safe. But a civilisation cannot control the atmosphere by passing a rule. It must observe changing conditions, interpret evidence, issue useful forecasts and warnings, and connect those messages to legitimate decisions by people who can act.
The weather-and-climate-services component of civilisation joins observation networks, standardised data, scientific forecasting, uncertainty communication, climate information, early warning services and trusted public institutions. A forecast is not an order, an isolated weather reading is not a climate trend, and a warning system succeeds only when relevant people can receive, understand and appropriately respond through authorised arrangements.
This is a new long-form volume in eduKate’s Components of a Civilisation study library. The fictional teaching settlement, Tidal Reach, contains 240 imaginary residents and sixty invented households. Its weather readings, forecasts, warnings, farming conditions and public decisions are classroom inventions, not observations of a real society or a current forecast for the reader.
This volume concentrates on the production, interpretation and practical delivery of weather and climate knowledge. It complements the ecology chapter’s focus on environmental stewardship and the resilience chapter’s focus on emergency capability, without replacing professional meteorological guidance or giving operational safety recommendations.
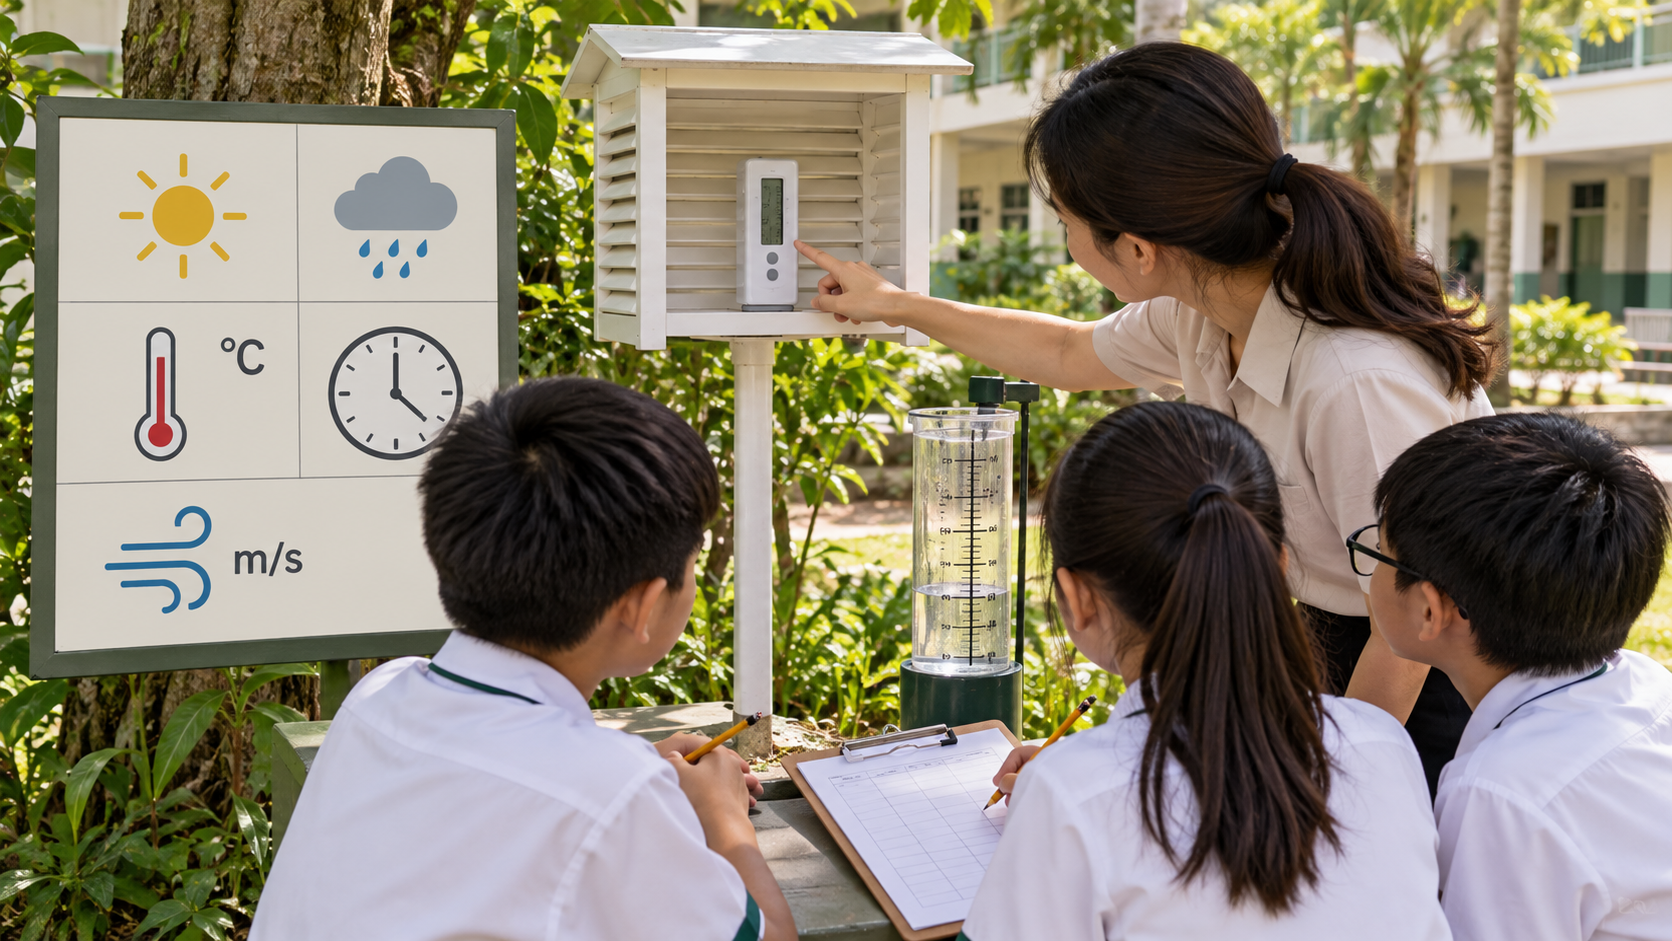
The featured image is existing 2026 educational artwork showing supervised weather-logging at school. It is illustrative rather than a documented observation at a real certified monitoring station. Claims about global services, early warnings and methods are distinguished by named WMO and UN sources.
Quick answer: why does a civilisation need meteorological services?
The weather-and-climate-services component of civilisation joins observation networks, standardised data, scientific forecasting, uncertainty communication, climate information, early warning services and trusted public institutions. A forecast is not an order, an isolated weather reading is not a climate trend, and a warning system succeeds only when relevant people can receive, understand and appropriately respond through authorised arrangements.
Evidence and its date: the 2025 early-warning snapshot
The WMO Global Status of Multi-Hazard Early Warning Systems 2025, published on 12 November 2025, reported that 119 countries, about 60% of countries assessed, reported having multi-hazard early warning systems. This is a dated global institutional snapshot, not a statement that the remaining countries have no weather services or that every individual in the 119 countries is fully protected.
The UN Early Warnings for All initiative has the goal of expanding effective protection by the end of 2027. A goal is not the same as an already achieved outcome. The WMO Global Framework for Climate Services explains how scientific climate information can be linked with real users and decision processes; it does not provide a live forecast for Tidal Reach.
How observation becomes a useful public outcome
| Stage | Question to ask | Why it matters |
|---|---|---|
| Observation | What was recorded, where and when? | Unlabelled numbers cannot support reliable comparison |
| Data processing | How were measurements quality-checked and exchanged? | Bad inputs can undermine later analysis |
| Forecast | Which future event, place, interval and uncertainty are described? | A prediction is not an observation |
| Communication | Did the intended person receive and understand the current information? | Transmission is not necessarily comprehension |
| Response and feedback | Which legitimate authorities and users act, and how is the result reviewed? | A warning alone is not comprehensive protection |
Three classroom calculations, each with a limitation
Imagine a fictional rain gauge reporting 30 millimetres over six hours. Its arithmetic average accumulation rate over that interval is 30 ÷ 6 = 5 millimetres per hour. This calculation does not imply rain fell evenly or that the local ground or river would flood. It is a teaching example with invented data, not a real threshold or warning category.
Now consider five imaginary forecasts of a particular quantity: 4, 6, 6, 8 and 11 in a stated model unit. Their range is 11 − 4 = 7 and their arithmetic mean is 7. The mean is not a guarantee about the future, and this tiny set is not a calibrated ensemble forecast. It illustrates how several possible estimates may differ and why a single number can conceal variation.
Finally, suppose a fictional alert reaches nine of twelve intentionally selected paper households during a classroom exercise. That gives 9 ÷ 12 = 75% of the toy cases. It does not prove that 75% of the town’s residents received or understood a real warning, nor that anybody took an appropriate action. The denominator describes the selected paper scenarios, while real communication coverage and preparedness require qualified assessment.
Chapter 1: Weather and observations in people’s daily lives
This chapter presents six related questions about the meaning, source, uncertainty and practical use of atmospheric information. A parent can select one station for a short dialogue, while a Secondary learner can compare several and examine their evidence. The teaching order is not a claim that every country follows one universal route to scientific capability.
Component 01: Weather and climate are different concepts
The specific meteorological concept. Weather describes atmospheric conditions at a given place and time, while climate concerns statistical patterns over longer periods. Weather is an observation problem before it becomes a prediction problem. Ask what the instrument or information product is describing, where the measurement applies and when it was obtained. A child’s everyday impression of rain or wind can be useful as a question, but it does not automatically establish a professional meteorological conclusion. The system needs reliable methods, institutional maintenance and appropriate interpretation to turn scattered observations into shared information. Explain weather and climate are different concepts as a defined observation, process or public service with identifiable inputs and an appropriate time or location.
Case from fictional Tidal Reach. A pupil sees heavy rain on one day and announces that the town’s climate has permanently changed. Draw a short timeline with a measurement, an analysis, a forecast issue time and the period the forecast refers to. A common source of confusion is treating the last recorded observation as a statement about the future. Ask what information would be needed to connect them. This develops scientific literacy through a harmless diagram rather than an unsound prediction. Ask what information is actually supplied and what the learner inferred without evidence. The case is not a real dataset or local forecast.
The interpretive risk. A single event cannot establish a long-run trend by itself. One successful warning or forecast does not prove a service will remain dependable forever. Instruments need upkeep, data systems must continue and people change how they access information. Extend the case from the first result to the next season and next generation. Who maintains the capability, and what record will help a successor evaluate it? Public knowledge requires continuing institutions rather than occasional luck. A reasonable alternative explanation should be considered before deciding that one measurement or agency action was wrong. Identify the scope of the question and relevant professional role.
Evidence and a falsifiable check. Ask whether the claim uses an event observation or a defined climate dataset. Outputs are not outcomes. An agency may issue many forecasts or install many stations, yet intended people could still receive messages too late or misunderstand them. Define what information was produced and what practical action or understanding was intended. A complete evaluation may need several indicators, including access and comprehensibility, rather than one count of published reports. Name one result that would challenge the current conclusion and another piece of information that would improve it. Make no real-world weather or emergency decisions from the imaginary numbers.
A safe parent-and-tutor lesson. Draw a short weather diary next to a fictional many-year climate summary. Run a respectful debate between an imaginary farmer, school organiser and information specialist. Each may need a different forecast horizon or variable. Have pupils restate the strongest concern of another role before proposing an accessible communication product. The purpose is to clarify user needs and evidence, not to pretend that classroom participants are authorised emergency managers. Use paper maps and invented values, without generating genuine warnings or directing dangerous behaviour. A Secondary learner may add a calculation with units and a limitation.
Feedback and inheritance. Sometimes the next responsible step is obtaining better data or consulting a qualified meteorological agency, not improvising a warning. That is not an excuse to ignore a human need. State precisely what is unknown and where authoritative information can be found. A classroom exercise cannot substitute for local flood, aviation or medical expertise. Link this station to cloud observations, then state which information future learners need to understand how the model was corrected.
Component 02: Observing the atmosphere systematically
The specific meteorological concept. Meteorological observation requires methods that connect instruments, locations, times and quality checks. The value of meteorological knowledge comes from coordinating many different sources. A station, satellite or radar may observe a particular aspect of the environment, while a forecast combines evidence and scientific modelling under stated limits. Identify what each stage contributes. A visible cloud image cannot independently prove a future outcome. A strong learner explains the transformations from data to analysis to useful communication instead of treating forecasts as magic. Explain observing the atmosphere systematically as a defined observation, process or public service with identifiable inputs and an appropriate time or location.
Case from fictional Tidal Reach. Tidal Reach receives two temperature readings recorded at different locations and times. Write the story from the perspective of the weather-service provider and the end user. The provider knows which product was issued and how it was constructed. The user needs to know what it means for a decision. An accurate report might still fail in practice if the message is inaccessible or taken out of date. Ask which feedback would make that gap visible. Ask what information is actually supplied and what the learner inferred without evidence. The case is not a real dataset or local forecast.
The interpretive risk. Unlabelled numbers cannot be compared as though they describe the same environment. A high-resolution map or a percentage with many decimal places can create false certainty when observations or model inputs remain uncertain. The pupil should describe how the evidence supports the level of detail used in the claim. The proper response may be a range, a probability or a note about limitations rather than a more emphatic prediction. A reasonable alternative explanation should be considered before deciding that one measurement or agency action was wrong. Identify the scope of the question and relevant professional role.
Evidence and a falsifiable check. Check observation site, time, unit and instrument context. Make an evidence trail: observation or source, method, data quality, analysis, product issue time, public interpretation and review. Another student should be able to identify where a forecast becomes a decision-relevant message. A missing field is a useful research question. Metadata and provenance matter because many different users depend on shared data. Name one result that would challenge the current conclusion and another piece of information that would improve it. Make no real-world weather or emergency decisions from the imaginary numbers.
A safe parent-and-tutor lesson. Create a paper station log with fictional values and complete labels. Invite a one-minute teach-back in which a student explains the difference between yesterday’s observation, tomorrow’s forecast and a multi-year climate pattern. A listener asks how the explanation changes when the station is moved or the time period extended. The speaker should revise the diagram and name the missing evidence. This is a strong test of understanding. Use paper maps and invented values, without generating genuine warnings or directing dangerous behaviour. A Secondary learner may add a calculation with units and a limitation.
Feedback and inheritance. Identify the observation that should trigger a review of the first communication approach. Perhaps a warning reaches some households late, a sensor repeatedly fails or an outdated forecast remains widely shared. Ask who can investigate and what feedback would demonstrate improvement. This creates an accountable process instead of a vague promise of more accurate forecasts. Link this station to surface weather stations, then state which information future learners need to understand how the model was corrected.
Component 03: Air temperature
The specific meteorological concept. Temperature observations depend on how and where measurement is carried out and interpreted. Begin with a defined variable, location and time window. A rainfall total, temperature maximum and probability of an event answer different questions, even when they appear together in one weather application. The learner should be able to describe precisely what is measured or predicted and what remains outside the scope. This prevents attractive graphics from becoming false certainty about a specific resident’s future conditions. Explain air temperature as a defined observation, process or public service with identifiable inputs and an appropriate time or location.
Case from fictional Tidal Reach. A school records one hot paved-area reading and one shaded garden reading. End the story with the user’s actual decision context rather than the numerical value alone. Did the person receive the correct, current message? Was the warning clearly distinguished from a longer forecast? Which authority would be responsible for official action? The class can answer in conceptual terms and explicitly mark where professional or local guidance would be required. Ask what information is actually supplied and what the learner inferred without evidence. The case is not a real dataset or local forecast.
The interpretive risk. A local measurement cannot automatically describe exposure across the whole town. Real warnings and protective decisions involve public responsibilities and expert judgement. A classroom analogy should never determine evacuation triggers, clinical heat advice, flight safety decisions or flood-engineering thresholds. Identify which current official sources and qualified professionals would be necessary. Children can analyse the architecture of information and accountability without giving hazardous instructions. A reasonable alternative explanation should be considered before deciding that one measurement or agency action was wrong. Identify the scope of the question and relevant professional role.
Evidence and a falsifiable check. Identify location, conditions and uncertainty rather than claiming one reading is universal. A useful forecast check allows the original prediction to be challenged. Ask which observation, collected at the appropriate place and time, would reveal that the forecast differed from reality. Then distinguish a single event from repeated measures of forecast skill. An honest service uses verification to improve, not merely to select its most flattering examples. Name one result that would challenge the current conclusion and another piece of information that would improve it. Make no real-world weather or emergency decisions from the imaginary numbers.
A safe parent-and-tutor lesson. Compare invented values with appropriate unit and site labels. Design a plain-language weather-information card for a fictional person who missed an earlier update. It must state issue time, applicable place, source and uncertainty, and direct the reader to current competent services for any real advice. Test the wording with another pupil. No classroom message should be presented as a genuine public warning. Use paper maps and invented values, without generating genuine warnings or directing dangerous behaviour. A Secondary learner may add a calculation with units and a limitation.
Feedback and inheritance. Compare the original and revised diagrams. Name a corrected time window, a newly recognised data source and one user whose access had been overlooked. Another learner should be able to follow the improved reasoning independently. The opportunity to inspect and revise knowledge is a crucial capability of a civilisation facing changing conditions. Link this station to marine observations, then state which information future learners need to understand how the model was corrected.
Component 04: Rainfall and accumulation
The specific meteorological concept. Rainfall amounts describe precipitation across a stated collection period and station. Weather systems support ordinary public activities through specialised work that is easy to overlook. Instrument technicians, forecasters, data specialists, warning communicators, local authorities and users play different roles. A useful service depends on their coordination; no single weather station can carry out every task. Ask the pupil to name which information changes hands and how a misunderstanding might affect the eventual public decision. Explain rainfall and accumulation as a defined observation, process or public service with identifiable inputs and an appropriate time or location.
Case from fictional Tidal Reach. The model rain gauge records twenty millimetres over an invented day while another record covers three hours. Change one condition in the invented story while keeping the rest stable. A forecast horizon might become longer, the reporting site may move or the intended audience may be different. Which assumption in the first explanation is no longer valid? A student who revises the model accurately has learned more than one who repeats a single sentence about rain and sunshine. Ask what information is actually supplied and what the learner inferred without evidence. The case is not a real dataset or local forecast.
The interpretive risk. Equal numbers do not mean equal intensity or duration. Future generations may inherit more capable observing systems along with ongoing maintenance and data-preservation duties. A historical climate series loses usefulness if station changes and methods are not documented. Ask which records a future learner must understand to make a fair comparison. A civic service that retains its evidence and correction history becomes more adaptable. A reasonable alternative explanation should be considered before deciding that one measurement or agency action was wrong. Identify the scope of the question and relevant professional role.
Evidence and a falsifiable check. Use a clearly stated observation period and data quality note. Before drawing a conclusion, define whether the information is an observation, a forecast, a probability or a climate statistic. They describe different things. State the variable, location, time period and source. The student should also identify whether the report is official, historical or fictional. A number without its context can become a false claim even when the arithmetic displayed beside it is correct. Name one result that would challenge the current conclusion and another piece of information that would improve it. Make no real-world weather or emergency decisions from the imaginary numbers.
A safe parent-and-tutor lesson. Calculate two hypothetical rainfall rates without using real flood thresholds. Prepare four cards: a measured condition, a predicted event, a possible communication problem and an evidence check. Shuffle them and ask the child to arrange a causal explanation. Change one assumption such as the valid forecast time and invite revision. This reveals whether the student understands observation and prediction rather than merely repeating weather vocabulary. Use paper maps and invented values, without generating genuine warnings or directing dangerous behaviour. A Secondary learner may add a calculation with units and a limitation.
Feedback and inheritance. Move the weather service into the next decade. Instruments, data volume, environmental conditions and user needs may change. Which principles of clear provenance, trustworthy forecasts and accessible warnings should remain? Which methods might need revision? A civilisation passes on the capability to interpret uncertainty, not merely a collection of old charts. Link this station to upper-air observations, then state which information future learners need to understand how the model was corrected.
Component 05: Wind observations
The specific meteorological concept. Wind reports may describe speed, direction, gusts and their observation conditions. The physical atmosphere cannot be controlled by a council announcement. A civilisation instead develops the capability to observe, estimate possibilities and communicate relevant risks. That capacity has limits because conditions change and observations are incomplete. A strong explanation respects uncertainty without treating all forecasts as useless. The task is to describe what scientific knowledge can inform and what it cannot guarantee. Explain wind observations as a defined observation, process or public service with identifiable inputs and an appropriate time or location.
Case from fictional Tidal Reach. Two fictional flags appear to move differently on either side of a building. Ask which resident would be missing from a digital-only warning programme. Someone without a connected device or accessible language may not receive the message in a useful form. Do not assume every member of an imagined category has identical needs. Instead, ask what alternate communication route would merit real testing and what observation would show successful understanding. Ask what information is actually supplied and what the learner inferred without evidence. The case is not a real dataset or local forecast.
The interpretive risk. Visual impressions alone cannot establish a reliable wind measurement. A new sensor or model may have a public benefit, but equipment and data collection also require funding, technical capability and maintenance. Ask what other useful task may be delayed when resources are assigned to one part of the chain. In the classroom, paper tokens can illustrate the opportunity cost, while actual decisions depend on professional budgets and public priorities. A reasonable alternative explanation should be considered before deciding that one measurement or agency action was wrong. Identify the scope of the question and relevant professional role.
Evidence and a falsifiable check. Distinguish mean speed, direction and gust information. End with the scope of the claim. A WMO 2025 report describes the status and definitions of its reference period, not current live conditions at the reader’s address. A climate scenario is not a guaranteed weather forecast, and Tidal Reach is imaginary. An accurate explanation makes these differences obvious to a younger reader. Name one result that would challenge the current conclusion and another piece of information that would improve it. Make no real-world weather or emergency decisions from the imaginary numbers.
A safe parent-and-tutor lesson. Draw a simple wind-rose concept using only invented readings. Run a respectful debate between an imaginary farmer, school organiser and information specialist. Each may need a different forecast horizon or variable. Have pupils restate the strongest concern of another role before proposing an accessible communication product. The purpose is to clarify user needs and evidence, not to pretend that classroom participants are authorised emergency managers. Use paper maps and invented values, without generating genuine warnings or directing dangerous behaviour. A Secondary learner may add a calculation with units and a limitation.
Feedback and inheritance. Sometimes the next responsible step is obtaining better data or consulting a qualified meteorological agency, not improvising a warning. That is not an excuse to ignore a human need. State precisely what is unknown and where authoritative information can be found. A classroom exercise cannot substitute for local flood, aviation or medical expertise. Link this station to weather satellites, then state which information future learners need to understand how the model was corrected.
Component 06: Humidity and moisture in air
The specific meteorological concept. Humidity observations have particular definitions and interact with temperature and other conditions. A forecast’s purpose depends on the decision a person faces. A farmer, teacher, airport professional or family may need different timescales, locations and formats. The same published number may be highly relevant for one question and inadequate for another. Ask which user is involved and what outcome they are trying to plan. This turns weather information from a collection of interesting measurements into a contextual public service. Explain humidity and moisture in air as a defined observation, process or public service with identifiable inputs and an appropriate time or location.
Case from fictional Tidal Reach. A pupil concludes that higher relative humidity always means more water vapour in every comparison. Let one imagined resident use the forecast to plan a school activity while another relies on it for an agricultural or transport question. They may need different variables or timescales. The contrast does not prove one is a better reader. It reveals the need to define a user purpose and choose appropriate information. Both should know where authoritative guidance is obtained for real conditions. Ask what information is actually supplied and what the learner inferred without evidence. The case is not a real dataset or local forecast.
The interpretive risk. Relative humidity without temperature context may mislead. Forecast accuracy and public usefulness are different but connected questions. A model may make an appropriate probabilistic statement while a reader assumes it promises a particular outcome. Identify the gap between the scientific meaning and the public interpretation. The response may involve clearer communication as well as better data. It is important not to label every mismatch a failure of professional competence. A reasonable alternative explanation should be considered before deciding that one measurement or agency action was wrong. Identify the scope of the question and relevant professional role.
Evidence and a falsifiable check. Identify the stated humidity measure and the conditions to which it applies. Monitoring is useful when qualified people use the result to revise products and public communication. Who checks instrument performance, evaluates forecasts and receives user feedback? A dashboard that no one reviews is not a complete civic service. The learner should follow the evidence to an accountable correction and back to the people the information was intended to help. Name one result that would challenge the current conclusion and another piece of information that would improve it. Make no real-world weather or emergency decisions from the imaginary numbers.
A safe parent-and-tutor lesson. Write a comparison question using invented weather reports. Invite a one-minute teach-back in which a student explains the difference between yesterday’s observation, tomorrow’s forecast and a multi-year climate pattern. A listener asks how the explanation changes when the station is moved or the time period extended. The speaker should revise the diagram and name the missing evidence. This is a strong test of understanding. Use paper maps and invented values, without generating genuine warnings or directing dangerous behaviour. A Secondary learner may add a calculation with units and a limitation.
Feedback and inheritance. Identify the observation that should trigger a review of the first communication approach. Perhaps a warning reaches some households late, a sensor repeatedly fails or an outdated forecast remains widely shared. Ask who can investigate and what feedback would demonstrate improvement. This creates an accountable process instead of a vague promise of more accurate forecasts. Link this station to weather radar, then state which information future learners need to understand how the model was corrected.
Integrated project 1: six links in an information service
Bring together Weather and climate are different concepts; Observing the atmosphere systematically; Air temperature; Rainfall and accumulation; Wind observations; Humidity and moisture in air in one conceptual information chain. Use arrows labelled measures, checks, predicts, informs or enables review. Students should name at least two dependencies that cross professional or institutional roles. This is a safe classroom framework rather than a procedure for a real weather office.
Assign a source checker, a user-access reviewer, an uncertainty interpreter and a future-generation archivist. Each identifies a different possible weakness. The group should produce one qualified recommendation and the most credible objection, with a clear note about which real official source would be necessary before anyone acted on a weather concern.
For Primary learners, a five-box picture and two original sentences may be sufficient. Secondary pupils can write five paragraphs covering the mechanism, fictional case, uncertainty, evidence and correction. A tutor can mark accuracy of time and units, proper distinction between forecast and observation, and willingness to revise an unsupported claim.
Chapter 2: Networks, sensors and reliable data exchange
This chapter presents six related questions about the meaning, source, uncertainty and practical use of atmospheric information. A parent can select one station for a short dialogue, while a Secondary learner can compare several and examine their evidence. The teaching order is not a claim that every country follows one universal route to scientific capability.
Component 07: Air pressure and changing patterns
The specific meteorological concept. Atmospheric pressure is a measured variable useful within meteorological analysis. International weather cooperation can help people understand conditions that cross borders, but compatibility requires defined units, times, quality checks and trustworthy exchange. Students should draw the pathway from one observation to a shared forecast product. Where metadata are absent, the reported value may be hard to interpret. An effective explanation identifies what common language makes cooperation possible without claiming every country uses identical instruments. Explain air pressure and changing patterns as a defined observation, process or public service with identifiable inputs and an appropriate time or location.
Case from fictional Tidal Reach. The town’s model barometer readings change over several fictional hours. Introduce a second fictional source that uses a different time or unit. If students immediately compare the numbers, they may reach an erroneous conclusion. Ask them to reconcile the definitions and reference periods first. This illustrates why compatible records and metadata are essential when information crosses institutions and countries. Ask what information is actually supplied and what the learner inferred without evidence. The case is not a real dataset or local forecast.
The interpretive risk. A pressure change alone cannot guarantee one specific next event. International standards and global guidance aid consistency, but local user needs and hazards differ. Ask which terms, units and quality conditions should be shared and which forms of communication require contextual adaptation. The aim is not to copy one national system uncritically. It is to explain how useful information travels while keeping the actual decision’s location and authority visible. A reasonable alternative explanation should be considered before deciding that one measurement or agency action was wrong. Identify the scope of the question and relevant professional role.
Evidence and a falsifiable check. Ask which other observations and expert methods are necessary. A rise in reports of extreme conditions may reflect changing hazards, observation coverage or classification. A falling incident count might reflect better protection or incomplete reporting. Ask which independent evidence would help distinguish these explanations. Good public science considers changes in methods and exposure, not only the shape of a graph. Name one result that would challenge the current conclusion and another piece of information that would improve it. Make no real-world weather or emergency decisions from the imaginary numbers.
A safe parent-and-tutor lesson. Place hypothetical pressure readings on a labelled timeline. Design a plain-language weather-information card for a fictional person who missed an earlier update. It must state issue time, applicable place, source and uncertainty, and direct the reader to current competent services for any real advice. Test the wording with another pupil. No classroom message should be presented as a genuine public warning. Use paper maps and invented values, without generating genuine warnings or directing dangerous behaviour. A Secondary learner may add a calculation with units and a limitation.
Feedback and inheritance. Compare the original and revised diagrams. Name a corrected time window, a newly recognised data source and one user whose access had been overlooked. Another learner should be able to follow the improved reasoning independently. The opportunity to inspect and revise knowledge is a crucial capability of a civilisation facing changing conditions. Link this station to station siting and representativeness, then state which information future learners need to understand how the model was corrected.
Component 08: Cloud observations
The specific meteorological concept. Cloud cover and types can be observed, while complex forecasting requires more than a quick visual label. Weather science is a continuing capability. Instruments drift, networks expand, computer models improve and public communication needs can change. A service that worked once must still be maintained, assessed and updated as new evidence emerges. Ask what a future meteorologist would need to know about earlier observations and decisions. Preserving methods and their limitations is as important as preserving the raw numbers. Explain cloud observations as a defined observation, process or public service with identifiable inputs and an appropriate time or location.
Case from fictional Tidal Reach. A child calls one cloud shape proof that a storm will occur later. Pause the fictional weather case before a conclusion is drawn. What does the story report as an observation, what does it predict and what has the pupil inferred? An instrument reading describes a specific condition, while a future claim may rely on modelling and uncertainty. The learner should label those roles separately. The invented town provides no actual forecast for Singapore or any other location. Ask what information is actually supplied and what the learner inferred without evidence. The case is not a real dataset or local forecast.
The interpretive risk. A cloud sketch cannot replace a professional forecast. The strongest objection to a proposed weather-information product may concern the wrong variable, time horizon or user group. Ask students to state that objection carefully before proposing an alternative. A forecast for a city may be useful and still be insufficient for a specialised marine or aviation decision. The goal is choosing relevant evidence, not demanding that one message solve every problem. A reasonable alternative explanation should be considered before deciding that one measurement or agency action was wrong. Identify the scope of the question and relevant professional role.
Evidence and a falsifiable check. Describe what was seen and what remains a prediction. Every rate needs the correct denominator. Ten predicted rainy days from fifty forecast periods is a different question from the amount of rain on those days. Even a properly calculated proportion may be misleading if ‘rain’ was not defined for the event and location. Ask students to name the exact forecast event before interpreting any percentage. Name one result that would challenge the current conclusion and another piece of information that would improve it. Make no real-world weather or emergency decisions from the imaginary numbers.
A safe parent-and-tutor lesson. Draw an original cloud observation with time and uncertainty noted. Prepare four cards: a measured condition, a predicted event, a possible communication problem and an evidence check. Shuffle them and ask the child to arrange a causal explanation. Change one assumption such as the valid forecast time and invite revision. This reveals whether the student understands observation and prediction rather than merely repeating weather vocabulary. Use paper maps and invented values, without generating genuine warnings or directing dangerous behaviour. A Secondary learner may add a calculation with units and a limitation.
Feedback and inheritance. Move the weather service into the next decade. Instruments, data volume, environmental conditions and user needs may change. Which principles of clear provenance, trustworthy forecasts and accessible warnings should remain? Which methods might need revision? A civilisation passes on the capability to interpret uncertainty, not merely a collection of old charts. Link this station to quality control and missing data, then state which information future learners need to understand how the model was corrected.
Component 09: Surface weather stations
The specific meteorological concept. Fixed and automated stations can supply repeated measurements with consistent metadata and maintenance. Some information appears more precise than its evidence justifies. A highly detailed map can contain uncertain estimates, and a long-range outlook can be useful without predicting the exact state of one street. Distinguish observed conditions, modelled expectations and public interpretation. The reader should be able to identify a credible reason for uncertainty rather than assuming every numerical figure is exact. Explain surface weather stations as a defined observation, process or public service with identifiable inputs and an appropriate time or location.
Case from fictional Tidal Reach. A station stops logging during the afternoon but the town displays a smooth chart anyway. Have pupils mark where an observation ends and an inference begins. A cloud picture, radar colour or temperature value may support a claim, but what it establishes depends on its provenance, method and context. A teacher can ask for one plausible alternative interpretation and the evidence that would help distinguish them. This is a safe way to practise genuine uncertainty. Ask what information is actually supplied and what the learner inferred without evidence. The case is not a real dataset or local forecast.
The interpretive risk. Missing data can be mistaken for stable conditions. The cost of a weak information system may be transferred to people who are absent from the planning process. A remote community or someone without digital access may receive an alert late, even when aggregate delivery statistics appear good. Ask which group’s experience the dashboard omits and how it could be studied respectfully. The possibility warrants checking, not an unsupported claim about every resident. A reasonable alternative explanation should be considered before deciding that one measurement or agency action was wrong. Identify the scope of the question and relevant professional role.
Evidence and a falsifiable check. Record gaps, station status and appropriate quality flags. Several observers may see different parts of one weather situation. A station records a quantitative variable, a resident reports a local effect and an agency evaluates regional hazards. None of these perspectives automatically captures everything. A responsible analysis considers the evidence’s type and scope without treating one anecdote as a national pattern or dismissing a legitimate local concern. Name one result that would challenge the current conclusion and another piece of information that would improve it. Make no real-world weather or emergency decisions from the imaginary numbers.
A safe parent-and-tutor lesson. Repair a fictional station dataset that includes missing values. Run a respectful debate between an imaginary farmer, school organiser and information specialist. Each may need a different forecast horizon or variable. Have pupils restate the strongest concern of another role before proposing an accessible communication product. The purpose is to clarify user needs and evidence, not to pretend that classroom participants are authorised emergency managers. Use paper maps and invented values, without generating genuine warnings or directing dangerous behaviour. A Secondary learner may add a calculation with units and a limitation.
Feedback and inheritance. Sometimes the next responsible step is obtaining better data or consulting a qualified meteorological agency, not improvising a warning. That is not an excuse to ignore a human need. State precisely what is unknown and where authoritative information can be found. A classroom exercise cannot substitute for local flood, aviation or medical expertise. Link this station to standardised international data exchange, then state which information future learners need to understand how the model was corrected.
Component 10: Marine observations
The specific meteorological concept. Buoys, ships and coastal stations contribute information relevant to oceans and weather. An early-warning service has several stages beyond prediction. Understanding who is exposed, providing an appropriate alert, ensuring people receive it and connecting the information to legitimate response arrangements are separate functions. Ask which stage the imagined town has and which is missing. A sensor does not protect anybody merely by producing data. Protection depends on useful human and institutional links. Explain marine observations as a defined observation, process or public service with identifiable inputs and an appropriate time or location.
Case from fictional Tidal Reach. The imaginary harbour relies on one coastal sensor that is out of service. Retell the invented case to a younger pupil using a map, a date and a clear uncertainty statement. Another reader should be able to distinguish what was known when the message was issued from what happened later in the fictional story. This avoids hindsight bias. A later outcome should not be used to pretend that an earlier forecast had access to future observations. Ask what information is actually supplied and what the learner inferred without evidence. The case is not a real dataset or local forecast.
The interpretive risk. A land station cannot necessarily represent offshore conditions. An alert sent to a platform may not be received by everyone. Communications access, language, disability, power outages and trust can affect actual usefulness. Give two fictional residents different practical circumstances and trace their routes from warning source to understanding. Do not infer one person’s needs from a label. This keeps accessibility central without sacrificing factual care. A reasonable alternative explanation should be considered before deciding that one measurement or agency action was wrong. Identify the scope of the question and relevant professional role.
Evidence and a falsifiable check. Ask which observation source covers the intended location and its limits. A classroom dataset cannot establish real flood safety, weather-warning categories or medical heat thresholds. Those depend on current authoritative services and professional expertise. Children may calculate hypothetical differences while recognising that real-world decisions need local conditions and legally competent organisations. Naming the boundary makes the educational analysis more accurate. Name one result that would challenge the current conclusion and another piece of information that would improve it. Make no real-world weather or emergency decisions from the imaginary numbers.
A safe parent-and-tutor lesson. Draw an abstract coastal data network with a gap marked. Invite a one-minute teach-back in which a student explains the difference between yesterday’s observation, tomorrow’s forecast and a multi-year climate pattern. A listener asks how the explanation changes when the station is moved or the time period extended. The speaker should revise the diagram and name the missing evidence. This is a strong test of understanding. Use paper maps and invented values, without generating genuine warnings or directing dangerous behaviour. A Secondary learner may add a calculation with units and a limitation.
Feedback and inheritance. Identify the observation that should trigger a review of the first communication approach. Perhaps a warning reaches some households late, a sensor repeatedly fails or an outdated forecast remains widely shared. Ask who can investigate and what feedback would demonstrate improvement. This creates an accountable process instead of a vague promise of more accurate forecasts. Link this station to forecasting as a model of the future, then state which information future learners need to understand how the model was corrected.
Component 11: Upper-air observations
The specific meteorological concept. Conditions aloft differ from those at the ground and need suitable observational systems. Different geographical conditions can affect what a weather service needs. A coastal settlement, mountain community and dense city can have different exposures and forecasting questions, without one being inherently more capable or valuable. A responsible comparison identifies the human decision and local evidence. Students can transfer the principle of trustworthy information while avoiding assumptions about identical climate or infrastructure. Explain upper-air observations as a defined observation, process or public service with identifiable inputs and an appropriate time or location.
Case from fictional Tidal Reach. A fictional balloon dataset is used to explain weather above the town. Imagine that the forecaster is competent, but one station is offline or a message loses its date. The public result may still become misleading through a process failure rather than deliberate deception. Ask exactly where the observation or communication chain is incomplete. The class can propose a correction to the workflow without pretending to perform professional meteorology. Ask what information is actually supplied and what the learner inferred without evidence. The case is not a real dataset or local forecast.
The interpretive risk. A ground thermometer cannot describe the complete vertical atmosphere. An apparently detailed observation can still be unrepresentative. A sensor may sit in a location unlike the one the user cares about, or data from a short period may be interpreted as a long-term pattern. Ask whether the relevant time, place and measurement method match the claim. A stronger-looking number is not automatically more useful if it answers the wrong question. A reasonable alternative explanation should be considered before deciding that one measurement or agency action was wrong. Identify the scope of the question and relevant professional role.
Evidence and a falsifiable check. Identify the variable, height or pressure level and qualified measurement method. Before comparing two weather records, check station conditions, instrument definitions, observation periods and units. The meaning of a precipitation rate differs from accumulated rainfall, and a climate normal differs from a day’s measurement. A confident comparison built on mismatched categories is misleading. The class should state incompatibility explicitly rather than invent a conversion that does not apply. Name one result that would challenge the current conclusion and another piece of information that would improve it. Make no real-world weather or emergency decisions from the imaginary numbers.
A safe parent-and-tutor lesson. Build a paper vertical-profile diagram with invented data. Design a plain-language weather-information card for a fictional person who missed an earlier update. It must state issue time, applicable place, source and uncertainty, and direct the reader to current competent services for any real advice. Test the wording with another pupil. No classroom message should be presented as a genuine public warning. Use paper maps and invented values, without generating genuine warnings or directing dangerous behaviour. A Secondary learner may add a calculation with units and a limitation.
Feedback and inheritance. Compare the original and revised diagrams. Name a corrected time window, a newly recognised data source and one user whose access had been overlooked. Another learner should be able to follow the improved reasoning independently. The opportunity to inspect and revise knowledge is a crucial capability of a civilisation facing changing conditions. Link this station to numerical weather prediction, then state which information future learners need to understand how the model was corrected.
Component 12: Weather satellites
The specific meteorological concept. Satellites provide valuable remote sensing observations subject to instrument and processing limits. The most sophisticated scientific method is not useful when a member of the public cannot understand its essential message. A report may require plain wording, accurate uncertainty, a correct issue time and suitable communication routes. The learner should identify how information travels from expert analysis to a person who needs it. That final human step makes communication and accessibility part of meteorological capability. Explain weather satellites as a defined observation, process or public service with identifiable inputs and an appropriate time or location.
Case from fictional Tidal Reach. A satellite image reveals large cloud systems but no direct household rainfall total. A community may receive a scientifically sound message yet be unsure which public authority is responsible for the next stage. The model should distinguish forecast provider, warning issuer and response organisation rather than merge them into one imagined expert. A child can identify those institutional roles without being asked to carry out real emergency actions. Ask what information is actually supplied and what the learner inferred without evidence. The case is not a real dataset or local forecast.
The interpretive risk. Image appearance does not establish every surface variable. Two apparently different information products may share one flawed source. A warning application and a news broadcast could rely on the same outdated official message. Draw the chain of provenance before calling the reports independent confirmation. Recognising a common source helps students interpret apparent agreement and understand why timely corrections matter. A reasonable alternative explanation should be considered before deciding that one measurement or agency action was wrong. Identify the scope of the question and relevant professional role.
Evidence and a falsifiable check. Distinguish remote sensing estimates from direct ground observations. An apparent relationship between weather and another outcome may have alternative causes. Crop yields, energy demand or school attendance are also influenced by economic and social conditions. Ask the learner to list at least one plausible confounder and explain what additional evidence would help separate it. Correlation is not automatically proof of a single meteorological cause. Name one result that would challenge the current conclusion and another piece of information that would improve it. Make no real-world weather or emergency decisions from the imaginary numbers.
A safe parent-and-tutor lesson. Compare a conceptual satellite cloud view with fictional station values. Prepare four cards: a measured condition, a predicted event, a possible communication problem and an evidence check. Shuffle them and ask the child to arrange a causal explanation. Change one assumption such as the valid forecast time and invite revision. This reveals whether the student understands observation and prediction rather than merely repeating weather vocabulary. Use paper maps and invented values, without generating genuine warnings or directing dangerous behaviour. A Secondary learner may add a calculation with units and a limitation.
Feedback and inheritance. Move the weather service into the next decade. Instruments, data volume, environmental conditions and user needs may change. Which principles of clear provenance, trustworthy forecasts and accessible warnings should remain? Which methods might need revision? A civilisation passes on the capability to interpret uncertainty, not merely a collection of old charts. Link this station to forecast ensembles and spread, then state which information future learners need to understand how the model was corrected.
Integrated project 2: six links in an information service
Bring together Air pressure and changing patterns; Cloud observations; Surface weather stations; Marine observations; Upper-air observations; Weather satellites in one conceptual information chain. Use arrows labelled measures, checks, predicts, informs or enables review. Students should name at least two dependencies that cross professional or institutional roles. This is a safe classroom framework rather than a procedure for a real weather office.
Assign a source checker, a user-access reviewer, an uncertainty interpreter and a future-generation archivist. Each identifies a different possible weakness. The group should produce one qualified recommendation and the most credible objection, with a clear note about which real official source would be necessary before anyone acted on a weather concern.
For Primary learners, a five-box picture and two original sentences may be sufficient. Secondary pupils can write five paragraphs covering the mechanism, fictional case, uncertainty, evidence and correction. A tutor can mark accuracy of time and units, proper distinction between forecast and observation, and willingness to revise an unsupported claim.
Chapter 3: Forecasting models, lead time and honest uncertainty
This chapter presents six related questions about the meaning, source, uncertainty and practical use of atmospheric information. A parent can select one station for a short dialogue, while a Secondary learner can compare several and examine their evidence. The teaching order is not a claim that every country follows one universal route to scientific capability.
Component 13: Weather radar
The specific meteorological concept. Radar can support observation of precipitation patterns with known technical limitations. Weather is an observation problem before it becomes a prediction problem. Ask what the instrument or information product is describing, where the measurement applies and when it was obtained. A child’s everyday impression of rain or wind can be useful as a question, but it does not automatically establish a professional meteorological conclusion. The system needs reliable methods, institutional maintenance and appropriate interpretation to turn scattered observations into shared information. Explain weather radar as a defined observation, process or public service with identifiable inputs and an appropriate time or location.
Case from fictional Tidal Reach. A model radar map shows precipitation near the river but none of the gauges are functioning. Draw a short timeline with a measurement, an analysis, a forecast issue time and the period the forecast refers to. A common source of confusion is treating the last recorded observation as a statement about the future. Ask what information would be needed to connect them. This develops scientific literacy through a harmless diagram rather than an unsound prediction. Ask what information is actually supplied and what the learner inferred without evidence. The case is not a real dataset or local forecast.
The interpretive risk. A colour patch alone does not prove the exact depth of rainfall at a school. One successful warning or forecast does not prove a service will remain dependable forever. Instruments need upkeep, data systems must continue and people change how they access information. Extend the case from the first result to the next season and next generation. Who maintains the capability, and what record will help a successor evaluate it? Public knowledge requires continuing institutions rather than occasional luck. A reasonable alternative explanation should be considered before deciding that one measurement or agency action was wrong. Identify the scope of the question and relevant professional role.
Evidence and a falsifiable check. Ask about calibration, location, uncertainty and other data sources. Outputs are not outcomes. An agency may issue many forecasts or install many stations, yet intended people could still receive messages too late or misunderstand them. Define what information was produced and what practical action or understanding was intended. A complete evaluation may need several indicators, including access and comprehensibility, rather than one count of published reports. Name one result that would challenge the current conclusion and another piece of information that would improve it. Make no real-world weather or emergency decisions from the imaginary numbers.
A safe parent-and-tutor lesson. Annotate a fictional radar panel with a clear explanatory legend. Run a respectful debate between an imaginary farmer, school organiser and information specialist. Each may need a different forecast horizon or variable. Have pupils restate the strongest concern of another role before proposing an accessible communication product. The purpose is to clarify user needs and evidence, not to pretend that classroom participants are authorised emergency managers. Use paper maps and invented values, without generating genuine warnings or directing dangerous behaviour. A Secondary learner may add a calculation with units and a limitation.
Feedback and inheritance. Sometimes the next responsible step is obtaining better data or consulting a qualified meteorological agency, not improvising a warning. That is not an excuse to ignore a human need. State precisely what is unknown and where authoritative information can be found. A classroom exercise cannot substitute for local flood, aviation or medical expertise. Link this station to probability and honest language, then state which information future learners need to understand how the model was corrected.
Component 14: Station siting and representativeness
The specific meteorological concept. The place a sensor is installed affects which conditions its record describes. The value of meteorological knowledge comes from coordinating many different sources. A station, satellite or radar may observe a particular aspect of the environment, while a forecast combines evidence and scientific modelling under stated limits. Identify what each stage contributes. A visible cloud image cannot independently prove a future outcome. A strong learner explains the transformations from data to analysis to useful communication instead of treating forecasts as magic. Explain station siting and representativeness as a defined observation, process or public service with identifiable inputs and an appropriate time or location.
Case from fictional Tidal Reach. One thermometer sits near an air-conditioning exhaust while another is in a more appropriate site. Write the story from the perspective of the weather-service provider and the end user. The provider knows which product was issued and how it was constructed. The user needs to know what it means for a decision. An accurate report might still fail in practice if the message is inaccessible or taken out of date. Ask which feedback would make that gap visible. Ask what information is actually supplied and what the learner inferred without evidence. The case is not a real dataset or local forecast.
The interpretive risk. A poorly sited instrument can produce misleading local values. A high-resolution map or a percentage with many decimal places can create false certainty when observations or model inputs remain uncertain. The pupil should describe how the evidence supports the level of detail used in the claim. The proper response may be a range, a probability or a note about limitations rather than a more emphatic prediction. A reasonable alternative explanation should be considered before deciding that one measurement or agency action was wrong. Identify the scope of the question and relevant professional role.
Evidence and a falsifiable check. Ask which authorised siting standards and exposure information would be relevant. Make an evidence trail: observation or source, method, data quality, analysis, product issue time, public interpretation and review. Another student should be able to identify where a forecast becomes a decision-relevant message. A missing field is a useful research question. Metadata and provenance matter because many different users depend on shared data. Name one result that would challenge the current conclusion and another piece of information that would improve it. Make no real-world weather or emergency decisions from the imaginary numbers.
A safe parent-and-tutor lesson. Draw two imaginary sites and list potential measurement biases. Invite a one-minute teach-back in which a student explains the difference between yesterday’s observation, tomorrow’s forecast and a multi-year climate pattern. A listener asks how the explanation changes when the station is moved or the time period extended. The speaker should revise the diagram and name the missing evidence. This is a strong test of understanding. Use paper maps and invented values, without generating genuine warnings or directing dangerous behaviour. A Secondary learner may add a calculation with units and a limitation.
Feedback and inheritance. Identify the observation that should trigger a review of the first communication approach. Perhaps a warning reaches some households late, a sensor repeatedly fails or an outdated forecast remains widely shared. Ask who can investigate and what feedback would demonstrate improvement. This creates an accountable process instead of a vague promise of more accurate forecasts. Link this station to lead time and changing reliability, then state which information future learners need to understand how the model was corrected.
Component 15: Quality control and missing data
The specific meteorological concept. Meteorological data need validation, error flags and transparent handling of gaps. Begin with a defined variable, location and time window. A rainfall total, temperature maximum and probability of an event answer different questions, even when they appear together in one weather application. The learner should be able to describe precisely what is measured or predicted and what remains outside the scope. This prevents attractive graphics from becoming false certainty about a specific resident’s future conditions. Explain quality control and missing data as a defined observation, process or public service with identifiable inputs and an appropriate time or location.
Case from fictional Tidal Reach. An automatic sensor reports an impossible-looking value after a fictional malfunction. End the story with the user’s actual decision context rather than the numerical value alone. Did the person receive the correct, current message? Was the warning clearly distinguished from a longer forecast? Which authority would be responsible for official action? The class can answer in conceptual terms and explicitly mark where professional or local guidance would be required. Ask what information is actually supplied and what the learner inferred without evidence. The case is not a real dataset or local forecast.
The interpretive risk. Silently deleting inconvenient readings can distort a result or conceal a failure. Real warnings and protective decisions involve public responsibilities and expert judgement. A classroom analogy should never determine evacuation triggers, clinical heat advice, flight safety decisions or flood-engineering thresholds. Identify which current official sources and qualified professionals would be necessary. Children can analyse the architecture of information and accountability without giving hazardous instructions. A reasonable alternative explanation should be considered before deciding that one measurement or agency action was wrong. Identify the scope of the question and relevant professional role.
Evidence and a falsifiable check. Distinguish suspect, missing, corrected and accepted observations. A useful forecast check allows the original prediction to be challenged. Ask which observation, collected at the appropriate place and time, would reveal that the forecast differed from reality. Then distinguish a single event from repeated measures of forecast skill. An honest service uses verification to improve, not merely to select its most flattering examples. Name one result that would challenge the current conclusion and another piece of information that would improve it. Make no real-world weather or emergency decisions from the imaginary numbers.
A safe parent-and-tutor lesson. Make a small fictional quality-control table with reasons for flags. Design a plain-language weather-information card for a fictional person who missed an earlier update. It must state issue time, applicable place, source and uncertainty, and direct the reader to current competent services for any real advice. Test the wording with another pupil. No classroom message should be presented as a genuine public warning. Use paper maps and invented values, without generating genuine warnings or directing dangerous behaviour. A Secondary learner may add a calculation with units and a limitation.
Feedback and inheritance. Compare the original and revised diagrams. Name a corrected time window, a newly recognised data source and one user whose access had been overlooked. Another learner should be able to follow the improved reasoning independently. The opportunity to inspect and revise knowledge is a crucial capability of a civilisation facing changing conditions. Link this station to forecast verification and learning, then state which information future learners need to understand how the model was corrected.
Component 16: Standardised international data exchange
The specific meteorological concept. Weather systems gain value when authorised agencies can exchange compatible information across borders. Weather systems support ordinary public activities through specialised work that is easy to overlook. Instrument technicians, forecasters, data specialists, warning communicators, local authorities and users play different roles. A useful service depends on their coordination; no single weather station can carry out every task. Ask the pupil to name which information changes hands and how a misunderstanding might affect the eventual public decision. Explain standardised international data exchange as a defined observation, process or public service with identifiable inputs and an appropriate time or location.
Case from fictional Tidal Reach. Two neighbouring services use incompatible timestamps and units in a shared report. Change one condition in the invented story while keeping the rest stable. A forecast horizon might become longer, the reporting site may move or the intended audience may be different. Which assumption in the first explanation is no longer valid? A student who revises the model accurately has learned more than one who repeats a single sentence about rain and sunshine. Ask what information is actually supplied and what the learner inferred without evidence. The case is not a real dataset or local forecast.
The interpretive risk. Digital transmission without compatible definitions can create wrong interpretations. Future generations may inherit more capable observing systems along with ongoing maintenance and data-preservation duties. A historical climate series loses usefulness if station changes and methods are not documented. Ask which records a future learner must understand to make a fair comparison. A civic service that retains its evidence and correction history becomes more adaptable. A reasonable alternative explanation should be considered before deciding that one measurement or agency action was wrong. Identify the scope of the question and relevant professional role.
Evidence and a falsifiable check. Check unit, time reference, metadata, provenance and update cadence. Before drawing a conclusion, define whether the information is an observation, a forecast, a probability or a climate statistic. They describe different things. State the variable, location, time period and source. The student should also identify whether the report is official, historical or fictional. A number without its context can become a false claim even when the arithmetic displayed beside it is correct. Name one result that would challenge the current conclusion and another piece of information that would improve it. Make no real-world weather or emergency decisions from the imaginary numbers.
A safe parent-and-tutor lesson. Rewrite an invented cross-border message into a clearly labelled format. Prepare four cards: a measured condition, a predicted event, a possible communication problem and an evidence check. Shuffle them and ask the child to arrange a causal explanation. Change one assumption such as the valid forecast time and invite revision. This reveals whether the student understands observation and prediction rather than merely repeating weather vocabulary. Use paper maps and invented values, without generating genuine warnings or directing dangerous behaviour. A Secondary learner may add a calculation with units and a limitation.
Feedback and inheritance. Move the weather service into the next decade. Instruments, data volume, environmental conditions and user needs may change. Which principles of clear provenance, trustworthy forecasts and accessible warnings should remain? Which methods might need revision? A civilisation passes on the capability to interpret uncertainty, not merely a collection of old charts. Link this station to multi-hazard early-warning architecture, then state which information future learners need to understand how the model was corrected.
Component 17: Forecasting as a model of the future
The specific meteorological concept. A forecast uses observations and scientific analysis to estimate future conditions; it is not an observed future. The physical atmosphere cannot be controlled by a council announcement. A civilisation instead develops the capability to observe, estimate possibilities and communicate relevant risks. That capacity has limits because conditions change and observations are incomplete. A strong explanation respects uncertainty without treating all forecasts as useless. The task is to describe what scientific knowledge can inform and what it cannot guarantee. Explain forecasting as a model of the future as a defined observation, process or public service with identifiable inputs and an appropriate time or location.
Case from fictional Tidal Reach. The town’s weather desk issues an imaginary forecast of rain tomorrow. Ask which resident would be missing from a digital-only warning programme. Someone without a connected device or accessible language may not receive the message in a useful form. Do not assume every member of an imagined category has identical needs. Instead, ask what alternate communication route would merit real testing and what observation would show successful understanding. Ask what information is actually supplied and what the learner inferred without evidence. The case is not a real dataset or local forecast.
The interpretive risk. The forecast can be sensible and still differ from what later happens. A new sensor or model may have a public benefit, but equipment and data collection also require funding, technical capability and maintenance. Ask what other useful task may be delayed when resources are assigned to one part of the chain. In the classroom, paper tokens can illustrate the opportunity cost, while actual decisions depend on professional budgets and public priorities. A reasonable alternative explanation should be considered before deciding that one measurement or agency action was wrong. Identify the scope of the question and relevant professional role.
Evidence and a falsifiable check. Separate observation, predicted variable, valid time and model assumptions. End with the scope of the claim. A WMO 2025 report describes the status and definitions of its reference period, not current live conditions at the reader’s address. A climate scenario is not a guaranteed weather forecast, and Tidal Reach is imaginary. An accurate explanation makes these differences obvious to a younger reader. Name one result that would challenge the current conclusion and another piece of information that would improve it. Make no real-world weather or emergency decisions from the imaginary numbers.
A safe parent-and-tutor lesson. Write two versions of a hypothetical forecast and label each uncertainty. Run a respectful debate between an imaginary farmer, school organiser and information specialist. Each may need a different forecast horizon or variable. Have pupils restate the strongest concern of another role before proposing an accessible communication product. The purpose is to clarify user needs and evidence, not to pretend that classroom participants are authorised emergency managers. Use paper maps and invented values, without generating genuine warnings or directing dangerous behaviour. A Secondary learner may add a calculation with units and a limitation.
Feedback and inheritance. Sometimes the next responsible step is obtaining better data or consulting a qualified meteorological agency, not improvising a warning. That is not an excuse to ignore a human need. State precisely what is unknown and where authoritative information can be found. A classroom exercise cannot substitute for local flood, aviation or medical expertise. Link this station to understanding risk and exposure, then state which information future learners need to understand how the model was corrected.
Component 18: Numerical weather prediction
The specific meteorological concept. Computational models represent atmospheric processes using scientific equations, input data and approximations. A forecast’s purpose depends on the decision a person faces. A farmer, teacher, airport professional or family may need different timescales, locations and formats. The same published number may be highly relevant for one question and inadequate for another. Ask which user is involved and what outcome they are trying to plan. This turns weather information from a collection of interesting measurements into a contextual public service. Explain numerical weather prediction as a defined observation, process or public service with identifiable inputs and an appropriate time or location.
Case from fictional Tidal Reach. A student assumes a model can represent every leaf, road and cloud exactly. Let one imagined resident use the forecast to plan a school activity while another relies on it for an agricultural or transport question. They may need different variables or timescales. The contrast does not prove one is a better reader. It reveals the need to define a user purpose and choose appropriate information. Both should know where authoritative guidance is obtained for real conditions. Ask what information is actually supplied and what the learner inferred without evidence. The case is not a real dataset or local forecast.
The interpretive risk. Finite model resolution and imperfect starting states create limitations. Forecast accuracy and public usefulness are different but connected questions. A model may make an appropriate probabilistic statement while a reader assumes it promises a particular outcome. Identify the gap between the scientific meaning and the public interpretation. The response may involve clearer communication as well as better data. It is important not to label every mismatch a failure of professional competence. A reasonable alternative explanation should be considered before deciding that one measurement or agency action was wrong. Identify the scope of the question and relevant professional role.
Evidence and a falsifiable check. Identify the roles of observations, model physics and forecast evaluation. Monitoring is useful when qualified people use the result to revise products and public communication. Who checks instrument performance, evaluates forecasts and receives user feedback? A dashboard that no one reviews is not a complete civic service. The learner should follow the evidence to an accountable correction and back to the people the information was intended to help. Name one result that would challenge the current conclusion and another piece of information that would improve it. Make no real-world weather or emergency decisions from the imaginary numbers.
A safe parent-and-tutor lesson. Draw a non-operational data-to-model-to-forecast diagram. Invite a one-minute teach-back in which a student explains the difference between yesterday’s observation, tomorrow’s forecast and a multi-year climate pattern. A listener asks how the explanation changes when the station is moved or the time period extended. The speaker should revise the diagram and name the missing evidence. This is a strong test of understanding. Use paper maps and invented values, without generating genuine warnings or directing dangerous behaviour. A Secondary learner may add a calculation with units and a limitation.
Feedback and inheritance. Identify the observation that should trigger a review of the first communication approach. Perhaps a warning reaches some households late, a sensor repeatedly fails or an outdated forecast remains widely shared. Ask who can investigate and what feedback would demonstrate improvement. This creates an accountable process instead of a vague promise of more accurate forecasts. Link this station to impact-based warnings, then state which information future learners need to understand how the model was corrected.
Integrated project 3: six links in an information service
Bring together Weather radar; Station siting and representativeness; Quality control and missing data; Standardised international data exchange; Forecasting as a model of the future; Numerical weather prediction in one conceptual information chain. Use arrows labelled measures, checks, predicts, informs or enables review. Students should name at least two dependencies that cross professional or institutional roles. This is a safe classroom framework rather than a procedure for a real weather office.
Assign a source checker, a user-access reviewer, an uncertainty interpreter and a future-generation archivist. Each identifies a different possible weakness. The group should produce one qualified recommendation and the most credible objection, with a clear note about which real official source would be necessary before anyone acted on a weather concern.
For Primary learners, a five-box picture and two original sentences may be sufficient. Secondary pupils can write five paragraphs covering the mechanism, fictional case, uncertainty, evidence and correction. A tutor can mark accuracy of time and units, proper distinction between forecast and observation, and willingness to revise an unsupported claim.
Chapter 4: Early warning, communication and authorised response
This chapter presents six related questions about the meaning, source, uncertainty and practical use of atmospheric information. A parent can select one station for a short dialogue, while a Secondary learner can compare several and examine their evidence. The teaching order is not a claim that every country follows one universal route to scientific capability.
Component 19: Forecast ensembles and spread
The specific meteorological concept. Multiple model realisations can help characterise uncertainty without making the future certain. International weather cooperation can help people understand conditions that cross borders, but compatibility requires defined units, times, quality checks and trustworthy exchange. Students should draw the pathway from one observation to a shared forecast product. Where metadata are absent, the reported value may be hard to interpret. An effective explanation identifies what common language makes cooperation possible without claiming every country uses identical instruments. Explain forecast ensembles and spread as a defined observation, process or public service with identifiable inputs and an appropriate time or location.
Case from fictional Tidal Reach. Four fictional model outputs disagree on tomorrow’s model rainfall amount. Introduce a second fictional source that uses a different time or unit. If students immediately compare the numbers, they may reach an erroneous conclusion. Ask them to reconcile the definitions and reference periods first. This illustrates why compatible records and metadata are essential when information crosses institutions and countries. Ask what information is actually supplied and what the learner inferred without evidence. The case is not a real dataset or local forecast.
The interpretive risk. One deterministic number can conceal plausible alternatives. International standards and global guidance aid consistency, but local user needs and hazards differ. Ask which terms, units and quality conditions should be shared and which forms of communication require contextual adaptation. The aim is not to copy one national system uncritically. It is to explain how useful information travels while keeping the actual decision’s location and authority visible. A reasonable alternative explanation should be considered before deciding that one measurement or agency action was wrong. Identify the scope of the question and relevant professional role.
Evidence and a falsifiable check. Distinguish ensemble scenarios, probability and confidence in a careful explanation. A rise in reports of extreme conditions may reflect changing hazards, observation coverage or classification. A falling incident count might reflect better protection or incomplete reporting. Ask which independent evidence would help distinguish these explanations. Good public science considers changes in methods and exposure, not only the shape of a graph. Name one result that would challenge the current conclusion and another piece of information that would improve it. Make no real-world weather or emergency decisions from the imaginary numbers.
A safe parent-and-tutor lesson. Compare invented five-member outputs and describe their range. Design a plain-language weather-information card for a fictional person who missed an earlier update. It must state issue time, applicable place, source and uncertainty, and direct the reader to current competent services for any real advice. Test the wording with another pupil. No classroom message should be presented as a genuine public warning. Use paper maps and invented values, without generating genuine warnings or directing dangerous behaviour. A Secondary learner may add a calculation with units and a limitation.
Feedback and inheritance. Compare the original and revised diagrams. Name a corrected time window, a newly recognised data source and one user whose access had been overlooked. Another learner should be able to follow the improved reasoning independently. The opportunity to inspect and revise knowledge is a crucial capability of a civilisation facing changing conditions. Link this station to official alerts and authoritative sources, then state which information future learners need to understand how the model was corrected.
Component 20: Probability and honest language
The specific meteorological concept. A probability forecast expresses a defined chance under a specific forecast method and event. Weather science is a continuing capability. Instruments drift, networks expand, computer models improve and public communication needs can change. A service that worked once must still be maintained, assessed and updated as new evidence emerges. Ask what a future meteorologist would need to know about earlier observations and decisions. Preserving methods and their limitations is as important as preserving the raw numbers. Explain probability and honest language as a defined observation, process or public service with identifiable inputs and an appropriate time or location.
Case from fictional Tidal Reach. A notice says a 30% chance of rain but pupils assume it means rain for 30% of the day. Pause the fictional weather case before a conclusion is drawn. What does the story report as an observation, what does it predict and what has the pupil inferred? An instrument reading describes a specific condition, while a future claim may rely on modelling and uncertainty. The learner should label those roles separately. The invented town provides no actual forecast for Singapore or any other location. Ask what information is actually supplied and what the learner inferred without evidence. The case is not a real dataset or local forecast.
The interpretive risk. An undefined event and interpretation can mislead readers. The strongest objection to a proposed weather-information product may concern the wrong variable, time horizon or user group. Ask students to state that objection carefully before proposing an alternative. A forecast for a city may be useful and still be insufficient for a specialised marine or aviation decision. The goal is choosing relevant evidence, not demanding that one message solve every problem. A reasonable alternative explanation should be considered before deciding that one measurement or agency action was wrong. Identify the scope of the question and relevant professional role.
Evidence and a falsifiable check. Ask what the event, location, interval and probability actually refer to. Every rate needs the correct denominator. Ten predicted rainy days from fifty forecast periods is a different question from the amount of rain on those days. Even a properly calculated proportion may be misleading if ‘rain’ was not defined for the event and location. Ask students to name the exact forecast event before interpreting any percentage. Name one result that would challenge the current conclusion and another piece of information that would improve it. Make no real-world weather or emergency decisions from the imaginary numbers.
A safe parent-and-tutor lesson. Rewrite an imaginary percentage forecast with its event explicitly named. Prepare four cards: a measured condition, a predicted event, a possible communication problem and an evidence check. Shuffle them and ask the child to arrange a causal explanation. Change one assumption such as the valid forecast time and invite revision. This reveals whether the student understands observation and prediction rather than merely repeating weather vocabulary. Use paper maps and invented values, without generating genuine warnings or directing dangerous behaviour. A Secondary learner may add a calculation with units and a limitation.
Feedback and inheritance. Move the weather service into the next decade. Instruments, data volume, environmental conditions and user needs may change. Which principles of clear provenance, trustworthy forecasts and accessible warnings should remain? Which methods might need revision? A civilisation passes on the capability to interpret uncertainty, not merely a collection of old charts. Link this station to accessible warnings and multiple channels, then state which information future learners need to understand how the model was corrected.
Component 21: Lead time and changing reliability
The specific meteorological concept. Forecast usefulness and uncertainty change with time horizon and the kind of event being predicted. Some information appears more precise than its evidence justifies. A highly detailed map can contain uncertain estimates, and a long-range outlook can be useful without predicting the exact state of one street. Distinguish observed conditions, modelled expectations and public interpretation. The reader should be able to identify a credible reason for uncertainty rather than assuming every numerical figure is exact. Explain lead time and changing reliability as a defined observation, process or public service with identifiable inputs and an appropriate time or location.
Case from fictional Tidal Reach. A long-range speculative notice is treated as equivalent to an imminent official alert. Have pupils mark where an observation ends and an inference begins. A cloud picture, radar colour or temperature value may support a claim, but what it establishes depends on its provenance, method and context. A teacher can ask for one plausible alternative interpretation and the evidence that would help distinguish them. This is a safe way to practise genuine uncertainty. Ask what information is actually supplied and what the learner inferred without evidence. The case is not a real dataset or local forecast.
The interpretive risk. Longer lead time does not guarantee precise local event timing. The cost of a weak information system may be transferred to people who are absent from the planning process. A remote community or someone without digital access may receive an alert late, even when aggregate delivery statistics appear good. Ask which group’s experience the dashboard omits and how it could be studied respectfully. The possibility warrants checking, not an unsupported claim about every resident. A reasonable alternative explanation should be considered before deciding that one measurement or agency action was wrong. Identify the scope of the question and relevant professional role.
Evidence and a falsifiable check. Differentiate near-term warnings from longer outlooks and their limits. Several observers may see different parts of one weather situation. A station records a quantitative variable, a resident reports a local effect and an agency evaluates regional hazards. None of these perspectives automatically captures everything. A responsible analysis considers the evidence’s type and scope without treating one anecdote as a national pattern or dismissing a legitimate local concern. Name one result that would challenge the current conclusion and another piece of information that would improve it. Make no real-world weather or emergency decisions from the imaginary numbers.
A safe parent-and-tutor lesson. Build a fictional forecast update timeline with confidence notes. Run a respectful debate between an imaginary farmer, school organiser and information specialist. Each may need a different forecast horizon or variable. Have pupils restate the strongest concern of another role before proposing an accessible communication product. The purpose is to clarify user needs and evidence, not to pretend that classroom participants are authorised emergency managers. Use paper maps and invented values, without generating genuine warnings or directing dangerous behaviour. A Secondary learner may add a calculation with units and a limitation.
Feedback and inheritance. Sometimes the next responsible step is obtaining better data or consulting a qualified meteorological agency, not improvising a warning. That is not an excuse to ignore a human need. State precisely what is unknown and where authoritative information can be found. A classroom exercise cannot substitute for local flood, aviation or medical expertise. Link this station to preparedness and legitimate response, then state which information future learners need to understand how the model was corrected.
Component 22: Forecast verification and learning
The specific meteorological concept. Forecasters and services can compare predicted and observed conditions over an appropriate dataset. An early-warning service has several stages beyond prediction. Understanding who is exposed, providing an appropriate alert, ensuring people receive it and connecting the information to legitimate response arrangements are separate functions. Ask which stage the imagined town has and which is missing. A sensor does not protect anybody merely by producing data. Protection depends on useful human and institutional links. Explain forecast verification and learning as a defined observation, process or public service with identifiable inputs and an appropriate time or location.
Case from fictional Tidal Reach. Tidal Reach judges a forecasting service from one incorrect afternoon prediction. Retell the invented case to a younger pupil using a map, a date and a clear uncertainty statement. Another reader should be able to distinguish what was known when the message was issued from what happened later in the fictional story. This avoids hindsight bias. A later outcome should not be used to pretend that an earlier forecast had access to future observations. Ask what information is actually supplied and what the learner inferred without evidence. The case is not a real dataset or local forecast.
The interpretive risk. One memorable error cannot by itself determine systematic skill. An alert sent to a platform may not be received by everyone. Communications access, language, disability, power outages and trust can affect actual usefulness. Give two fictional residents different practical circumstances and trace their routes from warning source to understanding. Do not infer one person’s needs from a label. This keeps accessibility central without sacrificing factual care. A reasonable alternative explanation should be considered before deciding that one measurement or agency action was wrong. Identify the scope of the question and relevant professional role.
Evidence and a falsifiable check. Use defined outcomes, comparable observations and repeated evaluation periods. A classroom dataset cannot establish real flood safety, weather-warning categories or medical heat thresholds. Those depend on current authoritative services and professional expertise. Children may calculate hypothetical differences while recognising that real-world decisions need local conditions and legally competent organisations. Naming the boundary makes the educational analysis more accurate. Name one result that would challenge the current conclusion and another piece of information that would improve it. Make no real-world weather or emergency decisions from the imaginary numbers.
A safe parent-and-tutor lesson. Create a toy verification table with explicitly fictional forecasts. Invite a one-minute teach-back in which a student explains the difference between yesterday’s observation, tomorrow’s forecast and a multi-year climate pattern. A listener asks how the explanation changes when the station is moved or the time period extended. The speaker should revise the diagram and name the missing evidence. This is a strong test of understanding. Use paper maps and invented values, without generating genuine warnings or directing dangerous behaviour. A Secondary learner may add a calculation with units and a limitation.
Feedback and inheritance. Identify the observation that should trigger a review of the first communication approach. Perhaps a warning reaches some households late, a sensor repeatedly fails or an outdated forecast remains widely shared. Ask who can investigate and what feedback would demonstrate improvement. This creates an accountable process instead of a vague promise of more accurate forecasts. Link this station to aviation meteorology, then state which information future learners need to understand how the model was corrected.
Component 23: Multi-hazard early-warning architecture
The specific meteorological concept. An early-warning system links risk knowledge, monitoring, warning communication and preparedness for response. Different geographical conditions can affect what a weather service needs. A coastal settlement, mountain community and dense city can have different exposures and forecasting questions, without one being inherently more capable or valuable. A responsible comparison identifies the human decision and local evidence. Students can transfer the principle of trustworthy information while avoiding assumptions about identical climate or infrastructure. Explain multi-hazard early-warning architecture as a defined observation, process or public service with identifiable inputs and an appropriate time or location.
Case from fictional Tidal Reach. The fictional town has excellent sensors but no route to tell people what the information means. Imagine that the forecaster is competent, but one station is offline or a message loses its date. The public result may still become misleading through a process failure rather than deliberate deception. Ask exactly where the observation or communication chain is incomplete. The class can propose a correction to the workflow without pretending to perform professional meteorology. Ask what information is actually supplied and what the learner inferred without evidence. The case is not a real dataset or local forecast.
The interpretive risk. A sensor network alone is not an effective protective system. An apparently detailed observation can still be unrepresentative. A sensor may sit in a location unlike the one the user cares about, or data from a short period may be interpreted as a long-term pattern. Ask whether the relevant time, place and measurement method match the claim. A stronger-looking number is not automatically more useful if it answers the wrong question. A reasonable alternative explanation should be considered before deciding that one measurement or agency action was wrong. Identify the scope of the question and relevant professional role.
Evidence and a falsifiable check. Identify all four functional pillars without claiming a current national readiness score. Before comparing two weather records, check station conditions, instrument definitions, observation periods and units. The meaning of a precipitation rate differs from accumulated rainfall, and a climate normal differs from a day’s measurement. A confident comparison built on mismatched categories is misleading. The class should state incompatibility explicitly rather than invent a conversion that does not apply. Name one result that would challenge the current conclusion and another piece of information that would improve it. Make no real-world weather or emergency decisions from the imaginary numbers.
A safe parent-and-tutor lesson. Draw a four-pillar flowchart and mark one missing link. Design a plain-language weather-information card for a fictional person who missed an earlier update. It must state issue time, applicable place, source and uncertainty, and direct the reader to current competent services for any real advice. Test the wording with another pupil. No classroom message should be presented as a genuine public warning. Use paper maps and invented values, without generating genuine warnings or directing dangerous behaviour. A Secondary learner may add a calculation with units and a limitation.
Feedback and inheritance. Compare the original and revised diagrams. Name a corrected time window, a newly recognised data source and one user whose access had been overlooked. Another learner should be able to follow the improved reasoning independently. The opportunity to inspect and revise knowledge is a crucial capability of a civilisation facing changing conditions. Link this station to farming and seasonal planning, then state which information future learners need to understand how the model was corrected.
Component 24: Understanding risk and exposure
The specific meteorological concept. Weather hazards matter through their interaction with people, locations, infrastructure and vulnerability. The most sophisticated scientific method is not useful when a member of the public cannot understand its essential message. A report may require plain wording, accurate uncertainty, a correct issue time and suitable communication routes. The learner should identify how information travels from expert analysis to a person who needs it. That final human step makes communication and accessibility part of meteorological capability. Explain understanding risk and exposure as a defined observation, process or public service with identifiable inputs and an appropriate time or location.
Case from fictional Tidal Reach. The same invented rainfall affects a riverbank path and a higher school campus differently. A community may receive a scientifically sound message yet be unsure which public authority is responsible for the next stage. The model should distinguish forecast provider, warning issuer and response organisation rather than merge them into one imagined expert. A child can identify those institutional roles without being asked to carry out real emergency actions. Ask what information is actually supplied and what the learner inferred without evidence. The case is not a real dataset or local forecast.
The interpretive risk. A hazard reading alone cannot measure the full social impact. Two apparently different information products may share one flawed source. A warning application and a news broadcast could rely on the same outdated official message. Draw the chain of provenance before calling the reports independent confirmation. Recognising a common source helps students interpret apparent agreement and understand why timely corrections matter. A reasonable alternative explanation should be considered before deciding that one measurement or agency action was wrong. Identify the scope of the question and relevant professional role.
Evidence and a falsifiable check. Separate weather variable, exposed assets and appropriate vulnerability evidence. An apparent relationship between weather and another outcome may have alternative causes. Crop yields, energy demand or school attendance are also influenced by economic and social conditions. Ask the learner to list at least one plausible confounder and explain what additional evidence would help separate it. Correlation is not automatically proof of a single meteorological cause. Name one result that would challenge the current conclusion and another piece of information that would improve it. Make no real-world weather or emergency decisions from the imaginary numbers.
A safe parent-and-tutor lesson. Map two fictional neighbourhoods without assigning real safety levels. Prepare four cards: a measured condition, a predicted event, a possible communication problem and an evidence check. Shuffle them and ask the child to arrange a causal explanation. Change one assumption such as the valid forecast time and invite revision. This reveals whether the student understands observation and prediction rather than merely repeating weather vocabulary. Use paper maps and invented values, without generating genuine warnings or directing dangerous behaviour. A Secondary learner may add a calculation with units and a limitation.
Feedback and inheritance. Move the weather service into the next decade. Instruments, data volume, environmental conditions and user needs may change. Which principles of clear provenance, trustworthy forecasts and accessible warnings should remain? Which methods might need revision? A civilisation passes on the capability to interpret uncertainty, not merely a collection of old charts. Link this station to water and river forecasting, then state which information future learners need to understand how the model was corrected.
Integrated project 4: six links in an information service
Bring together Forecast ensembles and spread; Probability and honest language; Lead time and changing reliability; Forecast verification and learning; Multi-hazard early-warning architecture; Understanding risk and exposure in one conceptual information chain. Use arrows labelled measures, checks, predicts, informs or enables review. Students should name at least two dependencies that cross professional or institutional roles. This is a safe classroom framework rather than a procedure for a real weather office.
Assign a source checker, a user-access reviewer, an uncertainty interpreter and a future-generation archivist. Each identifies a different possible weakness. The group should produce one qualified recommendation and the most credible objection, with a clear note about which real official source would be necessary before anyone acted on a weather concern.
For Primary learners, a five-box picture and two original sentences may be sufficient. Secondary pupils can write five paragraphs covering the mechanism, fictional case, uncertainty, evidence and correction. A tutor can mark accuracy of time and units, proper distinction between forecast and observation, and willingness to revise an unsupported claim.
Chapter 5: Climate services for different sectors and communities
This chapter presents six related questions about the meaning, source, uncertainty and practical use of atmospheric information. A parent can select one station for a short dialogue, while a Secondary learner can compare several and examine their evidence. The teaching order is not a claim that every country follows one universal route to scientific capability.
Component 25: Impact-based warnings
The specific meteorological concept. Impact-focused information can explain potential consequences rather than only atmospheric measurements. Weather is an observation problem before it becomes a prediction problem. Ask what the instrument or information product is describing, where the measurement applies and when it was obtained. A child’s everyday impression of rain or wind can be useful as a question, but it does not automatically establish a professional meteorological conclusion. The system needs reliable methods, institutional maintenance and appropriate interpretation to turn scattered observations into shared information. Explain impact-based warnings as a defined observation, process or public service with identifiable inputs and an appropriate time or location.
Case from fictional Tidal Reach. A bulletin lists wind speed but does not explain which fictional public activities may be affected. Draw a short timeline with a measurement, an analysis, a forecast issue time and the period the forecast refers to. A common source of confusion is treating the last recorded observation as a statement about the future. Ask what information would be needed to connect them. This develops scientific literacy through a harmless diagram rather than an unsound prediction. Ask what information is actually supplied and what the learner inferred without evidence. The case is not a real dataset or local forecast.
The interpretive risk. A technical number may not be actionable for a lay reader. One successful warning or forecast does not prove a service will remain dependable forever. Instruments need upkeep, data systems must continue and people change how they access information. Extend the case from the first result to the next season and next generation. Who maintains the capability, and what record will help a successor evaluate it? Public knowledge requires continuing institutions rather than occasional luck. A reasonable alternative explanation should be considered before deciding that one measurement or agency action was wrong. Identify the scope of the question and relevant professional role.
Evidence and a falsifiable check. Ask which authorised impact context and public guidance are necessary. Outputs are not outcomes. An agency may issue many forecasts or install many stations, yet intended people could still receive messages too late or misunderstand them. Define what information was produced and what practical action or understanding was intended. A complete evaluation may need several indicators, including access and comprehensibility, rather than one count of published reports. Name one result that would challenge the current conclusion and another piece of information that would improve it. Make no real-world weather or emergency decisions from the imaginary numbers.
A safe parent-and-tutor lesson. Rewrite an invented warning to distinguish the forecast from qualified advice. Run a respectful debate between an imaginary farmer, school organiser and information specialist. Each may need a different forecast horizon or variable. Have pupils restate the strongest concern of another role before proposing an accessible communication product. The purpose is to clarify user needs and evidence, not to pretend that classroom participants are authorised emergency managers. Use paper maps and invented values, without generating genuine warnings or directing dangerous behaviour. A Secondary learner may add a calculation with units and a limitation.
Feedback and inheritance. Sometimes the next responsible step is obtaining better data or consulting a qualified meteorological agency, not improvising a warning. That is not an excuse to ignore a human need. State precisely what is unknown and where authoritative information can be found. A classroom exercise cannot substitute for local flood, aviation or medical expertise. Link this station to urban heat and local environments, then state which information future learners need to understand how the model was corrected.
Component 26: Official alerts and authoritative sources
The specific meteorological concept. People need trusted channels for current warnings and clear distinctions between official advice and speculation. The value of meteorological knowledge comes from coordinating many different sources. A station, satellite or radar may observe a particular aspect of the environment, while a forecast combines evidence and scientific modelling under stated limits. Identify what each stage contributes. A visible cloud image cannot independently prove a future outcome. A strong learner explains the transformations from data to analysis to useful communication instead of treating forecasts as magic. Explain official alerts and authoritative sources as a defined observation, process or public service with identifiable inputs and an appropriate time or location.
Case from fictional Tidal Reach. A copied old warning is reposted without its date in a neighbourhood chat. Write the story from the perspective of the weather-service provider and the end user. The provider knows which product was issued and how it was constructed. The user needs to know what it means for a decision. An accurate report might still fail in practice if the message is inaccessible or taken out of date. Ask which feedback would make that gap visible. Ask what information is actually supplied and what the learner inferred without evidence. The case is not a real dataset or local forecast.
The interpretive risk. A true former alert may become misleading when presented as current. A high-resolution map or a percentage with many decimal places can create false certainty when observations or model inputs remain uncertain. The pupil should describe how the evidence supports the level of detail used in the claim. The proper response may be a range, a probability or a note about limitations rather than a more emphatic prediction. A reasonable alternative explanation should be considered before deciding that one measurement or agency action was wrong. Identify the scope of the question and relevant professional role.
Evidence and a falsifiable check. Check originating authority, location, issue time and current status. Make an evidence trail: observation or source, method, data quality, analysis, product issue time, public interpretation and review. Another student should be able to identify where a forecast becomes a decision-relevant message. A missing field is a useful research question. Metadata and provenance matter because many different users depend on shared data. Name one result that would challenge the current conclusion and another piece of information that would improve it. Make no real-world weather or emergency decisions from the imaginary numbers.
A safe parent-and-tutor lesson. Prepare a fictional ‘verify date and authority’ checklist. Invite a one-minute teach-back in which a student explains the difference between yesterday’s observation, tomorrow’s forecast and a multi-year climate pattern. A listener asks how the explanation changes when the station is moved or the time period extended. The speaker should revise the diagram and name the missing evidence. This is a strong test of understanding. Use paper maps and invented values, without generating genuine warnings or directing dangerous behaviour. A Secondary learner may add a calculation with units and a limitation.
Feedback and inheritance. Identify the observation that should trigger a review of the first communication approach. Perhaps a warning reaches some households late, a sensor repeatedly fails or an outdated forecast remains widely shared. Ask who can investigate and what feedback would demonstrate improvement. This creates an accountable process instead of a vague promise of more accurate forecasts. Link this station to marine and coastal forecasts, then state which information future learners need to understand how the model was corrected.
Component 27: Accessible warnings and multiple channels
The specific meteorological concept. Messages must reach intended people through practical, understandable routes, including alternatives where necessary. Begin with a defined variable, location and time window. A rainfall total, temperature maximum and probability of an event answer different questions, even when they appear together in one weather application. The learner should be able to describe precisely what is measured or predicted and what remains outside the scope. This prevents attractive graphics from becoming false certainty about a specific resident’s future conditions. Explain accessible warnings and multiple channels as a defined observation, process or public service with identifiable inputs and an appropriate time or location.
Case from fictional Tidal Reach. The town sends an alert only through a smartphone application that some households cannot use. End the story with the user’s actual decision context rather than the numerical value alone. Did the person receive the correct, current message? Was the warning clearly distinguished from a longer forecast? Which authority would be responsible for official action? The class can answer in conceptual terms and explicitly mark where professional or local guidance would be required. Ask what information is actually supplied and what the learner inferred without evidence. The case is not a real dataset or local forecast.
The interpretive risk. Technical dispatch does not guarantee receipt or comprehension. Real warnings and protective decisions involve public responsibilities and expert judgement. A classroom analogy should never determine evacuation triggers, clinical heat advice, flight safety decisions or flood-engineering thresholds. Identify which current official sources and qualified professionals would be necessary. Children can analyse the architecture of information and accountability without giving hazardous instructions. A reasonable alternative explanation should be considered before deciding that one measurement or agency action was wrong. Identify the scope of the question and relevant professional role.
Evidence and a falsifiable check. Check language, accessibility, alternative channels and user feedback. A useful forecast check allows the original prediction to be challenged. Ask which observation, collected at the appropriate place and time, would reveal that the forecast differed from reality. Then distinguish a single event from repeated measures of forecast skill. An honest service uses verification to improve, not merely to select its most flattering examples. Name one result that would challenge the current conclusion and another piece of information that would improve it. Make no real-world weather or emergency decisions from the imaginary numbers.
A safe parent-and-tutor lesson. Create a tabletop notification map with fictional users. Design a plain-language weather-information card for a fictional person who missed an earlier update. It must state issue time, applicable place, source and uncertainty, and direct the reader to current competent services for any real advice. Test the wording with another pupil. No classroom message should be presented as a genuine public warning. Use paper maps and invented values, without generating genuine warnings or directing dangerous behaviour. A Secondary learner may add a calculation with units and a limitation.
Feedback and inheritance. Compare the original and revised diagrams. Name a corrected time window, a newly recognised data source and one user whose access had been overlooked. Another learner should be able to follow the improved reasoning independently. The opportunity to inspect and revise knowledge is a crucial capability of a civilisation facing changing conditions. Link this station to climate normals and historical records, then state which information future learners need to understand how the model was corrected.
Component 28: Preparedness and legitimate response
The specific meteorological concept. Early warnings are useful when connected to plans and authorities capable of appropriate action. Weather systems support ordinary public activities through specialised work that is easy to overlook. Instrument technicians, forecasters, data specialists, warning communicators, local authorities and users play different roles. A useful service depends on their coordination; no single weather station can carry out every task. Ask the pupil to name which information changes hands and how a misunderstanding might affect the eventual public decision. Explain preparedness and legitimate response as a defined observation, process or public service with identifiable inputs and an appropriate time or location.
Case from fictional Tidal Reach. Residents receive an invented storm notice but no one knows where legitimate instructions come from. Change one condition in the invented story while keeping the rest stable. A forecast horizon might become longer, the reporting site may move or the intended audience may be different. Which assumption in the first explanation is no longer valid? A student who revises the model accurately has learned more than one who repeats a single sentence about rain and sunshine. Ask what information is actually supplied and what the learner inferred without evidence. The case is not a real dataset or local forecast.
The interpretive risk. An alarming forecast without response arrangements may cause confusion. Future generations may inherit more capable observing systems along with ongoing maintenance and data-preservation duties. A historical climate series loses usefulness if station changes and methods are not documented. Ask which records a future learner must understand to make a fair comparison. A civic service that retains its evidence and correction history becomes more adaptable. A reasonable alternative explanation should be considered before deciding that one measurement or agency action was wrong. Identify the scope of the question and relevant professional role.
Evidence and a falsifiable check. Identify the role of competent emergency and civic authorities rather than improvised tactics. Before drawing a conclusion, define whether the information is an observation, a forecast, a probability or a climate statistic. They describe different things. State the variable, location, time period and source. The student should also identify whether the report is official, historical or fictional. A number without its context can become a false claim even when the arithmetic displayed beside it is correct. Name one result that would challenge the current conclusion and another piece of information that would improve it. Make no real-world weather or emergency decisions from the imaginary numbers.
A safe parent-and-tutor lesson. Draw a high-level who-informs-whom chart without disaster action instructions. Prepare four cards: a measured condition, a predicted event, a possible communication problem and an evidence check. Shuffle them and ask the child to arrange a causal explanation. Change one assumption such as the valid forecast time and invite revision. This reveals whether the student understands observation and prediction rather than merely repeating weather vocabulary. Use paper maps and invented values, without generating genuine warnings or directing dangerous behaviour. A Secondary learner may add a calculation with units and a limitation.
Feedback and inheritance. Move the weather service into the next decade. Instruments, data volume, environmental conditions and user needs may change. Which principles of clear provenance, trustworthy forecasts and accessible warnings should remain? Which methods might need revision? A civilisation passes on the capability to interpret uncertainty, not merely a collection of old charts. Link this station to climate services for public planning, then state which information future learners need to understand how the model was corrected.
Component 29: Aviation meteorology
The specific meteorological concept. Aviation depends on specialised weather information and expert interpretation for flight operations. The physical atmosphere cannot be controlled by a council announcement. A civilisation instead develops the capability to observe, estimate possibilities and communicate relevant risks. That capacity has limits because conditions change and observations are incomplete. A strong explanation respects uncertainty without treating all forecasts as useless. The task is to describe what scientific knowledge can inform and what it cannot guarantee. Explain aviation meteorology as a defined observation, process or public service with identifiable inputs and an appropriate time or location.
Case from fictional Tidal Reach. A class tries to replace an aviation weather briefing with an ordinary phone forecast. Ask which resident would be missing from a digital-only warning programme. Someone without a connected device or accessible language may not receive the message in a useful form. Do not assume every member of an imagined category has identical needs. Instead, ask what alternate communication route would merit real testing and what observation would show successful understanding. Ask what information is actually supplied and what the learner inferred without evidence. The case is not a real dataset or local forecast.
The interpretive risk. Public weather apps are not equivalent to regulated aviation meteorological products. A new sensor or model may have a public benefit, but equipment and data collection also require funding, technical capability and maintenance. Ask what other useful task may be delayed when resources are assigned to one part of the chain. In the classroom, paper tokens can illustrate the opportunity cost, while actual decisions depend on professional budgets and public priorities. A reasonable alternative explanation should be considered before deciding that one measurement or agency action was wrong. Identify the scope of the question and relevant professional role.
Evidence and a falsifiable check. Identify the different institutional and professional needs without giving flight advice. End with the scope of the claim. A WMO 2025 report describes the status and definitions of its reference period, not current live conditions at the reader’s address. A climate scenario is not a guaranteed weather forecast, and Tidal Reach is imaginary. An accurate explanation makes these differences obvious to a younger reader. Name one result that would challenge the current conclusion and another piece of information that would improve it. Make no real-world weather or emergency decisions from the imaginary numbers.
A safe parent-and-tutor lesson. Draw a conceptual aviation-weather information route. Run a respectful debate between an imaginary farmer, school organiser and information specialist. Each may need a different forecast horizon or variable. Have pupils restate the strongest concern of another role before proposing an accessible communication product. The purpose is to clarify user needs and evidence, not to pretend that classroom participants are authorised emergency managers. Use paper maps and invented values, without generating genuine warnings or directing dangerous behaviour. A Secondary learner may add a calculation with units and a limitation.
Feedback and inheritance. Sometimes the next responsible step is obtaining better data or consulting a qualified meteorological agency, not improvising a warning. That is not an excuse to ignore a human need. State precisely what is unknown and where authoritative information can be found. A classroom exercise cannot substitute for local flood, aviation or medical expertise. Link this station to feedback, local knowledge and the next generation, then state which information future learners need to understand how the model was corrected.
Component 30: Farming and seasonal planning
The specific meteorological concept. Agricultural decisions can use weather forecasts and climate information alongside soil, crop and market knowledge. A forecast’s purpose depends on the decision a person faces. A farmer, teacher, airport professional or family may need different timescales, locations and formats. The same published number may be highly relevant for one question and inadequate for another. Ask which user is involved and what outcome they are trying to plan. This turns weather information from a collection of interesting measurements into a contextual public service. Explain farming and seasonal planning as a defined observation, process or public service with identifiable inputs and an appropriate time or location.
Case from fictional Tidal Reach. A fictional grower treats one seasonal outlook as a guarantee of harvest weather. Let one imagined resident use the forecast to plan a school activity while another relies on it for an agricultural or transport question. They may need different variables or timescales. The contrast does not prove one is a better reader. It reveals the need to define a user purpose and choose appropriate information. Both should know where authoritative guidance is obtained for real conditions. Ask what information is actually supplied and what the learner inferred without evidence. The case is not a real dataset or local forecast.
The interpretive risk. An uncertain projection cannot make all crop and livelihood decisions for a farmer. Forecast accuracy and public usefulness are different but connected questions. A model may make an appropriate probabilistic statement while a reader assumes it promises a particular outcome. Identify the gap between the scientific meaning and the public interpretation. The response may involve clearer communication as well as better data. It is important not to label every mismatch a failure of professional competence. A reasonable alternative explanation should be considered before deciding that one measurement or agency action was wrong. Identify the scope of the question and relevant professional role.
Evidence and a falsifiable check. Ask what forecast scope, local knowledge and professional advice would matter. Monitoring is useful when qualified people use the result to revise products and public communication. Who checks instrument performance, evaluates forecasts and receives user feedback? A dashboard that no one reviews is not a complete civic service. The learner should follow the evidence to an accountable correction and back to the people the information was intended to help. Name one result that would challenge the current conclusion and another piece of information that would improve it. Make no real-world weather or emergency decisions from the imaginary numbers.
A safe parent-and-tutor lesson. Make a hypothetical farming calendar with alternate scenarios. Invite a one-minute teach-back in which a student explains the difference between yesterday’s observation, tomorrow’s forecast and a multi-year climate pattern. A listener asks how the explanation changes when the station is moved or the time period extended. The speaker should revise the diagram and name the missing evidence. This is a strong test of understanding. Use paper maps and invented values, without generating genuine warnings or directing dangerous behaviour. A Secondary learner may add a calculation with units and a limitation.
Feedback and inheritance. Identify the observation that should trigger a review of the first communication approach. Perhaps a warning reaches some households late, a sensor repeatedly fails or an outdated forecast remains widely shared. Ask who can investigate and what feedback would demonstrate improvement. This creates an accountable process instead of a vague promise of more accurate forecasts. Link this station to weather and climate are different concepts, then state which information future learners need to understand how the model was corrected.
Integrated project 5: six links in an information service
Bring together Impact-based warnings; Official alerts and authoritative sources; Accessible warnings and multiple channels; Preparedness and legitimate response; Aviation meteorology; Farming and seasonal planning in one conceptual information chain. Use arrows labelled measures, checks, predicts, informs or enables review. Students should name at least two dependencies that cross professional or institutional roles. This is a safe classroom framework rather than a procedure for a real weather office.
Assign a source checker, a user-access reviewer, an uncertainty interpreter and a future-generation archivist. Each identifies a different possible weakness. The group should produce one qualified recommendation and the most credible objection, with a clear note about which real official source would be necessary before anyone acted on a weather concern.
For Primary learners, a five-box picture and two original sentences may be sufficient. Secondary pupils can write five paragraphs covering the mechanism, fictional case, uncertainty, evidence and correction. A tutor can mark accuracy of time and units, proper distinction between forecast and observation, and willingness to revise an unsupported claim.
Chapter 6: Long-term change, feedback and future knowledge
This chapter presents six related questions about the meaning, source, uncertainty and practical use of atmospheric information. A parent can select one station for a short dialogue, while a Secondary learner can compare several and examine their evidence. The teaching order is not a claim that every country follows one universal route to scientific capability.
Component 31: Water and river forecasting
The specific meteorological concept. Hydrology and weather information can be combined for water management and flood-related services. International weather cooperation can help people understand conditions that cross borders, but compatibility requires defined units, times, quality checks and trustworthy exchange. Students should draw the pathway from one observation to a shared forecast product. Where metadata are absent, the reported value may be hard to interpret. An effective explanation identifies what common language makes cooperation possible without claiming every country uses identical instruments. Explain water and river forecasting as a defined observation, process or public service with identifiable inputs and an appropriate time or location.
Case from fictional Tidal Reach. A river gauge rises in the model while the rainfall report is delayed. Introduce a second fictional source that uses a different time or unit. If students immediately compare the numbers, they may reach an erroneous conclusion. Ask them to reconcile the definitions and reference periods first. This illustrates why compatible records and metadata are essential when information crosses institutions and countries. Ask what information is actually supplied and what the learner inferred without evidence. The case is not a real dataset or local forecast.
The interpretive risk. Rainfall totals alone do not define local river impacts. International standards and global guidance aid consistency, but local user needs and hazards differ. Ask which terms, units and quality conditions should be shared and which forms of communication require contextual adaptation. The aim is not to copy one national system uncritically. It is to explain how useful information travels while keeping the actual decision’s location and authority visible. A reasonable alternative explanation should be considered before deciding that one measurement or agency action was wrong. Identify the scope of the question and relevant professional role.
Evidence and a falsifiable check. Identify the distinct meteorological and hydrological inputs. A rise in reports of extreme conditions may reflect changing hazards, observation coverage or classification. A falling incident count might reflect better protection or incomplete reporting. Ask which independent evidence would help distinguish these explanations. Good public science considers changes in methods and exposure, not only the shape of a graph. Name one result that would challenge the current conclusion and another piece of information that would improve it. Make no real-world weather or emergency decisions from the imaginary numbers.
A safe parent-and-tutor lesson. Draw an illustrative rain-to-river relationship with stated uncertainty. Design a plain-language weather-information card for a fictional person who missed an earlier update. It must state issue time, applicable place, source and uncertainty, and direct the reader to current competent services for any real advice. Test the wording with another pupil. No classroom message should be presented as a genuine public warning. Use paper maps and invented values, without generating genuine warnings or directing dangerous behaviour. A Secondary learner may add a calculation with units and a limitation.
Feedback and inheritance. Compare the original and revised diagrams. Name a corrected time window, a newly recognised data source and one user whose access had been overlooked. Another learner should be able to follow the improved reasoning independently. The opportunity to inspect and revise knowledge is a crucial capability of a civilisation facing changing conditions. Link this station to observing the atmosphere systematically, then state which information future learners need to understand how the model was corrected.
Component 32: Urban heat and local environments
The specific meteorological concept. Heat conditions can differ across surfaces and neighbourhoods, affecting public understanding of exposure. Weather science is a continuing capability. Instruments drift, networks expand, computer models improve and public communication needs can change. A service that worked once must still be maintained, assessed and updated as new evidence emerges. Ask what a future meteorologist would need to know about earlier observations and decisions. Preserving methods and their limitations is as important as preserving the raw numbers. Explain urban heat and local environments as a defined observation, process or public service with identifiable inputs and an appropriate time or location.
Case from fictional Tidal Reach. Two fictional school courtyards have different shade but the same city forecast. Pause the fictional weather case before a conclusion is drawn. What does the story report as an observation, what does it predict and what has the pupil inferred? An instrument reading describes a specific condition, while a future claim may rely on modelling and uncertainty. The learner should label those roles separately. The invented town provides no actual forecast for Singapore or any other location. Ask what information is actually supplied and what the learner inferred without evidence. The case is not a real dataset or local forecast.
The interpretive risk. One regional temperature figure cannot describe every local experience. The strongest objection to a proposed weather-information product may concern the wrong variable, time horizon or user group. Ask students to state that objection carefully before proposing an alternative. A forecast for a city may be useful and still be insufficient for a specialised marine or aviation decision. The goal is choosing relevant evidence, not demanding that one message solve every problem. A reasonable alternative explanation should be considered before deciding that one measurement or agency action was wrong. Identify the scope of the question and relevant professional role.
Evidence and a falsifiable check. Separate observation, local microclimate and qualified health guidance. Every rate needs the correct denominator. Ten predicted rainy days from fifty forecast periods is a different question from the amount of rain on those days. Even a properly calculated proportion may be misleading if ‘rain’ was not defined for the event and location. Ask students to name the exact forecast event before interpreting any percentage. Name one result that would challenge the current conclusion and another piece of information that would improve it. Make no real-world weather or emergency decisions from the imaginary numbers.
A safe parent-and-tutor lesson. Compare two imaginary site diagrams without making medical recommendations. Prepare four cards: a measured condition, a predicted event, a possible communication problem and an evidence check. Shuffle them and ask the child to arrange a causal explanation. Change one assumption such as the valid forecast time and invite revision. This reveals whether the student understands observation and prediction rather than merely repeating weather vocabulary. Use paper maps and invented values, without generating genuine warnings or directing dangerous behaviour. A Secondary learner may add a calculation with units and a limitation.
Feedback and inheritance. Move the weather service into the next decade. Instruments, data volume, environmental conditions and user needs may change. Which principles of clear provenance, trustworthy forecasts and accessible warnings should remain? Which methods might need revision? A civilisation passes on the capability to interpret uncertainty, not merely a collection of old charts. Link this station to air temperature, then state which information future learners need to understand how the model was corrected.
Component 33: Marine and coastal forecasts
The specific meteorological concept. Ocean and coastal activities require relevant professional weather and marine information. Some information appears more precise than its evidence justifies. A highly detailed map can contain uncertain estimates, and a long-range outlook can be useful without predicting the exact state of one street. Distinguish observed conditions, modelled expectations and public interpretation. The reader should be able to identify a credible reason for uncertainty rather than assuming every numerical figure is exact. Explain marine and coastal forecasts as a defined observation, process or public service with identifiable inputs and an appropriate time or location.
Case from fictional Tidal Reach. An island ferry operator studies changing weather while a general city bulletin reports sunshine. Have pupils mark where an observation ends and an inference begins. A cloud picture, radar colour or temperature value may support a claim, but what it establishes depends on its provenance, method and context. A teacher can ask for one plausible alternative interpretation and the evidence that would help distinguish them. This is a safe way to practise genuine uncertainty. Ask what information is actually supplied and what the learner inferred without evidence. The case is not a real dataset or local forecast.
The interpretive risk. A land-based summary may omit conditions relevant to maritime operations. The cost of a weak information system may be transferred to people who are absent from the planning process. A remote community or someone without digital access may receive an alert late, even when aggregate delivery statistics appear good. Ask which group’s experience the dashboard omits and how it could be studied respectfully. The possibility warrants checking, not an unsupported claim about every resident. A reasonable alternative explanation should be considered before deciding that one measurement or agency action was wrong. Identify the scope of the question and relevant professional role.
Evidence and a falsifiable check. Identify the need for authorised marine forecasts and local operating rules. Several observers may see different parts of one weather situation. A station records a quantitative variable, a resident reports a local effect and an agency evaluates regional hazards. None of these perspectives automatically captures everything. A responsible analysis considers the evidence’s type and scope without treating one anecdote as a national pattern or dismissing a legitimate local concern. Name one result that would challenge the current conclusion and another piece of information that would improve it. Make no real-world weather or emergency decisions from the imaginary numbers.
A safe parent-and-tutor lesson. Create a conceptual forecast-product comparison without navigation advice. Run a respectful debate between an imaginary farmer, school organiser and information specialist. Each may need a different forecast horizon or variable. Have pupils restate the strongest concern of another role before proposing an accessible communication product. The purpose is to clarify user needs and evidence, not to pretend that classroom participants are authorised emergency managers. Use paper maps and invented values, without generating genuine warnings or directing dangerous behaviour. A Secondary learner may add a calculation with units and a limitation.
Feedback and inheritance. Sometimes the next responsible step is obtaining better data or consulting a qualified meteorological agency, not improvising a warning. That is not an excuse to ignore a human need. State precisely what is unknown and where authoritative information can be found. A classroom exercise cannot substitute for local flood, aviation or medical expertise. Link this station to rainfall and accumulation, then state which information future learners need to understand how the model was corrected.
Component 34: Climate normals and historical records
The specific meteorological concept. Long-term climate descriptions depend on consistent datasets, defined periods and methods. An early-warning service has several stages beyond prediction. Understanding who is exposed, providing an appropriate alert, ensuring people receive it and connecting the information to legitimate response arrangements are separate functions. Ask which stage the imagined town has and which is missing. A sensor does not protect anybody merely by producing data. Protection depends on useful human and institutional links. Explain climate normals and historical records as a defined observation, process or public service with identifiable inputs and an appropriate time or location.
Case from fictional Tidal Reach. A pupil compares one recent hot day with an older thirty-year average. Retell the invented case to a younger pupil using a map, a date and a clear uncertainty statement. Another reader should be able to distinguish what was known when the message was issued from what happened later in the fictional story. This avoids hindsight bias. A later outcome should not be used to pretend that an earlier forecast had access to future observations. Ask what information is actually supplied and what the learner inferred without evidence. The case is not a real dataset or local forecast.
The interpretive risk. Individual weather events and climate statistics are different levels of evidence. An alert sent to a platform may not be received by everyone. Communications access, language, disability, power outages and trust can affect actual usefulness. Give two fictional residents different practical circumstances and trace their routes from warning source to understanding. Do not infer one person’s needs from a label. This keeps accessibility central without sacrificing factual care. A reasonable alternative explanation should be considered before deciding that one measurement or agency action was wrong. Identify the scope of the question and relevant professional role.
Evidence and a falsifiable check. Check reference periods, station records, changes in instruments and definitions. A classroom dataset cannot establish real flood safety, weather-warning categories or medical heat thresholds. Those depend on current authoritative services and professional expertise. Children may calculate hypothetical differences while recognising that real-world decisions need local conditions and legally competent organisations. Naming the boundary makes the educational analysis more accurate. Name one result that would challenge the current conclusion and another piece of information that would improve it. Make no real-world weather or emergency decisions from the imaginary numbers.
A safe parent-and-tutor lesson. Make a fictional comparison of a one-day reading and a multi-year mean. Invite a one-minute teach-back in which a student explains the difference between yesterday’s observation, tomorrow’s forecast and a multi-year climate pattern. A listener asks how the explanation changes when the station is moved or the time period extended. The speaker should revise the diagram and name the missing evidence. This is a strong test of understanding. Use paper maps and invented values, without generating genuine warnings or directing dangerous behaviour. A Secondary learner may add a calculation with units and a limitation.
Feedback and inheritance. Identify the observation that should trigger a review of the first communication approach. Perhaps a warning reaches some households late, a sensor repeatedly fails or an outdated forecast remains widely shared. Ask who can investigate and what feedback would demonstrate improvement. This creates an accountable process instead of a vague promise of more accurate forecasts. Link this station to wind observations, then state which information future learners need to understand how the model was corrected.
Component 35: Climate services for public planning
The specific meteorological concept. Climate services combine appropriate scientific information with user needs and practical planning contexts. Different geographical conditions can affect what a weather service needs. A coastal settlement, mountain community and dense city can have different exposures and forecasting questions, without one being inherently more capable or valuable. A responsible comparison identifies the human decision and local evidence. Students can transfer the principle of trustworthy information while avoiding assumptions about identical climate or infrastructure. Explain climate services for public planning as a defined observation, process or public service with identifiable inputs and an appropriate time or location.
Case from fictional Tidal Reach. The imagined council needs information for schools, roads and water supply over coming decades. Imagine that the forecaster is competent, but one station is offline or a message loses its date. The public result may still become misleading through a process failure rather than deliberate deception. Ask exactly where the observation or communication chain is incomplete. The class can propose a correction to the workflow without pretending to perform professional meteorology. Ask what information is actually supplied and what the learner inferred without evidence. The case is not a real dataset or local forecast.
The interpretive risk. A scientific dataset can be accurate but unhelpful when the decision maker’s question is not specified. An apparently detailed observation can still be unrepresentative. A sensor may sit in a location unlike the one the user cares about, or data from a short period may be interpreted as a long-term pattern. Ask whether the relevant time, place and measurement method match the claim. A stronger-looking number is not automatically more useful if it answers the wrong question. A reasonable alternative explanation should be considered before deciding that one measurement or agency action was wrong. Identify the scope of the question and relevant professional role.
Evidence and a falsifiable check. Define the planning horizon, user and relevant uncertainty. Before comparing two weather records, check station conditions, instrument definitions, observation periods and units. The meaning of a precipitation rate differs from accumulated rainfall, and a climate normal differs from a day’s measurement. A confident comparison built on mismatched categories is misleading. The class should state incompatibility explicitly rather than invent a conversion that does not apply. Name one result that would challenge the current conclusion and another piece of information that would improve it. Make no real-world weather or emergency decisions from the imaginary numbers.
A safe parent-and-tutor lesson. Draft a fictional climate-information request using the WMO GFCS framework. Design a plain-language weather-information card for a fictional person who missed an earlier update. It must state issue time, applicable place, source and uncertainty, and direct the reader to current competent services for any real advice. Test the wording with another pupil. No classroom message should be presented as a genuine public warning. Use paper maps and invented values, without generating genuine warnings or directing dangerous behaviour. A Secondary learner may add a calculation with units and a limitation.
Feedback and inheritance. Compare the original and revised diagrams. Name a corrected time window, a newly recognised data source and one user whose access had been overlooked. Another learner should be able to follow the improved reasoning independently. The opportunity to inspect and revise knowledge is a crucial capability of a civilisation facing changing conditions. Link this station to humidity and moisture in air, then state which information future learners need to understand how the model was corrected.
Component 36: Feedback, local knowledge and the next generation
The specific meteorological concept. Useful services improve when observations, forecasts and warnings are evaluated and understood by future users. The most sophisticated scientific method is not useful when a member of the public cannot understand its essential message. A report may require plain wording, accurate uncertainty, a correct issue time and suitable communication routes. The learner should identify how information travels from expert analysis to a person who needs it. That final human step makes communication and accessibility part of meteorological capability. Explain feedback, local knowledge and the next generation as a defined observation, process or public service with identifiable inputs and an appropriate time or location.
Case from fictional Tidal Reach. The town preserves forecast charts but loses the dates, methods and records of warning reception. A community may receive a scientifically sound message yet be unsure which public authority is responsible for the next stage. The model should distinguish forecast provider, warning issuer and response organisation rather than merge them into one imagined expert. A child can identify those institutional roles without being asked to carry out real emergency actions. Ask what information is actually supplied and what the learner inferred without evidence. The case is not a real dataset or local forecast.
The interpretive risk. A beautifully archived chart without provenance can mislead future readers. Two apparently different information products may share one flawed source. A warning application and a news broadcast could rely on the same outdated official message. Draw the chain of provenance before calling the reports independent confirmation. Recognising a common source helps students interpret apparent agreement and understand why timely corrections matter. A reasonable alternative explanation should be considered before deciding that one measurement or agency action was wrong. Identify the scope of the question and relevant professional role.
Evidence and a falsifiable check. Check source, outcomes, inclusiveness and a transparent correction history. An apparent relationship between weather and another outcome may have alternative causes. Crop yields, energy demand or school attendance are also influenced by economic and social conditions. Ask the learner to list at least one plausible confounder and explain what additional evidence would help separate it. Correlation is not automatically proof of a single meteorological cause. Name one result that would challenge the current conclusion and another piece of information that would improve it. Make no real-world weather or emergency decisions from the imaginary numbers.
A safe parent-and-tutor lesson. Write a successor’s guide explaining which observations and decisions were linked. Prepare four cards: a measured condition, a predicted event, a possible communication problem and an evidence check. Shuffle them and ask the child to arrange a causal explanation. Change one assumption such as the valid forecast time and invite revision. This reveals whether the student understands observation and prediction rather than merely repeating weather vocabulary. Use paper maps and invented values, without generating genuine warnings or directing dangerous behaviour. A Secondary learner may add a calculation with units and a limitation.
Feedback and inheritance. Move the weather service into the next decade. Instruments, data volume, environmental conditions and user needs may change. Which principles of clear provenance, trustworthy forecasts and accessible warnings should remain? Which methods might need revision? A civilisation passes on the capability to interpret uncertainty, not merely a collection of old charts. Link this station to air pressure and changing patterns, then state which information future learners need to understand how the model was corrected.
Integrated project 6: six links in an information service
Bring together Water and river forecasting; Urban heat and local environments; Marine and coastal forecasts; Climate normals and historical records; Climate services for public planning; Feedback, local knowledge and the next generation in one conceptual information chain. Use arrows labelled measures, checks, predicts, informs or enables review. Students should name at least two dependencies that cross professional or institutional roles. This is a safe classroom framework rather than a procedure for a real weather office.
Assign a source checker, a user-access reviewer, an uncertainty interpreter and a future-generation archivist. Each identifies a different possible weakness. The group should produce one qualified recommendation and the most credible objection, with a clear note about which real official source would be necessary before anyone acted on a weather concern.
For Primary learners, a five-box picture and two original sentences may be sufficient. Secondary pupils can write five paragraphs covering the mechanism, fictional case, uncertainty, evidence and correction. A tutor can mark accuracy of time and units, proper distinction between forecast and observation, and willingness to revise an unsupported claim.
Eight transfers from weather data into civic systems
Transfer 1: One station and a regional forecast
Ask how local observations contribute to, but do not replace, larger analysis. Start by stating what the user is trying to decide and which atmospheric information could inform it. The changed setting may make a different observation or professional source necessary. A school exercise can reveal the dependency but cannot determine what real weather conditions will be at a particular location.
A younger pupil may draw two labelled scenarios, while a Secondary student can write a claim, cause, counterexample and conditional conclusion. An advanced reader can consult WMO’s published guidance and explain what is and is not directly supported. The learning goal is a transferable method for interpreting uncertainty, not a prediction that one imagined future must occur.
Transfer 2: A single wet day and a climate record
Distinguish an event from a long-period statistical pattern. Start by stating what the user is trying to decide and which atmospheric information could inform it. The changed setting may make a different observation or professional source necessary. A school exercise can reveal the dependency but cannot determine what real weather conditions will be at a particular location.
A younger pupil may draw two labelled scenarios, while a Secondary student can write a claim, cause, counterexample and conditional conclusion. An advanced reader can consult WMO’s published guidance and explain what is and is not directly supported. The learning goal is a transferable method for interpreting uncertainty, not a prediction that one imagined future must occur.
Transfer 3: A precise forecast number and an uncertain future
Identify which conditions and probabilities shape the claim. Start by stating what the user is trying to decide and which atmospheric information could inform it. The changed setting may make a different observation or professional source necessary. A school exercise can reveal the dependency but cannot determine what real weather conditions will be at a particular location.
A younger pupil may draw two labelled scenarios, while a Secondary student can write a claim, cause, counterexample and conditional conclusion. An advanced reader can consult WMO’s published guidance and explain what is and is not directly supported. The learning goal is a transferable method for interpreting uncertainty, not a prediction that one imagined future must occur.
Transfer 4: A weather forecast and an official warning
Separate predicted conditions from authorised impact communication and preparedness. Start by stating what the user is trying to decide and which atmospheric information could inform it. The changed setting may make a different observation or professional source necessary. A school exercise can reveal the dependency but cannot determine what real weather conditions will be at a particular location.
A younger pupil may draw two labelled scenarios, while a Secondary student can write a claim, cause, counterexample and conditional conclusion. An advanced reader can consult WMO’s published guidance and explain what is and is not directly supported. The learning goal is a transferable method for interpreting uncertainty, not a prediction that one imagined future must occur.
Transfer 5: A public app and a remote household
Check whether information was received and understood through appropriate channels. Start by stating what the user is trying to decide and which atmospheric information could inform it. The changed setting may make a different observation or professional source necessary. A school exercise can reveal the dependency but cannot determine what real weather conditions will be at a particular location.
A younger pupil may draw two labelled scenarios, while a Secondary student can write a claim, cause, counterexample and conditional conclusion. An advanced reader can consult WMO’s published guidance and explain what is and is not directly supported. The learning goal is a transferable method for interpreting uncertainty, not a prediction that one imagined future must occur.
Transfer 6: School schedules and agricultural decisions
Different users may need different variables, time horizons and professional guidance. Start by stating what the user is trying to decide and which atmospheric information could inform it. The changed setting may make a different observation or professional source necessary. A school exercise can reveal the dependency but cannot determine what real weather conditions will be at a particular location.
A younger pupil may draw two labelled scenarios, while a Secondary student can write a claim, cause, counterexample and conditional conclusion. An advanced reader can consult WMO’s published guidance and explain what is and is not directly supported. The learning goal is a transferable method for interpreting uncertainty, not a prediction that one imagined future must occur.
Transfer 7: Present-day sensors and a historical climate series
Document site, method, time and correction before drawing a long-term trend. Start by stating what the user is trying to decide and which atmospheric information could inform it. The changed setting may make a different observation or professional source necessary. A school exercise can reveal the dependency but cannot determine what real weather conditions will be at a particular location.
A younger pupil may draw two labelled scenarios, while a Secondary student can write a claim, cause, counterexample and conditional conclusion. An advanced reader can consult WMO’s published guidance and explain what is and is not directly supported. The learning goal is a transferable method for interpreting uncertainty, not a prediction that one imagined future must occur.
Transfer 8: A global early-warning goal and current coverage
Distinguish international ambitions, dated reports and actual local service readiness. Start by stating what the user is trying to decide and which atmospheric information could inform it. The changed setting may make a different observation or professional source necessary. A school exercise can reveal the dependency but cannot determine what real weather conditions will be at a particular location.
A younger pupil may draw two labelled scenarios, while a Secondary student can write a claim, cause, counterexample and conditional conclusion. An advanced reader can consult WMO’s published guidance and explain what is and is not directly supported. The learning goal is a transferable method for interpreting uncertainty, not a prediction that one imagined future must occur.
Six lesson plans for children, parents and tutors
Lesson 1: Observe or predict?
Sort invented statements into past observation, current observation, forecast and climate statistic. Ask the child for an initial answer and select only the corresponding station. Next introduce a realistic alternative explanation or missing piece of information. The final response should make clear what is observed, what is inferred and what requires authoritative professional advice.
Primary learners can use pictures and short spoken sentences. Secondary learners can add labelled hypothetical data, a counterexample and a conditional conclusion. Parents and tutors should not treat the child’s calculation as an actual weather forecast, and no exercise requires collecting sensitive personal information.
Lesson 2: The right unit and time
Compare fictional rain accumulation totals with different durations and explain why they are not identical. Ask the child for an initial answer and select only the corresponding station. Next introduce a realistic alternative explanation or missing piece of information. The final response should make clear what is observed, what is inferred and what requires authoritative professional advice.
Primary learners can use pictures and short spoken sentences. Secondary learners can add labelled hypothetical data, a counterexample and a conditional conclusion. Parents and tutors should not treat the child’s calculation as an actual weather forecast, and no exercise requires collecting sensitive personal information.
Lesson 3: A forecast chain
Trace observations through quality control, professional forecasting and public communication. Ask the child for an initial answer and select only the corresponding station. Next introduce a realistic alternative explanation or missing piece of information. The final response should make clear what is observed, what is inferred and what requires authoritative professional advice.
Primary learners can use pictures and short spoken sentences. Secondary learners can add labelled hypothetical data, a counterexample and a conditional conclusion. Parents and tutors should not treat the child’s calculation as an actual weather forecast, and no exercise requires collecting sensitive personal information.
Lesson 4: An honest uncertain claim
Rewrite a confident but unsupported fictional prediction with a defined event and limitation. Ask the child for an initial answer and select only the corresponding station. Next introduce a realistic alternative explanation or missing piece of information. The final response should make clear what is observed, what is inferred and what requires authoritative professional advice.
Primary learners can use pictures and short spoken sentences. Secondary learners can add labelled hypothetical data, a counterexample and a conditional conclusion. Parents and tutors should not treat the child’s calculation as an actual weather forecast, and no exercise requires collecting sensitive personal information.
Lesson 5: Accessible warnings
Compare several imaginary recipients and identify what information channel could be missing. Ask the child for an initial answer and select only the corresponding station. Next introduce a realistic alternative explanation or missing piece of information. The final response should make clear what is observed, what is inferred and what requires authoritative professional advice.
Primary learners can use pictures and short spoken sentences. Secondary learners can add labelled hypothetical data, a counterexample and a conditional conclusion. Parents and tutors should not treat the child’s calculation as an actual weather forecast, and no exercise requires collecting sensitive personal information.
Lesson 6: Teach-back and revision
Explain weather versus climate to another child, then revise the answer after a changed condition. Ask the child for an initial answer and select only the corresponding station. Next introduce a realistic alternative explanation or missing piece of information. The final response should make clear what is observed, what is inferred and what requires authoritative professional advice.
Primary learners can use pictures and short spoken sentences. Secondary learners can add labelled hypothetical data, a counterexample and a conditional conclusion. Parents and tutors should not treat the child’s calculation as an actual weather forecast, and no exercise requires collecting sensitive personal information.
Frequently asked questions
FAQ 1: Is one rainy day evidence that the climate has changed?
No. Weather events and long-term climate statistics require different time and data definitions. Apply the principle to one fictional station and identify what would need to be checked against the relevant source. A mature answer states the time and place of the claim, the limitation of the evidence and the appropriate institutional role.
FAQ 2: Can a thermometer reading describe an entire town?
Not necessarily. Location, siting, time and observation quality matter. Apply the principle to one fictional station and identify what would need to be checked against the relevant source. A mature answer states the time and place of the claim, the limitation of the evidence and the appropriate institutional role.
FAQ 3: Are satellite and radar pictures direct measures of every surface variable?
No. Their information and estimates need proper interpretation and supporting evidence. Apply the principle to one fictional station and identify what would need to be checked against the relevant source. A mature answer states the time and place of the claim, the limitation of the evidence and the appropriate institutional role.
FAQ 4: What is a weather forecast?
A scientifically generated estimate of future conditions under stated methods and uncertainty. Apply the principle to one fictional station and identify what would need to be checked against the relevant source. A mature answer states the time and place of the claim, the limitation of the evidence and the appropriate institutional role.
FAQ 5: Why may forecasts differ?
Observations, model structure and uncertainty can produce different plausible estimates. Apply the principle to one fictional station and identify what would need to be checked against the relevant source. A mature answer states the time and place of the claim, the limitation of the evidence and the appropriate institutional role.
FAQ 6: Does a 30% probability mean rain for 30% of the day?
Not automatically. The forecast event and time period must be defined. Apply the principle to one fictional station and identify what would need to be checked against the relevant source. A mature answer states the time and place of the claim, the limitation of the evidence and the appropriate institutional role.
FAQ 7: Is a warning the same thing as a forecast?
No. Official warning services have their own purpose, communication and institutional responsibilities. Apply the principle to one fictional station and identify what would need to be checked against the relevant source. A mature answer states the time and place of the claim, the limitation of the evidence and the appropriate institutional role.
FAQ 8: Does a country having an early warning system mean every person is protected?
No. Coverage, accessibility, readiness and practical effectiveness are distinct measures. Apply the principle to one fictional station and identify what would need to be checked against the relevant source. A mature answer states the time and place of the claim, the limitation of the evidence and the appropriate institutional role.
FAQ 9: What is a climate service?
Science-based climate information developed with user needs to inform planning and decisions. Apply the principle to one fictional station and identify what would need to be checked against the relevant source. A mature answer states the time and place of the claim, the limitation of the evidence and the appropriate institutional role.
FAQ 10: Can a child issue an official warning based on this guide?
No. Real warnings and protective guidance come from competent authorities. Apply the principle to one fictional station and identify what would need to be checked against the relevant source. A mature answer states the time and place of the claim, the limitation of the evidence and the appropriate institutional role.
FAQ 11: Why is weather information important to aviation and shipping?
Those activities use specialised professional forecast products and operating responsibilities. Apply the principle to one fictional station and identify what would need to be checked against the relevant source. A mature answer states the time and place of the claim, the limitation of the evidence and the appropriate institutional role.
FAQ 12: What should future learners preserve?
Reliable observations, methods, definitions, forecast evaluations and responsible ways to communicate uncertainty. Apply the principle to one fictional station and identify what would need to be checked against the relevant source. A mature answer states the time and place of the claim, the limitation of the evidence and the appropriate institutional role.
Official sources and evidence boundaries
WMO and UN sources describe international observation systems, climate services and dated early-warning coverage. They do not measure Tidal Reach or supply real-time safety advice for the reader. Public action in actual hazardous conditions must follow current official local guidance and qualified emergency and technical authorities.
- World Meteorological Organization, Global Framework for Climate Services (GFCS).
- WMO, updated Statements of Guidance for global observing systems (26 May 2026).
- WMO, Global Status of Multi-Hazard Early Warning Systems 2025 (12 November 2025).
- United Nations, Early Warnings for All initiative.
Companion chapters in the civilisation library
- Ecology, Waste, Resources and Environmental Renewal.
- Maintenance, Disaster Readiness, Resilience and Repair.
- Timekeeping, Measurement, Standards and Interoperability.
- Strategic Planning, Foresight and Future Generations.
- Airports, Air Navigation and Aviation Safety.
- Water Supply, Sanitation and Public Health.
- Media, Journalism, Public Information and Trust.
- Connected Systems: How to Build a Civilisation.
Conclusion: uncertainty becomes useful when a civilisation understands it
The weather-and-climate-services component of civilisation joins observation networks, standardised data, scientific forecasting, uncertainty communication, climate information, early warning services and trusted public institutions. A forecast is not an order, an isolated weather reading is not a climate trend, and a warning system succeeds only when relevant people can receive, understand and appropriately respond through authorised arrangements. Weather cannot be commanded to become convenient, and a forecast cannot abolish uncertainty. But people can build institutions that collect better evidence, communicate it clearly, protect sources and make it more useful for legitimate decisions.
Draw one final Tidal Reach map linking an observing station, a meteorological service, a school, a ferry operator and an older resident. Mark which information each person needs and where a missing unit, outdated message or inaccessible channel could mislead them. Then record a correction and the real official source that would matter in practice. That is the beginning of a durable scientific civilisation.