
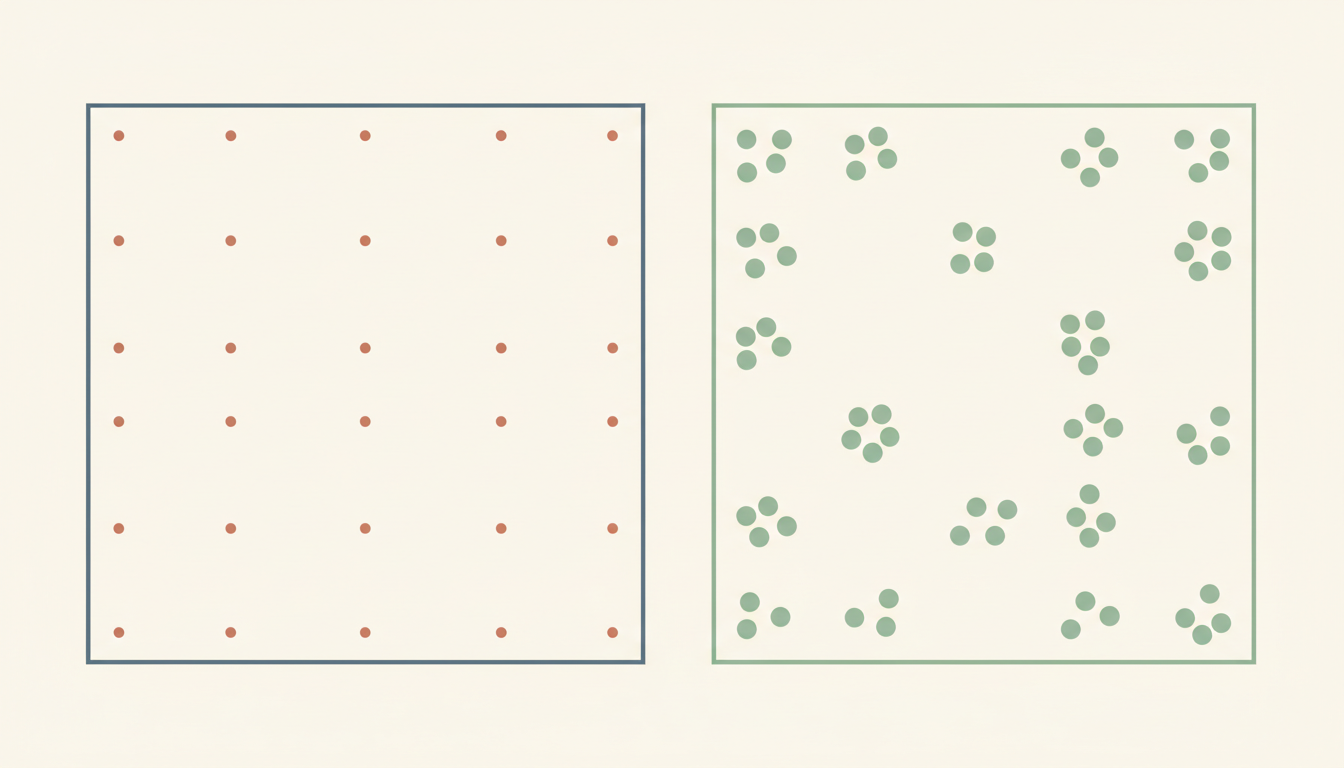
Did you know? Two neighbourhoods can have the same average household income and feel economically very different. In one, earnings might cluster around the average. In another, a few extremely high incomes may lift the average while many households earn substantially less.
Neither arithmetic result has to be wrong. The mistake appears when a single summary is treated as a full description of the distribution. That is one way statistics misleads.
Quick answer: statistics can mislead when averages hide variation, totals are compared without a suitable denominator, differently composed groups are treated as equivalent, uncertainty is omitted or a correlation is presented as a cause. Repair begins by asking what was measured, who is included, which summary suits the question and what changes when the data are broken down.
The average is a tool, not the whole population
The mean adds all values and divides by their number. The median is the central value after ordering the observations, or the average of the two central values for an even number of observations. Both are useful, but they answer different questions.
Consider a fictional five-person group with monthly incomes of $2,000, $2,200, $2,400, $2,600 and $10,800. The mean is $4,000; the median is $2,400. Only one person earns close to the high end, yet the mean is far above what four of the five individuals receive.
These are invented figures for illustration, not claims about Singapore incomes. The point is that a few high values can pull the mean upward. The median may describe a typical person’s position more appropriately for some skewed distributions.
The UK Office for National Statistics guidance on interpreting earnings explains why it prioritises the median for earnings comparisons: the distribution is skewed and unusually high values can exert a large effect on the mean.
Six ways a truthful statistic can give a false impression
- Wrong summary: the mean is used as though it represents a typical person in a highly skewed population.
- Missing denominator: raw totals are compared across populations of dramatically different sizes.
- Hidden subgroup composition: an overall trend conceals different patterns within relevant categories.
- Selective time window: the starting or ending year is chosen to make a change appear much larger or smaller.
- Ignored uncertainty: small samples, measurement error or imprecise estimates are presented as exact facts.
- Correlation treated as causation: two variables change together, and the report asserts that one caused the other without sufficient evidence.
A statistic can have one of these weaknesses without being fabricated. It can also be distorted intentionally by selective presentation. Readers should inspect the source and methods before deciding which problem occurred.
Averages hide the shape of the data
Hypothetical example. Group A has test scores of 60, 60, 60, 60 and 60. Group B has scores of 20, 40, 60, 80 and 100. Both have a mean of 60.
If the school’s only question is the average mark, the groups look identical. If the question is which learners need additional support, the groups are clearly different.
The range, distribution and individual results reveal information the mean cannot. That does not make the mean bad; it shows why a useful analysis asks a question before selecting the summary.
The same issue appears in service performance. Two clinics can have the same average waiting time while one delivers consistent waits and another combines immediate service for some users with very long delays for others.
The denominator changes the interpretation
Suppose Town A reports 200 service complaints among 20,000 residents. Town B reports 100 complaints among 2,000 residents. The first town has more complaints by count; the second has a higher number per resident.
Town A has ten complaints per 1,000 residents, while Town B has fifty per 1,000. Both statements about totals and rates can be mathematically correct.
But even the rate might need explanation. Do all residents use the service equally? Does one town have more visitors? Does reporting depend on digital access? The appropriate denominator follows the purpose of the comparison.
Our How Maps Mislead | When Scale, Projections and Context Are Lost guide applies this distinction to choropleth maps, where darker colours can hide the difference between counts and comparable rates.
When the overall result hides the subgroup result
An especially surprising statistical effect occurs when an overall comparison differs from the comparisons inside relevant subgroups. This is often called Simpson’s paradox. It can happen because the groups contain different proportions of people facing different starting conditions.
Illustrative example. Two schools run a programme for learners with varied prior achievement. One school serves many students needing intensive support; the other serves more students with high prior attainment. Overall pass rates may differ even when a relevant programme performs well within comparable starting-level groups.
The conclusion is not that everyone should split data into dozens of tiny categories. Small subgroup estimates can be unstable and risk revealing sensitive information. The point is that composition matters and that aggregated figures should be interpreted with a credible understanding of the groups being compared.
Ask whether the comparison should be adjusted, stratified or accompanied by an explanation of how participants were selected. A causal conclusion needs a sound study design, not just more tables.
The difference between median growth and growth in the median
Here is a less obvious puzzle. If a report says that median earnings rose, does that mean the median person’s earnings rose by that amount? Not necessarily. The group of people included in the observations may have changed, and changes in the median distribution are not identical to the median of individual changes.
The ONS ASHE guidance explicitly distinguishes the growth in median earnings over time from the median of the earnings-growth figures for individual workers.
This difference illustrates a broader rule: even a familiar statistic can mean something different from the everyday interpretation people attach to it. Definitions should travel with the number.
A statistical chart can be truthful and unhelpful
A chart starting its vertical axis well above zero can accentuate a small change. That may be appropriate for examining tiny variations, or misleading if it creates the impression of a much larger effect without showing the scale.
Percentages can have the opposite problem. An increase from one event to two is a 100% increase, but the absolute difference remains one event. If the event count is tiny, the percentage may be unstable.
Readers should inspect the axis, units, source, time window and whether the chart uses counts, rates, logarithms or different scales across panels. A graph can be mathematically faithful while ill-suited to the question.
Why uncertainty must accompany strong claims
Survey estimates are based on methods, response patterns and samples. Reporting a result to several decimal places does not remove sampling uncertainty, selection bias or measurement problems.
Likewise, an average from a small classroom survey cannot automatically describe every child in Singapore. Some questions require a broader representative design.
The UK’s Office for Statistics Regulation guidance published on 9 October 2026 encourages analysts to explain methods, definitions, quality and uncertainty so that findings are not presented or repeated out of context.
When uncertainty is material, use appropriate ranges, caveats and clear language rather than pretending the number reveals more than the method can establish.
Cherry-picked time windows and missing baselines
Imagine a company reports that complaints fell 50% between two particular months. That may be true. But what if complaints had climbed sharply just before the chosen starting month? What if customer numbers also changed?
A fair interpretation checks a relevant baseline, seasonal effects, method changes and what counts as a complaint. The selected period can help explain a recent intervention; it should not be treated as the only meaningful history.
The Code of Practice guidance for the public use of statistics warns against cherry-picking, omitting relevant context and presenting undue certainty. These are not merely mathematical mistakes; they are problems of responsible communication.
A comparison can fail when the definitions changed
One year’s service records may count a case as closed when a letter is sent; another year’s figures may count it only after the underlying issue has been resolved. Comparing ‘closure rates’ without acknowledging the rule change would be misleading.
The same risk appears in educational datasets. If the assessment format, marking rules or student population changed, a difference in aggregate scores may not measure only a change in learning.
Read How Data Systems Fail | When Definitions and Records Drift Apart for why consistent units and traceable collection rules are necessary before the numbers are compared.
A classroom exercise: invent two groups with the same average
Ask students to construct two five-number datasets that both have a mean of 50. One should cluster near 50; the other should contain much greater variation. Plot both sets as dot plots.
Now ask what the average tells us accurately and what it hides. Add a question about who might need extra support, and the students will discover why the same summary does not imply the same educational action.
A second exercise uses a fictional service table with counts and population denominators. Ask students to compare the raw total with the rate and to explain why the result changed.
This builds mathematical reasoning rather than encouraging students to memorise slogans like ‘averages lie.’ The average did not lie. The interpretation was incomplete.
Seven questions to ask before sharing a statistic
- Population: Who or what was actually counted or measured?
- Definition: What does the number mean, and did that definition remain consistent?
- Summary: Is the mean, median, rate, count or another measure appropriate for the question?
- Variation: What distribution, subgroups or extremes may be hidden behind the headline?
- Context: What baseline, denominator, time period and external conditions affect the comparison?
- Uncertainty: How much confidence does the study design and data quality justify?
- Claim: Does the headline merely describe an association, or does it assert a cause that the evidence has not established?
If one answer is missing, do not automatically discard the entire study. Instead, avoid drawing a stronger conclusion than the available information allows.
Frequently asked questions
Is the mean always misleading?
No. It is useful for many questions, especially when the arithmetic total matters. But a highly skewed distribution may make the median or a fuller set of summaries more informative.
Why can two groups have the same average but different needs?
An average does not show how values are distributed. The range, variation, subgroups and individual observations can reveal important differences.
Is a rate always better than a raw count?
No. Both can be appropriate. Counts help assess total workload; rates may help compare differently sized populations. The right denominator and question must be defined.
Can a valid percentage be deceptive?
Yes. A small base, missing time window or poorly chosen comparison can give an exaggerated impression. Show the numerator, denominator and relevant context.
Does correlation prove causation?
No. Correlation is evidence of association. A causal claim needs an appropriate study design and evaluation of alternative explanations.
The final idea
Statistics misleads when one true number is allowed to stand in for an entire reality it cannot describe. Good analysis preserves definitions, appropriate comparisons, variation, uncertainty and the limits of causal interpretation. Ask what the number leaves out before deciding what it proves.
Explore other guides about systems that fail
- How Translation Fails | When Context, Tone and Meaning Are Lost
- How Statistics Misleads | When Averages Hide Different Realities — current guide
- How Customer Service Breaks | When Tickets Replace Resolutions
- How Telecommunications Fail | When Coverage, Capacity and Recovery Break
For further connections see How English Learning Stalls, How Data Systems Fail and the unchanged Secondary 1 Mathematics Tutor Clementi | Small Groups Tutorials page, a practical example of checking whether explanations lead to independent understanding.
Sources and further reading
- UK Office for National Statistics: Guide to Interpreting Earnings Estimates
- Office for Statistics Regulation (9 October 2026): Misuse and Misinterpretation Guidance
- Office for Statistics Regulation: Standards for Public Use of Statistics
- eduKateSG: The Gold Standard of Statistics
- eduKateSG: How Maps Mislead
Hypothetical scenarios are used for teaching. Interpret the guidance in the appropriate linguistic, statistical, business and regulatory context rather than treating it as an assessment of an identifiable organisation.