
Does haze reduce Malaysia’s solar electricity? A study measured it
Yes, haze can reduce the solar energy reaching photovoltaic panels and lower their electricity output. A Malaysia-specific peer-reviewed study investigated transboundary smoke over Kuala Lumpur in September–October 2015 and reported a 17.8% reduction in PV electricity generation under the studied conditions. That result, published in IET Renewable Power Generation in 2017, is real historical evidence—not a guarantee of a 17.8% loss for every Malaysian panel, every haze episode or 2026.
The study, Assessment of effect of haze on photovoltaic systems in Malaysia due to open burning in Sumatra, measured irradiance, panel temperature and output under selected comparison conditions in Kuala Lumpur. It found average recorded energy in one comparison of 1,279.8 Wh under normal conditions versus 1,052.2 Wh in the hazy period. The difference is 227.6 Wh, or approximately 17.8% of the baseline.
Why does this happen? Smoke aerosols scatter and absorb sunlight. Solar panels may still generate electricity under haze, but the amount and spectrum of light arriving at the modules change. Cloud cover, temperature and panel technology also affect output; careful analysis must distinguish haze from these other variables.
The Malaysia solar-and-haze answer in one minute
- Haze changes sunlight. Smoke aerosols scatter and absorb incoming solar radiation.
- Less sunlight can mean less PV output. Electricity from a panel depends strongly on irradiance under otherwise comparable conditions.
- A Malaysia-specific study exists. Kuala Lumpur measurements during the 2015 haze led to an estimated 17.8% reduction in the studied PV output.
- Not every solar system loses the same percentage. Clouds, temperature, panel type, orientation, shading and the period studied affect results.
- Malaysia API is not a solar-energy meter. API is an air-quality index; PV output uses power and energy units.
- Performance data matter. Compare kWh and irradiation for matched conditions, not two random days.
- Solar adoption still makes sense to evaluate. Occasional smoke-related losses are one input to financial and engineering analysis, not proof that solar stops working.
- Regional fires affect multiple systems. Peatland prevention and cleaner air protect health and can help reduce avoidable solar-generation disturbances.
What photovoltaic panels actually do
A photovoltaic cell converts some incoming sunlight directly into electrical energy through a semiconductor device. Groups of cells form modules, which connect to inverters and electrical systems. The amount of generated power depends on incoming light, module temperature, the design of the system and operational conditions.
A common misconception is that a solar panel needs an intensely sunny, cloud-free sky to make any electricity. Many panels still generate power under overcast or hazy conditions, though often at a reduced level. The key question is how much useful irradiance reaches the cells over the relevant period.
Malaysia’s Sustainable Energy Development Authority (SEDA) provides information about rooftop PV and net-energy-metering arrangements. The specific programme rules and quotas can change, so readers should verify current eligibility rather than relying on older incentive examples.
What haze particles do to incoming sunlight
Sunlight travelling through the atmosphere encounters molecules, droplets and suspended aerosols. Biomass-burning smoke contains a mixture of particle types. Some scatter light away from the direct beam; darker absorbing particles such as black carbon take up energy and may heat the air containing them.
The light reaching a roof can therefore have less direct irradiance and a different mix of wavelengths. A hazy sky may look white, grey or orange depending on lighting and aerosol properties, but appearance alone does not provide a precise solar power estimate.
NASA’s Aerosols: Tiny Particles, Big Impact explains scattering and absorption. The companion Malaysia haze weather article explores why the same particles also influence cloud and radiation processes.
Direct versus diffuse irradiance on a roof
Direct solar irradiance comes along the sun’s apparent path. Diffuse light arrives from many directions after scattering. A haze plume may reduce the direct component while altering the diffuse portion. A PV module responds to both, but the impact depends on how it is oriented and how the panel technology uses the arriving spectrum.
This is one reason the energy impact cannot be inferred merely from a visibility photograph. Two haze conditions can look similarly grey but contain different aerosol properties, cloud layers and sunlight distributions.
Solar engineers may measure global horizontal irradiance, diffuse horizontal irradiance and the plane-of-array irradiance received by an installed module. These terms describe different views of incoming energy.

The 2015 Kuala Lumpur experiment in simple language
The researchers measured conditions at a University of Malaya facility in Kuala Lumpur and compared selected hazy and normal periods. Their analysis considered solar irradiance, solar panel temperature, PM10, humidity and power generation. They used statistical techniques to examine the relationship between conditions and PV output.
The published 2017 paper reports the selected electricity yield comparison of 1,279.8 Wh versus 1,052.2 Wh, a reduction of 17.8%. It also reports that peak irradiance differed under the compared conditions.
Importantly, the study did not conclude that every rooftop in Sabah, Sarawak, Selangor or Johor always suffers the same proportional loss. Its findings concern the measured location and episode, and are best used to establish the physical and engineering significance of regional smoke.
Worked maths: verify the reported 17.8% finding
Use the study’s reported energy values for a simple calculation. Baseline energy 1,279.8 Wh minus hazy-period energy 1,052.2 Wh equals 227.6 Wh. Divide the reduction by the baseline: 227.6 ÷ 1,279.8 = approximately 0.1778. Convert to a percentage: 17.8%.
This arithmetic is valid for that comparison. It cannot tell us the exact loss at your rooftop on 17 October 2026. Different panel technologies and weather conditions matter, as do system size, inverter operation and the baseline chosen.
The unit is also important: watt-hours measure energy over a period. Watts measure instantaneous power. You should not report a watt-hour reduction as though it is a continuous reduction in watts without the corresponding time information.
Why a 2013 Singapore study is useful but not a Malaysian forecast
A separate study of the 2013 transboundary haze and Singapore PV systems estimated yield losses in the 15–25% range for ten PV systems studied during that episode. The researchers used selected conditions to separate haze attenuation from cloud effects.
This reinforces that tropical Southeast Asian smoke can measurably affect solar generation. But Singapore in June 2013 and Kuala Lumpur in 2015 had different conditions and systems. The results cannot be averaged into a guaranteed annual Malaysian loss percentage.
Scientific references are strongest when each keeps its own date, scope, comparison period and method.
Solar irradiance is not the same quantity as Malaysia API
Malaysia publishes its Air Pollutant Index, also known as API or IPU, to communicate outdoor pollution levels. A solar power system measures electricity output, often in watts or kilowatt-hours. An irradiance sensor measures light energy arriving per unit area, for example watts per square metre.
An API of 150 does not mean the PV system will lose 15%, 150 watts or 150 kilowatt-hours. The index is constructed using pollutant observations and cannot be linearly converted into solar yield by relabelling the number.
For the official air-quality categories see APIMS Malaysia. The eduKate API and PM2.5 guide explains why a concentration, index and energy measurement must be kept separate.
Clouds versus smoke: two reasons for lower sunlight
A cloudy day may reduce incoming sunlight even without fire smoke. A smoky day may have a nearly cloudless sky yet reduced direct irradiance. Both can occur together. If researchers compare a clear sunny day with a rainy hazy day, they cannot attribute the whole difference to smoke.
A robust study seeks comparable solar elevation, cloud conditions and operating conditions, or uses models to account for these factors. The goal is to estimate the change associated with haze rather than merely note that two electricity totals differed.
The Kuala Lumpur study paid attention to haze, weather and panel parameters. That is an important reason to cite the research instead of creating a conclusion from screenshots of a mobile app.
Module temperature may complicate a simple interpretation
Solar-cell output is affected by temperature as well as light. Under comparable conditions, many common PV modules generate less electrical power as their cells become hotter. Haze may reduce incoming radiation and therefore alter module temperature, which can partly offset or modify the light-driven change.
A researcher who measures only sunlight without monitoring module temperature may miss part of the performance story. An inverter fault, shading or dirt accumulation could also reduce measured output even when ambient pollution remains unchanged.
Therefore the relationship between haze and electricity is not always one straight line. Site monitoring improves attribution.
Could diffuse light help some panel configurations?
Diffuse irradiance can reach surfaces from different directions, sometimes helping modules that are not directly facing the sun. Yet increased scattering may occur together with a larger reduction in overall usable irradiance. The net outcome depends on the panel and the atmospheric mix.
The fact that haze increases the diffuse fraction in a specific case does not prove that haze improves total generation. The measured Kuala Lumpur episode showed an overall reduction in the studied PV output.
Compare total electricity under matched conditions rather than focusing on one optical component in isolation.
What an owner should examine on the inverter dashboard
An inverter or monitoring platform may display instantaneous power, daily energy and historical generation. To investigate an apparent haze-related dip, first verify that the system is operating normally and has no fault messages.
Then compare energy from similar days or use irradiance-adjusted expectations rather than contrasting a sunny weekday with an overcast weekend. Check whether the panels were shaded, cleaned or modified, and whether weather changed. Do not assume the haze is the cause of every unexplained reduction.
Owners should not climb roofs or interfere with electrical equipment for an informal test. Safety inspections and maintenance belong to suitably qualified personnel.
Do not confuse ‘panel cleaning’ with ‘smoke disappearing’
A haze event and soiling on a panel surface are different mechanisms. Smoke aerosols in the atmosphere can attenuate sunlight even when a solar panel is freshly cleaned. Separately, dust and other deposits on the module can reduce transmittance through the cover surface.
Cleaning may address accumulated soiling where needed, but it will not make a regional plume vanish. Unnecessary cleaning during unsafe roof conditions can create fall or electrical hazards. Follow qualified maintenance procedures.
A proper performance diagnosis distinguishes atmospheric attenuation, actual soiling, shading, inverter losses and equipment condition.
Why a solar production drop is not a national blackout prediction
Rooftop and large-scale solar systems form part of a much wider electricity supply and demand system. A temporary loss of solar energy does not automatically imply that the Malaysian grid will fail. Grid operations, generation mix, storage, import arrangements and reserve planning influence reliability.
A headline claiming that haze will ‘shut down Malaysia’s solar electricity’ is misleading without strong operational evidence. The research demonstrates reduced output under some conditions, not unavoidable nationwide power outages.
The wider eduKate Malaysia economic-cost guide explains why sector effects must be measured rather than inferred from a smoky photograph.
Solar systems in Peninsular Malaysia and Borneo may differ
Rooftop PV performance depends on local sunlight and weather. A system in Kuala Lumpur need not experience the same smoke exposure as one in Kuching, Kota Kinabalu, Penang or Johor. Regional wind pathways and fire-source geography differ.
The Malaysian energy regulatory landscape also differs by jurisdiction and programme. National solar rules quoted from a Peninsular Malaysia document should not automatically be treated as legally identical in Sabah or Sarawak.
The Energy Commission’s 2026 guidelines explicitly concern solar self-consumption in Peninsular Malaysia. Always verify the applicable local authority and programme.
What SEDA’s net energy metering means in this context
Malaysia’s SEDA NEM 3.0 information explains historical schemes intended to encourage solar installations and the use or crediting of generated electricity. Solar production can affect household imports from the grid and the financial performance of an eligible installation.
Eligibility, quota, tariffs, credits and procedures can change. Do not quote an older NEM brochure as a guaranteed current offer or assume a home will recover a fixed amount during a haze period.
The correct financial question is how measured output and the owner’s actual tariff and contract combine, rather than applying a percentage from one scientific study directly to every electricity bill.
A worked example: energy lost during one hypothetical day
Illustrative rooftop system, not a live 2026 Malaysian installation: Suppose a system would normally generate 20 kWh under a carefully matched reference day. During a haze-affected day, measured generation is 16 kWh, with other relevant conditions comparable. The observed difference is 4 kWh, representing 20% of the 20 kWh baseline.
This calculation describes the difference in energy between two values. It does not prove the entire 4 kWh was caused by haze unless cloud, temperature and equipment factors were adequately accounted for.
Nor does it prove that the same system loses 20% for the entire month or year. The daily duration and recurrence of haze matter greatly.
A worked example: one cloudy week versus one hazy week
Imagine a monitoring log with two weeks that both average 14 kWh per day. In the first, heavy cloud and rain reduce radiation; in the second, a plume of smoke reduces sunlight during clearer weather. The electricity totals are equal, but the causes are different.
A homeowner who compares only kWh cannot reliably distinguish them. A weather station, satellite aerosol observations, irradiance sensor and relevant local pollution data would provide better explanatory evidence.
This is a useful science lesson: identical outputs do not imply identical causes.
A worked example: performance ratio is different from total yield
A solar installation can generate fewer kilowatt-hours because less sunlight reached it, while still performing efficiently relative to the available irradiance. The performance ratio is intended to compare actual system output with an expectation based on available solar resources and system size, under a defined methodology.
Therefore lower daily energy alone does not prove an inverter has become inefficient. Conversely, an equipment problem may decrease performance even on a sunny day.
A serious technical comparison retains energy yield, irradiation, equipment temperature and operating status, not merely one API value and a daily electricity total.
Should a haze-prone city abandon rooftop solar?
No such conclusion follows from the evidence. A proper solar investment study evaluates annual resource, installation quality, price, durability, maintenance, financing, applicable regulation and all weather-related variability.
An episode that lowers output for days or weeks can be important, yet long-term solar economics depend on many more days and factors. A system designer should incorporate realistic environmental and operational uncertainty rather than declare solar useless because of a historic haze finding.
Reducing preventable biomass burning benefits human health and can reduce one source of intermittent solar-resource disruption. These goals complement rather than contradict renewable-energy planning.
Climate change, peatland fires and solar resilience
Peatland fires release smoke that affects atmospheric radiation and can also release greenhouse gases. Protecting peat hydrology and reducing avoidable ignition therefore connects air quality, ecosystem management and long-term climate policy.
The optical effect of smoke may temporarily reduce solar radiation at the surface, but it is not a climate solution. Fires can damage ecosystems and release carbon stored for long periods.
Read Malaysia haze prevention and peatland restoration for the upstream management dimension. Cleaner-air planning and renewable-energy investment both benefit from reliable environmental information.
An easy classroom experiment without making smoke
Do not burn paper or incense to ‘show haze’ inside a classroom. Students can investigate the concept safely using dated, publicly available irradiance and PV generation datasets, or a teacher-provided spreadsheet with transparent hypothetical values.
Ask students to calculate percentage changes, distinguish power in W from energy in Wh, and list alternate explanations for a low-output day. Then show a real peer-reviewed finding from Kuala Lumpur and discuss why experimental controls matter.
The aim is to teach first principles and evidence evaluation rather than reproduce the pollutant exposure that the article is trying to explain.
A homeowner’s monitoring checklist
- Check the system’s energy and inverter status for the same time period.
- If available, examine irradiance and module temperature.
- Read current Malaysia APIMS data as environmental context, not a direct PV output calculator.
- Check cloud cover, rainfall, shading and maintenance records.
- Compare similar dates or use a transparent resource-adjusted model.
- Document the suspected haze period and any equipment changes.
- Contact qualified solar professionals for electrical, roof or inverter concerns.
- Use the current SEDA or Energy Commission guidance for financial and regulatory decisions.
Frequently asked questions about solar panels and haze
Can solar panels generate electricity during haze?
Yes, they often can, but the output may fall because less usable sunlight arrives. Actual performance depends on irradiance and system design.
Did Malaysia experience a measured 17.8% solar loss?
A published study reported that reduction for the Kuala Lumpur system and 2015 episode studied. It is not a nationwide average for 2026.
Does a Malaysia API of 150 mean solar loses 15%?
No. API is an air-quality index, not a percentage of lost sunlight or electricity.
Can cloud and haze effects be separated?
Researchers can use matched cloud conditions, irradiance observations and modelling, although uncertainty remains.
Does cooler haze always make panels more efficient?
Module temperature may influence performance, but lower sunlight and other variables also matter. A cooler panel is not proof of higher total yield.
Should solar owners clean panels every smoky day?
Not automatically. Atmospheric smoke attenuation is different from deposited soiling. Any maintenance must be justified and conducted safely.
Will haze cause a national electricity blackout?
No automatic conclusion follows from temporary PV attenuation; grid reliability involves many other factors.
Are Peninsular Malaysia solar rules the same as Sarawak’s?
Do not assume so. Check the current applicable authority, programme and jurisdiction.
What should a business graph?
Energy output, irradiance, cloud/weather context, panel temperature and equipment status, with dates and units.
Should the 2015 research percentage be applied to my electricity bill?
Not directly. Use actual energy generation, current tariff arrangements and the relevant monitoring period.
Related eduKate haze and energy reading
- [eduKate’s Gold Standard of Urban Air Quality](https://edukatesg.com/portfolio/the-gold-standard-of-urban-air-quality/
Official energy and academic sources
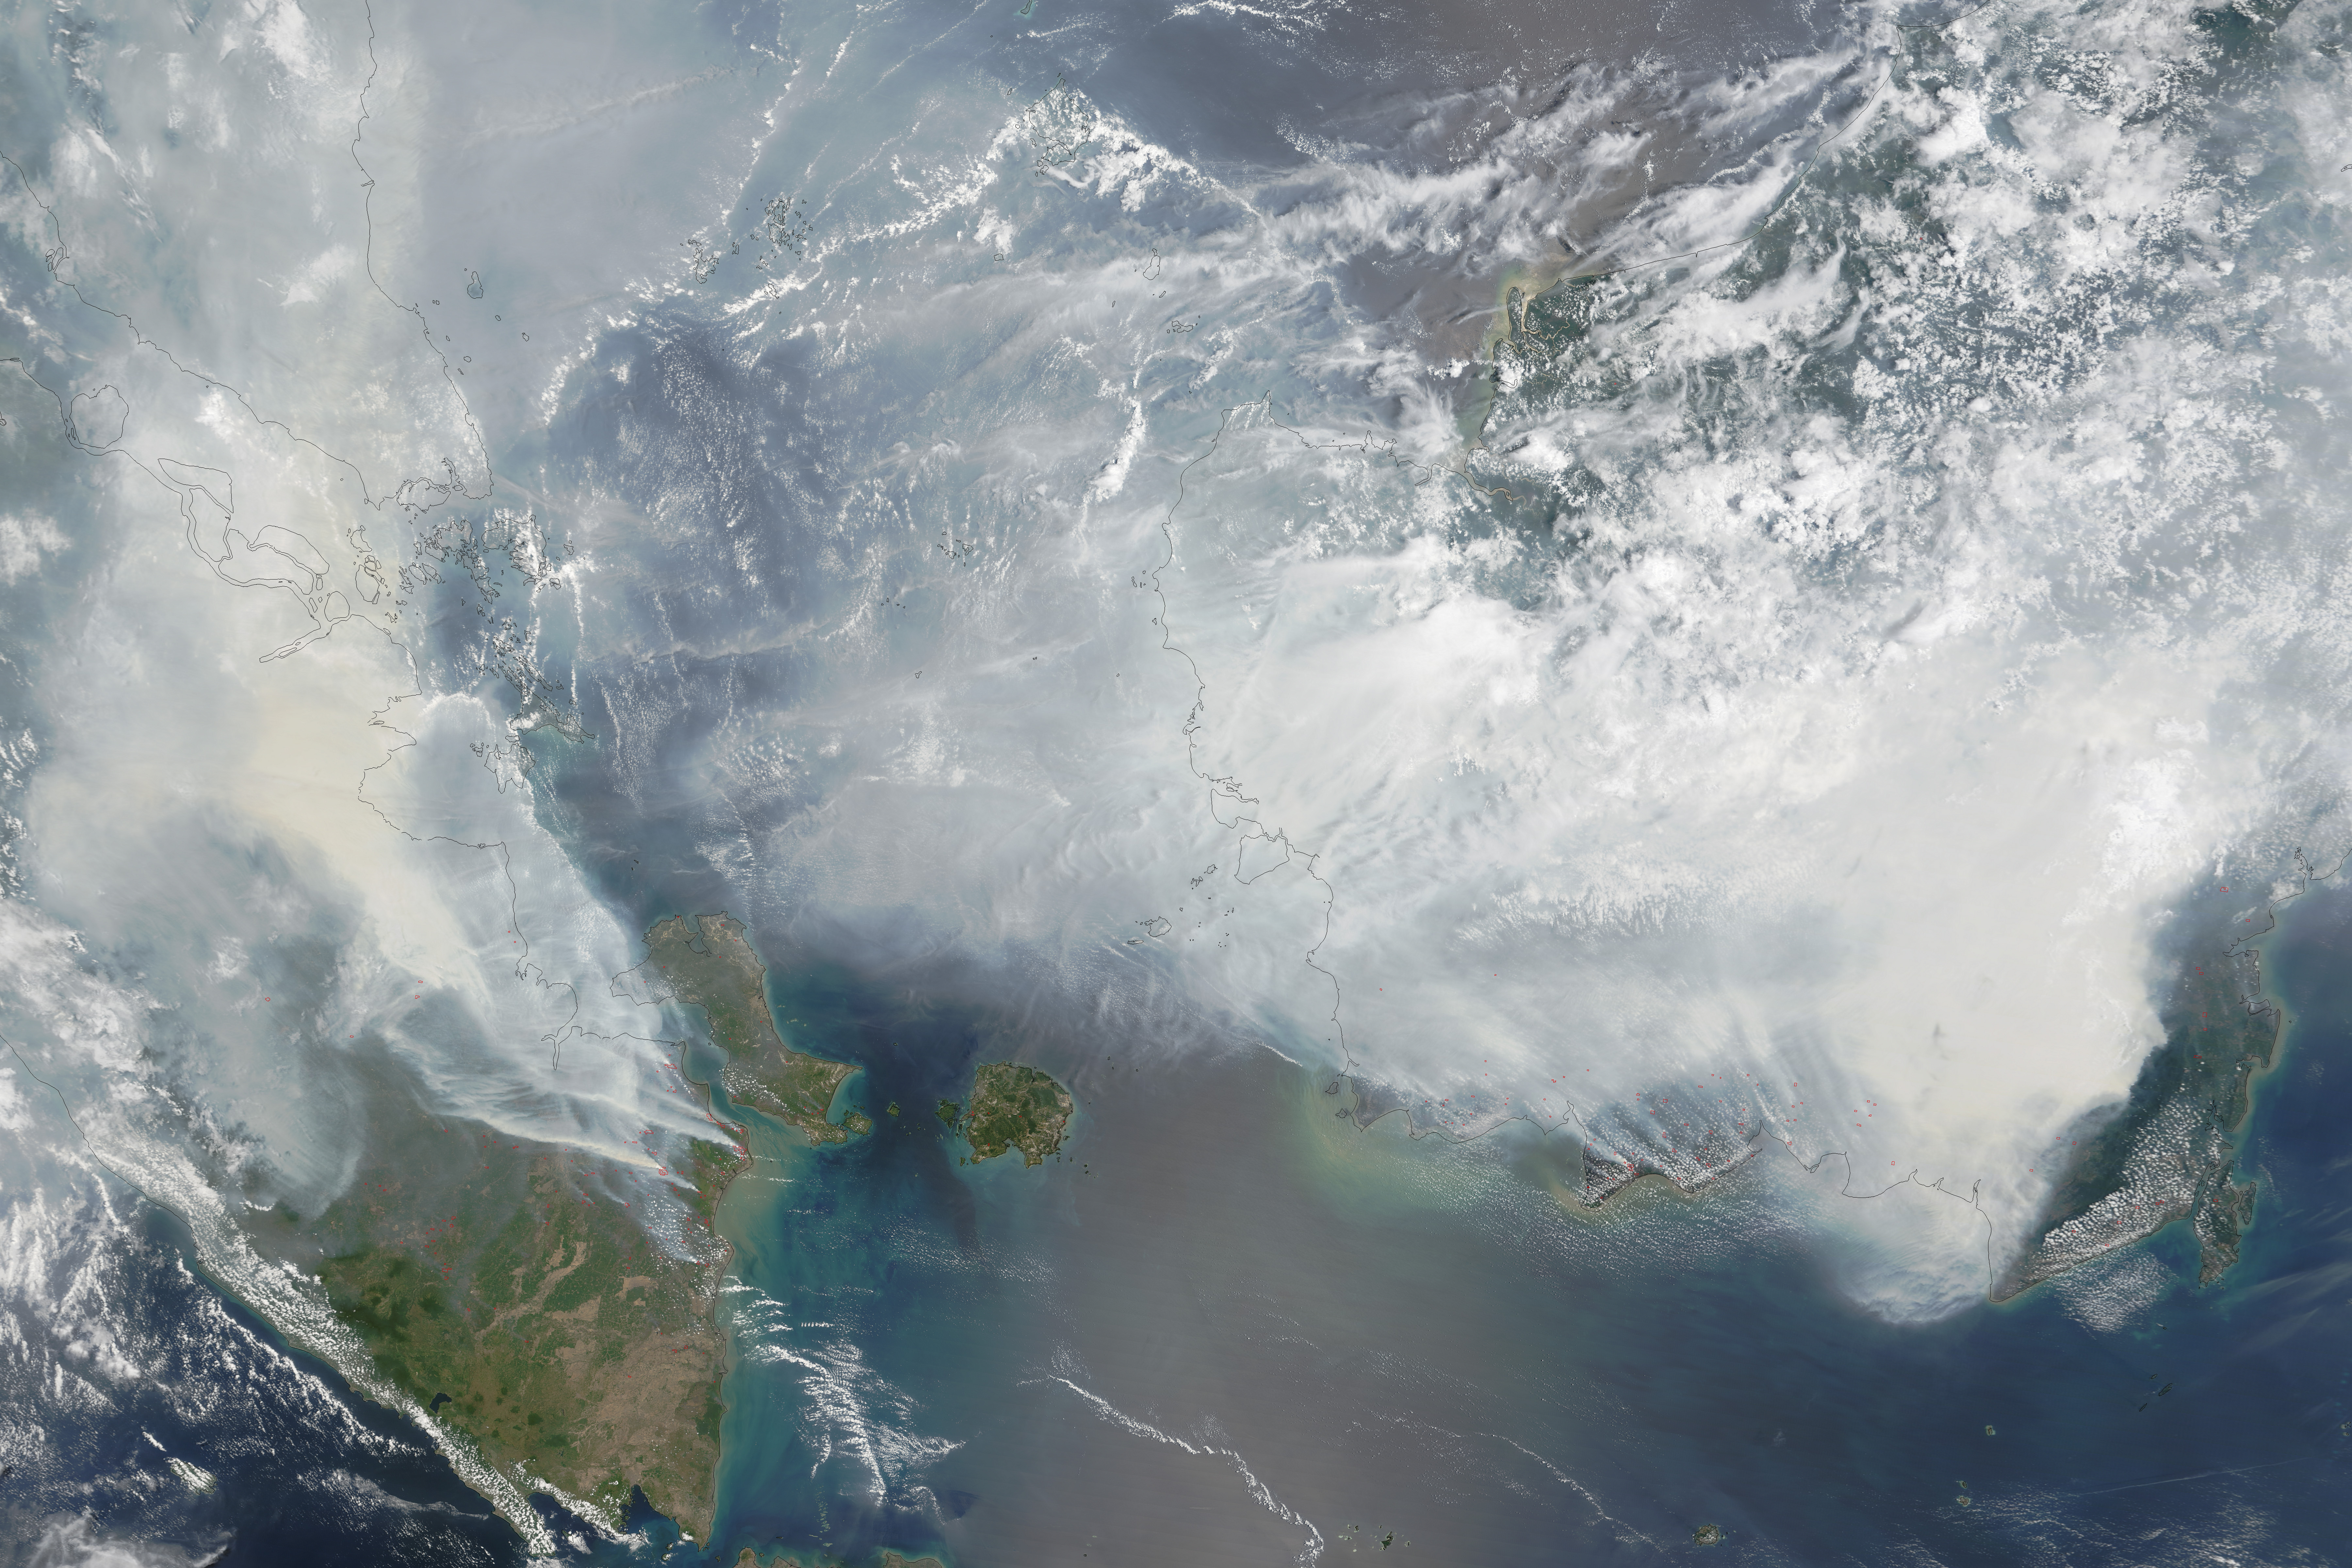
Editorial review: 17 October 2026. The 17.8% and 15–25% study findings are historical case-specific estimates, not 2026 predictions or electricity-bill guarantees. The featured NASA satellite image documents historic regional smoke in 2015 and does not depict solar panels.