
eduKate • Robertson Quay, Singapore • Secondary 2 Geography • Urban change, warehouse timelines and source comparisons
Choose your reading route
Start with a specific source-comparison mistake. Weekday tuition may help when a marked answer is fresh; a weekend can be better for longer comparisons when rested. The test is whether the student can interpret an unfamiliar source alone later.
1919 godowns · Oil-mill warehouses · 2014 conservation · Worked land-use shares · Schedule

Contents
15 source and data chapters
1. Secondary 2 Geography means explaining change rather than memorising a timeline
2. An upstream tidal swamp became a warehouse district—but not overnight
3. The 1919 Jiak Kim Street godowns and the meaning of an individual building date
4. 1921 on a Caseen Street facade: one date should never become an area-wide claim
5. The Ho Hong Oil Mills warehouses show retention and reuse as different variables
6. 6 June 2014 was the conservation gazette, not the date the godowns appeared
7. The 1977–1987 Singapore River clean-up is a separate environmental change
8. Today’s Robertson Quay subzone is not a homogeneous industrial district
9. A fictional ten-plot land-use map and the percentage-point distinction
10. More premises can still mean a smaller share of the sample
11. Official heritage, modern planning and photographs are not interchangeable
12. Choose a tuition day that leaves room for a new source comparison
13. Three students may discuss one historic source, but each needs personal feedback
14. Four-week learning plan: chronology, percentages and independent explanation
15. Parent checklist, frequently asked questions and Robertson Quay siblings
Secondary 2 Geography means explaining change rather than memorising a timeline
Secondary 2 Geography tuition in Robertson Quay should begin by checking whether a pupil can compare sources that describe different times, spaces and functions. Remembering a warehouse’s construction date is helpful, but it does not automatically explain why the riverfront changed. A good Geography response identifies what changed—land cover, economic use, architecture or planning status—then states which source supports that claim and what more would be needed to explain the causes.
A marked school response can reveal the first problem. Perhaps the learner confuses the 2014 conservation gazette with construction of much older godowns. Perhaps they compare an old photograph with a modern commercial map without checking that both depict the same area. Or perhaps they calculate an increase in percentages but describe it incorrectly as a percentage-point change. These are different skills, and extra facts will not fix all of them.
The MOE lower-secondary Geography syllabus provides the broad G2/G3 framework, while the school’s current topic and assessment remain the immediate teaching priority. A tutor should ask which command word appeared in the difficult question: describe, compare, explain or evaluate. The answer structure follows the task, not merely the student’s favourite case.
The Robertson Quay evidence is rich because the conservation source documents nineteenth-century reclamation, industrial warehouses, specific building dates and a later gazette. Each record is useful when attributed correctly. The challenge is not making the longest account but producing an accurate comparison from several source types.
A child can demonstrate transfer by completing a fresh two-period land-use problem set in an unfamiliar district. Parents should ask for the independent result after a delay rather than judging only a beautifully corrected first attempt.
An upstream tidal swamp became a warehouse district—but not overnight
URA’s Robertson Quay history describes relatively undeveloped swampy tidal land in the upstream area during the 1890s. Reclamation in the nineteenth century helped create land for warehouses needed by expanding trade. By the early 1930s, godowns extended along Robertson Quay, Havelock Road and Jiak Kim Street, with bumboats moving goods on the river. These facts trace changes in physical land and commercial use over decades, not one instantaneous transformation.
Ask students what kind of data each statement concerns. Swampy tidal land describes physical conditions. Reclamation describes human modification. Warehousing and boat traffic describe functions and movement. A conclusion that “every swamp became a hotel by 1930” is unsupported: URA reports historical warehouses, not a modern hospitality land-use map for that period.
A first-principles explanation might link expanding entrepot trade with demand for storage close to river access. This is a plausible mechanism supported by URA’s historic account. But if the task asks how a particular merchant financed an individual godown, the broad history is insufficient. Different geographical questions require different levels of evidence.
The learner can create three maps as fictional teaching devices: earlier tidal land, a later filled bank and an early-twentieth-century warehouse layout. Ask what changes in the area, built form and transport network. The maps are not real surveys and should not be used as exact reconstructions of Robertson Quay’s footprint.
A strong response identifies the evidence boundary and dates: the official history describes broad redevelopment by the early 1930s, but does not list each parcel’s exact construction date. This is a much better statement than treating all the buildings as one development completed in a single year.
The 1919 Jiak Kim Street godowns and the meaning of an individual building date
URA identifies the one-storey warehouses at 17, 19 and 21 Jiak Kim Street as built in 1919. Their roof structures combine galvanised iron sheeting, timber trusses and internal reinforced-concrete columns. This is a source-supported description of a particular trio, not the year of construction of every riverside warehouse. The published source also describes how building technology was changing as industrial methods reached Singapore.
The date can anchor a careful timeline. Before 1919, the broader upstream landscape was already changing; after 1919, warehouses continued to be built or adapted; by the 1930s much of the area was developed. Conservation designation came much later in 2014. Students must attach each year to its own event instead of describing all these facts as the same redevelopment.
The building technology offers an upper-secondary-ready inference question. A wide roof span may influence the need for support, and construction materials can affect load and ventilation. The URA account provides architectural information, but a school child should not calculate modern structural safety or an actual load-bearing capacity from it. That would require engineering drawings and professional assessment.
Ask students to write two statements: “URA documents three single-storey Jiak Kim warehouses constructed in 1919,” followed by “Their construction methods show how storage buildings incorporated different materials and support systems.” The second draws an interpretation from the recorded design without inventing current occupancy or profitability.
Then give an unseen source about an imaginary 1925 mill and ask the learner to separate construction date, former function and present use. If the same method works, the historical fact has served as an introduction to a geographical skill rather than a piece of trivia.
1921 on a Caseen Street facade: one date should never become an area-wide claim
URA’s Robertson Quay conservation account identifies 63 Caseen Street among a row of historic buildings and notes the embossed construction year 1921 on its facade. The record describes decorative plasterwork with fruit and floral motifs influenced by European and Asian traditions. Such visible fabric helps establish the heritage of a specific property; it cannot date every other building nearby.
This source creates a useful comparison with the 1919 Jiak Kim Street godowns. One source documents a row’s roof structures and industrial construction, while another highlights facade elements on an individual Caseen Street site. A pupil who calls both “1919 warehouses” has mixed data from different properties. Clear attribution and site naming are necessary before discussing patterns.
A photo can provide evidence that a visible date is on a particular facade at the time photographed, but the official heritage record is needed to interpret the source’s architectural meaning. A picture alone cannot establish the present economic function of every room or the personal intentions of all past builders.
To turn the history into Geography, ask how built form can contribute to a recognisable streetscape while activities evolve over time. Heritage designation may help manage significant physical features, while land use can be studied with separate current classification data. The sources should not be merged into an unverified claim that the original businesses continue.
Give the child a comparison exercise with two different dates, addresses and functions. Ask for a 100-word paragraph that includes both facts, one spatial distinction and one limitation. The goal is careful source synthesis under a manageable time constraint.
The Ho Hong Oil Mills warehouses show retention and reuse as different variables
URA’s conserved-building record for 320 Havelock Road identifies three connected late-nineteenth-century warehouses formerly occupied by the Ho Hong Oil Mills. In later adaptation, historic lettering and warehouse features were retained or uncovered, while the buildings were given new life. The record describes original roof trusses, plaster mouldings, jackroofs and other details retained in the modern development.
The case teaches a crucial distinction. A warehouse can retain architectural characteristics while its economic function changes. If the student’s question concerns original land use, an oil-mill record is relevant; if it asks about current activities, a current building source is needed. An attractive restored facade does not establish that an oil mill is still operating there.
A strong explanation could say that adaptive reuse can enable historic built forms to serve changed urban needs while maintaining visible links with the past. But its success for neighbours, workers or visitors cannot be established from architectural features alone. Social and commercial effects require different evidence and time frames.
Ask pupils to classify claims as physical, functional or economic. “Roof trusses retained” is physical. “An oil-mill-associated warehouse changed use” concerns function over time. “Every nearby business gained revenue” would need financial evidence not supplied by the URA building profile. Keeping those categories distinct makes source-based writing clearer.
A new fictional case might feature a former textile workshop adapted as a library. Students should explain what changed and what could stay without assuming the same preservation rules or outcomes apply. This kind of independent transfer makes a local example useful.
6 June 2014 was the conservation gazette, not the date the godowns appeared
URA states that the Robertson Quay Conservation Area was gazetted on 6 June 2014. That date describes official heritage designation. It is different from the 1919 Jiak Kim Street warehouse construction or the 1921 Caseen Street facade, and far later than the area’s nineteenth-century reclamation. A source-based answer should preserve these categories.
Many Geography pupils know dates but attach them to the wrong event. “Robertson Quay warehouses were built in 2014” sounds precise but is false. The tutor should demonstrate how to label a timeline’s verbs: reclaimed, built, developed, used, gazetted and adapted. Each describes a different sort of change and requires a source suited to it.
| Date or period | Verified subject of source | Unsupported shortcut |
|---|---|---|
| 1890s | Upstream land relatively undeveloped and tidal | All of Singapore was swampy then |
| 1919 | Named Jiak Kim warehouses constructed | All godowns date from 1919 |
| 1921 | Specific Caseen Street facade date | Every Robertson Quay building dates to 1921 |
| Early 1930s | Warehouse district widely developed | No later land-use change occurred |
| 6 June 2014 | Robertson Quay conservation gazette | Warehouse construction happened then |
Heritage protection also does not mean every previous business survives. URA says additions, alterations and changes of use require relevant conservation permission and compliance. The pupil should learn that built form, economic function and regulatory status are separate variables whose histories can overlap.
A useful exam-style task provides three sources: historic building record, gazette statement and a modern land-use map. Ask which supports the year, which supports the regulation and which would help identify today’s uses. If the child matches them without prompts, chronological precision is improving.
The 1977–1987 Singapore River clean-up is a separate environmental change
PUB’s river clean-up history records a major river and Kallang Basin clean-up beginning in 1977 and ending on 2 September 1987. The programme involved eliminating pollution sources and improving waste management. This is an environmental intervention distinct from Robertson Quay’s 2014 conservation status and from the earlier construction of warehouses.
A child can explain plausible environmental processes: controlling wastewater and rubbish can reduce pressures on river quality. But the programme’s completion date is not a substitute for site-specific present water measurements, and a downstream photograph cannot establish dissolved oxygen or bacterial conditions upstream today. The date of an intervention and a measured outcome are different kinds of evidence.
Ask pupils to create two evidence cards. One records a dated programme action from PUB; the other asks for an appropriate variable to evaluate water conditions, such as a carefully defined water-quality measurement. The second cannot be filled with an invented real value. Classroom simulations can be labelled as fictional for arithmetic, but source integrity matters.
Geography also requires correct spatial extent. A clean-up of the Singapore River and Kallang Basin is broader than any single Robertson Quay warehouse. Results at one sampling point could differ from another and require a representative design if used to discuss a larger waterway.
The child should practise with an unrelated environmental programme, such as a hypothetical urban drainage upgrade. Can they distinguish plan, completion and measured effect? That method is more useful than memorising only the clean-up dates.
Today’s Robertson Quay subzone is not a homogeneous industrial district
URA’s 2026 Singapore River urban-design guidance describes a Robertson Quay subzone containing waterfront residences, hotels and arts-related facilities in conserved buildings. This contemporary planning description differs from the historical account of godowns. The contrast illustrates urban land-use change, but a student should not claim every particular warehouse has become a hotel without a current property-specific source.
A planning subzone is a broader area than a conservation listing for one building. A map of current land uses may classify areas as residential, hotel or other functions, but the precise designation for each site depends on that map’s source and date. Students should check that the category shown is the category used in their comparison.
A common weak statement is “Robertson Quay stopped being industrial in exactly 2014.” URA’s conservation gazette year does not prove a complete economic transition on that date. The agency records the phased decline of river trade from the late 1970s, while later mixed uses emerged over time. Urban change is often gradual and spatially uneven.
For a good explanation, describe the pattern first: historical warehouses and current mixed-use development appear in different sources. Then discuss relevant processes such as changing cargo technology, central-area demand and building adaptation as potential influences, distinguishing the general mechanism from site-specific proven causes.
A tutor should present an unfamiliar district with former factories and current educational buildings after the Robertson example. Students who can compare the source functions independently have learnt a general method.
A fictional ten-plot land-use map and the percentage-point distinction
The following table is entirely fictional classroom data, not a land-use survey of Robertson Quay. Imagine the same ten plots classified in two periods. In the earlier map, three are designated cultural or residential mixed use, with seven other uses. In the later map, seven are mixed use and three other. The pupil must calculate the change in share rather than invent a cause.
| Invented map | Mixed-use plots | Other plots | Mixed-use share |
|---|---|---|---|
| Earlier | 3 | 7 | 30% |
| Later | 7 | 3 | 70% |
| Change | +4 | −4 | +40 percentage points |
The share rises from 30% to 70%, a 40-percentage-point increase. It is not a relative 40% rise: the difference divided by the starting 30% would give roughly a 133.3% relative increase. The correct language depends on whether the question asks for a change in percentage points or proportional growth.
The observation describes a reclassification in a fixed illustrative sample. It does not prove that transport access caused the change or that land value rose. Those are additional variables requiring evidence. A candidate who adds a plausible story as an established cause has crossed from reading the source into unsupported inference.
The comparison assumes the same ten plots, boundaries and category definitions. If the second map includes additional streets or defines mixed use differently, the percentages are not automatically a fair before-and-after trend. Source titles, legends and geography need checking before calculation.
For transfer, give twelve fictional plots with four mixed use initially and nine later. Shares move from 33.3% to 75%, or approximately 41.7 percentage points. Let the learner calculate with the new denominator and explain the limitation without the model.
More premises can still mean a smaller share of the sample
In another invented exercise, an imaginary survey A records twelve dining premises among thirty sampled units. Survey B records eighteen among sixty. The count increases by six, but the category’s share falls from 40% to 30%. This is possible because the total sample doubles while the numerator grows by only half.
| Fictional sample | Dining premises | Total premises | Share |
|---|---|---|---|
| A | 12 | 30 | 40% |
| B | 18 | 60 | 30% |
| Difference | +6 | +30 | −10 percentage points |
A pupil who writes that dining is proportionally more common in B because eighteen is greater than twelve has confused count with share. A better answer reports both trends. Counts may matter when planning absolute demand, while percentages matter when studying the composition of a population. The question determines which comparison is relevant.
The larger sample raises a second source issue. Does survey B cover the same area and use the same definitions as A? If it adds more streets or counts temporary stalls differently, the difference might reflect method rather than actual conversion of individual premises. A precise limitation names the possible mismatch rather than saying vaguely that results are unreliable.
Ask a student to solve a new fictional table: eight studios in forty units, followed by nine in thirty. The counts rise by one and the share rises from 20% to 30%. The student should be able to explain why this differs from the original comparison without simply copying sentences.
No part of either table should be reported as observed Robertson Quay business statistics. They are exercises designed to prepare pupils to interpret real school datasets responsibly.
Official heritage, modern planning and photographs are not interchangeable
A heritage record is well suited to construction dates, architectural features and conservation requirements. URA’s contemporary design guidance describes planning aims and land-use patterns. An image offers visible detail from one viewpoint and time. A PUB chronology documents an environmental programme. Each contributes to understanding a place, but none automatically supplies all types of data.
| Type of source | Useful evidence | Question it cannot answer alone |
|---|---|---|
| URA historic warehouse profile | Godown features and dates | All current tenant revenue |
| URA river urban-design guidelines | Planning subzone and promenade rules | Today’s exact pedestrian count |
| PUB river clean-up history | 1977–1987 programme | One point’s current water chemistry |
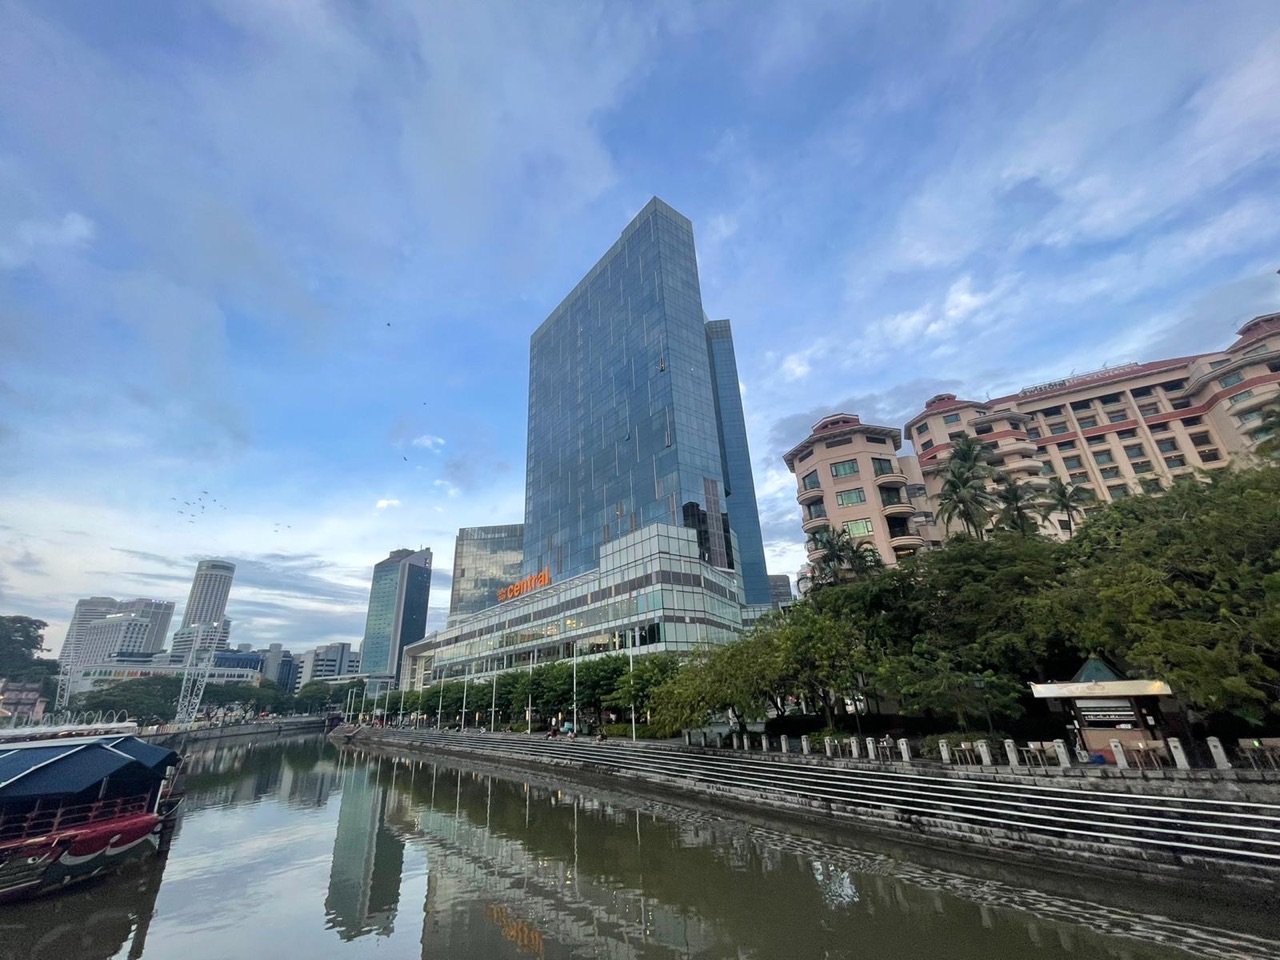
| Downstream eduKate photograph | Visible form in the pictured reach | Robertson-specific warehouse appearance |
A child may trust an official source but apply it to the wrong variable. The URA conservation profile may be accurate for 1919 warehouse construction, yet it cannot confirm a present visitor trend. The proper question is not only “Is the source trustworthy?” but also “Is this the correct source for what I am claiming?”
A good comparison explicitly names the geographical extent. Boat Quay in a photograph, Robertson Quay in a heritage record and the entire Singapore River in a PUB programme differ in scale. Their information can be used together only with those boundaries preserved.
Ask pupils to write one claim from each of two sources, identify what they do not know and propose which source could fill the gap. The answer should remain concise rather than combine all facts into a long, unsupported narrative.
Repeat the exercise using an unfamiliar riverfront or town. Transfer matters because the examination will not necessarily use Robertson Quay’s recognisable buildings.
Choose a tuition day that leaves room for a new source comparison
Secondary 2 students face school tests, CCA, projects and family commitments. A weekday Geography lesson may be effective when a marked question has just been returned and the child is still alert. A weekend can allow more time to compare dated sources calmly, but it can also remove the only time for individual practice and recovery. No calendar label is universally best.
| Family circumstances | Weekday option | Weekend option | Independent evidence |
|---|---|---|---|
| Recent source-comparison error | Prompt targeted repair | Longer calm review | New timeline correct |
| CCA ends late | Avoid tired evening | May provide better concentration | Exit answer accurate |
| Weekends already crowded | Protect family time | Only with a real quiet slot | Return task completed |
| Correct numbers, weak claims | Short evidence drill | Deeper explanation | Bounded conclusion without hints |
The valuable unit of instruction is the full learning loop: diagnose the exact error, explain the first principle, practise with help, complete a different question independently and retrieve the method after a delay. A lesson that ends only with a beautifully rewritten original response may feel productive without demonstrating transfer.
Parents can try similarly difficult source questions on an ordinary weekday and a more rested day over a fortnight. Look for sustained attention and whether the pupil reads dates, boundaries and denominators before writing. A single trial is only a clue, but repeated fatigue or missed follow-up can guide a sensible timetable change.
A tutor should be comfortable advising fewer lessons if the child already performs independently on unfamiliar work. The purpose is a real improvement in learning, not simply occupying another afternoon. The schedule should preserve sleep and other school responsibilities.
Confirm actual Geography teacher availability, group size, fee and venue. A local article does not imply eduKate currently teaches on Robertson Quay’s waterfront.
Three students may discuss one historic source, but each needs personal feedback
A three-learner Geography group can be effective when the tutor sees each child’s different error. One pupil might mix construction and conservation dates. Another may miss the denominator in a percentage question. A third may write a plausible explanation without evidence. A shared discussion can expose these differences, but every child must finish with an individual answer.
Rotate roles: source historian, data reader and inference challenger. The first checks dates and geography, the second computes the correct comparison, and the third asks which conclusion exceeds the evidence. Then swap roles and give each student a fresh source pair. The strongest speaker should not become the permanent writer for the group.
A ninety-minute illustrative class might include ten minutes of retrieval, twenty of marked-error diagnosis, twenty of guided comparison, twenty of independent writing and twenty of feedback. The exact timing can vary, but the tutor should record how many prompts each learner still needs.
The Fencing Method encourages the child to remain within the task’s date, location and measured variable. For example, a 2014 conservation gazette cannot become a 2014 construction record; a source about warehousing cannot prove current leisure spending. Identifying these boundaries is part of geographical maturity.
Parents can ask for one original error and an unseen later response that demonstrates the correction. The Clementi small-group Mathematics reference illustrates close teaching, but a current Robertson Quay Geography class, three-learner cap and venue require verification.
Four-week learning plan: chronology, percentages and independent explanation
A month of targeted work can reveal whether specific source errors are becoming less common. Begin with the actual school unit and a marked paper. Week one corrects event dates and site boundaries. Week two rebuilds percentages and changes in shares. Week three teaches a supported explanation of urban and environmental change. Week four tests the method on an unfamiliar case.
| Week | Learning target | Independent proof |
|---|---|---|
| 1 | Match construction, activity and gazette dates | Accurate fresh timeline |
| 2 | Counts, shares and percentage points | New sample calculated correctly |
| 3 | Built-form change versus measured outcomes | One evidence-bounded paragraph |
| 4 | Unseen place with two source types | Transfer without tutor prompts |
Keep the error log short: “1919 construction treated as 2014 gazette”, “source photo of different quay”, “relative percentage confused with percentage points”, or “a possible cause written as a proven result”. Each describes a specific behaviour that can be taught and checked again.
At home, parents can ask “What changed?” and “Which source tells you that?” Let the learner point to a date, map legend or table before writing. This encourages ownership without turning the family into another tuition class.
Review lesson timing alongside academic work. If late weekday tuition leaves no time for retrieval or an already full weekend removes rest, adjust. More hours do not necessarily produce more independent thinking.
No reliable tutor can promise a fixed grade rise in four weeks. A more realistic success is a student who reads unfamiliar sources carefully, calculates correctly and writes supported explanations with fewer hints.
Parent checklist, frequently asked questions and Robertson Quay siblings
- Verify the child’s exact Secondary 2 school Geography or Humanities unit.
- Bring a marked source-comparison question and teacher comments.
- Check construction dates, conservation gazette and publication dates separately.
- Ask for a new independent task after guided correction.
- Use the correct denominators for counts, shares and percentage points.
- Compare weekday/weekend CCA, travel, sleep and spaced retrieval.
- Confirm actual tutor, group size, subject availability, fees and lesson location.
Was the Robertson Quay Conservation Area created in 1919? No. URA records its gazette on 6 June 2014. The 1919 date applies to selected Jiak Kim Street godowns.
Does a 1921 Caseen Street date describe every warehouse? No. It is a date recorded for a particular facade in the heritage account.
Are all historic Ho Hong Oil Mills warehouses still used as an oil mill? The URA restoration source documents former use and adaptation; do not assume current activity without a suitable up-to-date source.
Are the land-use percentages above real Robertson Quay surveys? No. They are explicitly fictional classroom calculations.
Is weekend tuition always better for lengthy source comparison? No. The best timing leaves the learner alert and permits later independent practice.
See Secondary 1 Robertson Quay Geography, Secondary 3 and Secondary 4 for their distinct learning needs.
Official reading: URA Robertson Quay Conservation Area · URA 320 Havelock Road · URA Jiak Kim Street building · URA Singapore River design · PUB Singapore River clean-up · MOE lower-secondary Geography. Invented classroom plots and percentages are not real surveys; fieldwork requires teacher-approved safety and methods.
Parents can contact eduKate Singapore with the actual subject, marked work and practical weekday/weekend choices. Confirm group, tutor, venue and fees. No Robertson Quay branch or examination grade is guaranteed. Properly taught kids shine a bright light into the future.