
eduKate • Robertson Quay, Singapore • Secondary 1 Geography • River maps, historic warehouses, geometry and independent explanations
Choose your reading route
A Geography lesson is worth considering when it repairs a visible map or evidence-reading error. Weekday tuition may help while a school task is fresh; weekends may work better after long CCA days. The best arrangement permits an unaided new question later.
First skill · Worked warehouse dimensions · 2014 source date · Tuition timing · Parent FAQs

Contents
15 educational chapters — choose the relevant learning need
1. Why Secondary 1 Geography begins with a map-reading diagnosis
2. Robertson Quay, the conserved warehouses and the whole river are different spatial units
3. What a downstream Singapore River photograph can and cannot tell us
4. Worked fictional river map: compass direction and symbol meaning
5. Scale conversion: the shortest straight line is not a verified walking route
6. A real warehouse measurement can teach why length, width and area differ
7. One network has many links, and the fewest links need not be the shortest route
8. Swampy tidal land and godowns: the map can show change without proving every cause
9. The 2014 conservation date is not the construction date of every old warehouse
10. A safeguarded promenade width is a planning rule, not a measurement of every walkway
11. Worked imaginary footfall: the highest count is not always the highest rate
12. Weekday or weekend: choose the slot that allows a second independent attempt
13. What happens inside an effective ninety-minute three-learner tutorial
14. Four-week Geography foundation plan: maps, measures and evidence
15. Parent checklist, FAQs and the Robertson Quay Geography learning pathway
Why Secondary 1 Geography begins with a map-reading diagnosis
Secondary 1 Geography tuition in Robertson Quay should help a child move from recognising a Singapore place to reasoning accurately about maps, distances and sources. A pupil may know the riverfront has old warehouses yet still mistake a conservation boundary for a river line, omit units in a scale conversion or assume one photograph proves an entire day’s visitor numbers. These errors call for different teaching. The first lesson should inspect an actual marked school response rather than begin with a stack of memorised local case studies.
Ask the learner to look at a new map. Where does the north arrow point? What does the symbol key define? Does the question refer to a point, a building, a road, a river reach or an entire planning district? The child who can name each correctly is already becoming more precise. If they cannot, the tutor can rebuild the first missing step with a short, tangible diagram and a fresh question.
The MOE lower-secondary Geography G2/G3 syllabus supports geographical inquiry and reasoning, but the child’s actual school Humanities route, current unit and marking comments should direct the immediate lesson. The important goal is not premature mastery of advanced exam terminology. It is a stable foundation: accurate description, fair comparison, sensible explanation and recognition of what the source does not show.
A useful first task asks for one supported observation and one statement that would need additional evidence. For instance, a river map can identify the position of a bridge but cannot supply its current hourly pedestrian use if no counts are provided. A student who says this clearly has demonstrated healthy evidence discipline rather than a lack of confidence.
A good consultation can end with an unseen independent map task. The parent should see the first error, the guided correction and the later answer without hints. That evidence is more meaningful than a perfectly copied model paragraph.
Robertson Quay, the conserved warehouses and the whole river are different spatial units
URA’s Robertson Quay conservation history describes Robertson Quay as the largest and most upstream of the three historical Singapore River quays, the others being Boat Quay and Clarke Quay. URA’s Singapore River design guidance describes a three-kilometre corridor with those distinct subzones. These place names are related, but they are not interchangeable boundaries. The conservation area refers to selected protected buildings, while the planning subzone includes multiple current uses.
A student must learn that a river is commonly shown as a line or narrow water polygon, a conservation area as a bounded region, a walking route as a connected line, and an individual warehouse as a footprint or point. A source identifying one restored building cannot automatically establish facts about every property along three kilometres of waterfront. This is a basic but powerful geographical skill.
The 2026 URA guidance names residences, hotels and arts-related facilities in the Robertson Quay subzone. The range of uses demonstrates why “this is a warehouse district” is an incomplete description of the present planning area, although warehouses are central to its history. The pupil should identify whether the question asks about historic function or current reported use.
Try drawing an imaginary shaded district crossed by a blue river and a line representing a promenade. Put one small square inside for a conserved warehouse. Ask which claims belong to the square, which to the shaded area and which to the whole river. If a child describes all three as “the same place” without specifying scale, the tutor has discovered a useful lesson target.
This distinction transfers easily to nature reserves, housing districts, coastlines and river catchments. Geography becomes more reliable once the child asks, “Exactly what area is this sentence about?” before writing.
What a downstream Singapore River photograph can and cannot tell us
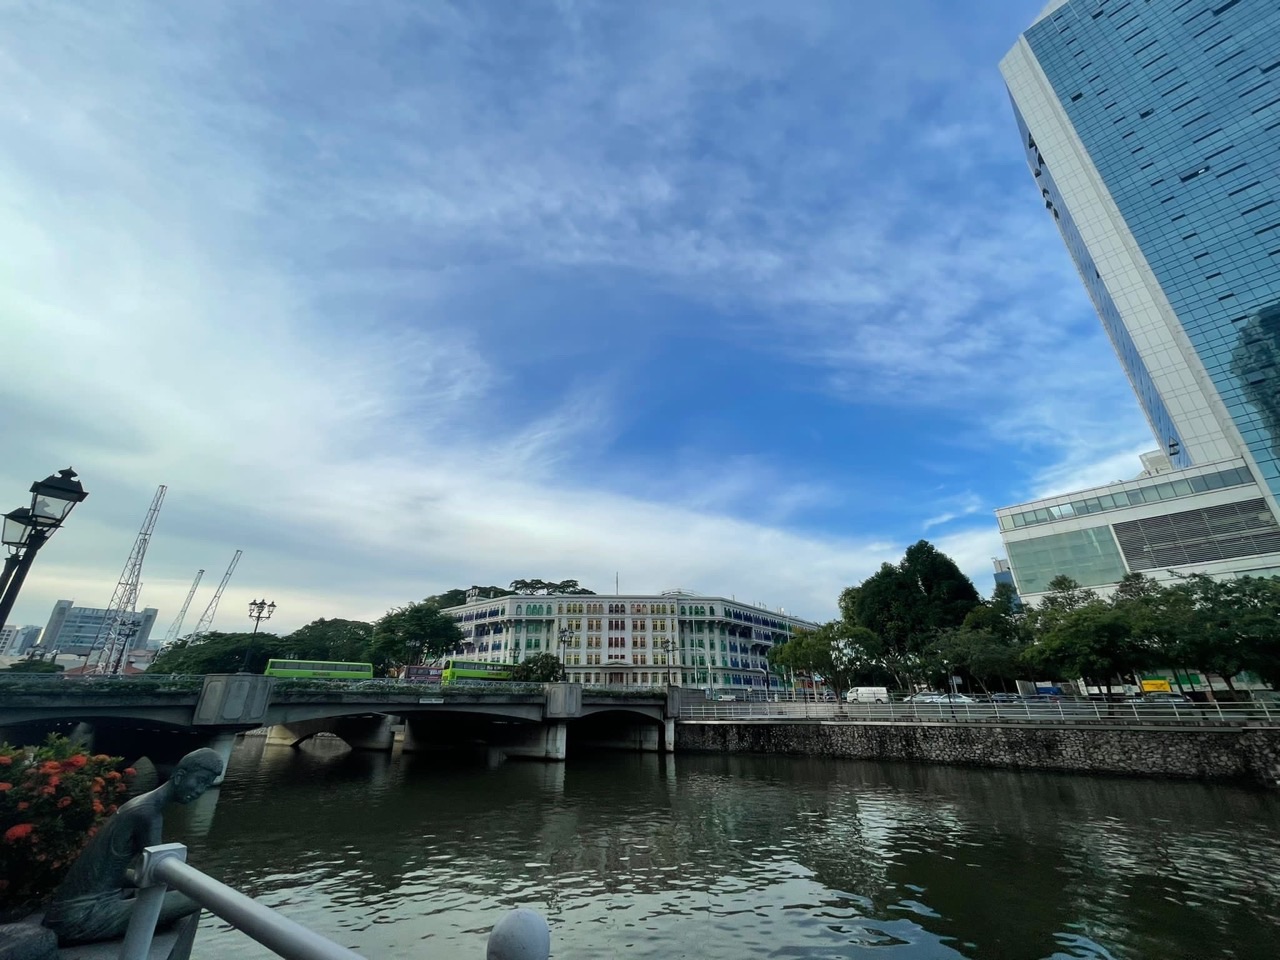
The eduKate photograph above was taken around Boat Quay and River Valley, downstream of Robertson Quay. It is deliberately labelled as a wider Singapore River reference, not a photograph of Robertson Quay’s specific conserved godowns. This matters because a visual source is only trustworthy when its location and content are identified correctly. Two quays on the same river may share broad characteristics while remaining distinct places.
A learner can use the image to identify visible water, built-up riverbanks and contrasting buildings at the moment captured. The image cannot demonstrate the roof details of Merbau Road warehouses further upstream, or prove present visitor satisfaction along all three quays. For those questions, a source tied to the right building or a properly defined survey would be required.
Ask the child to sort three statements. “This is a view of the Singapore River” is supported by the image’s known location. “URA documents 1919 warehouses at Jiak Kim Street” requires a historical building source. “Every restaurant in Robertson Quay has a high daily revenue” is unsupported by either. The activity demonstrates that two accurate sources may answer different questions.
A good tutor encourages careful language rather than the vague command to “add detail”. The correct revision may be as simple as changing “at Robertson Quay” to “downstream along the same Singapore River” or replacing an unsupported total with “not measured in this source”. Precision is an important Geography skill even when the correction is short.
For transfer, present another unfamiliar photograph with a separate caption and ask the learner to identify one observation, one supported external fact and one claim requiring new evidence. The technique should work without memorising this particular image.
Worked fictional river map: compass direction and symbol meaning
Imagine a fully fictional five-by-five map, not a route guide to Robertson Quay. Columns A to E increase from west to east and numbered rows increase from north to south. The north arrow points towards the top. A school symbol is at B3, a gallery symbol at D3, a garden at B1 and an imaginary pedestrian crossing at C4. A learner should use only the stated legend and orientation.
| Illustrative symbol | Grid | Relationship to the school at B3 |
|---|---|---|
| School | B3 | Starting point |
| Gallery | D3 | Two columns east |
| Garden | B1 | Two rows north |
| Crossing | C4 | One east, one south |
D3 lies east of B3 under these conventions. The garden is north. But nothing says how many metres a grid square represents, so “two columns” must not be renamed “two hundred metres”. Nor does the diagram establish safe or accessible paths. A schematic map includes only the variables the maker chose to represent.
Change the north arrow to point right while keeping symbols in their original page positions. The relationship must be reinterpreted: the right side of the page now represents north, not east. Children who repeat their original answers reveal that they have memorised visual position rather than checked compass orientation. A paper arrow or quick sketch helps make the idea visible.
Give the map a new legend with triangles for stations, squares for gardens and circles for bridges, all the same colour. Does the learner read the shape and legend or guess from colour? This small variation reveals how carefully they attend to geographical conventions.
End with a completely new imaginary grid and no verbal hints. Each student should write at least two full location statements and one evidence limitation. This provides individual progress information rather than a shared class answer led by the most confident pupil.
Scale conversion: the shortest straight line is not a verified walking route
In a fictional Robertson Quay map exercise, the scale is 1:4,000. One centimetre represents 4,000 centimetres on the ground, or 40 metres. Two imaginary locations are separated by 3.25 centimetres on the page. The calculation is 3.25 × 4,000 = 13,000 centimetres, or 130 metres. This is a represented straight-line separation, not an observed walk along the actual waterfront.
| Fictional ruler distance | Calculation | Meaning |
|---|---|---|
| 3.25 cm at 1:4,000 | 3.25 × 4,000 ÷ 100 | 130 m straight-line separation |
| 4.5 cm at 1:4,000 | 4.5 × 4,000 ÷ 100 | 180 m straight-line separation |
| Difference | 180 − 130 | 50 m |
| Actual walking duration | No route and speed supplied | Cannot infer |
A pupil can make a numerical error by forgetting to turn centimetres into metres. Another may obtain the correct 130 metres yet claim that two real entrances are a three-minute walk apart. That is an interpretation error. The fictional map contains no footpaths, bridges, level changes, accessible entrances or travel speeds. The tutor should teach the difference rather than marking both errors simply as “wrong”.
An urban river makes this distinction intuitive. Two places can be close in a straight line while the nearest accessible bridge creates a longer route. URA describes promenades and bridges, but a general planning page cannot validate a specific route calculated on an invented grid.
For a fresh test, set scale 1:2,500 and a map distance of 3.6 centimetres. The represented ground separation is 90 metres. Ask the child to show all units and explain what a current real-world walking route would additionally require. A correct number plus a justified limitation shows the method has transferred.
Short, varied map problems are often more useful than repeatedly copying the first example. The aim is for the student to check the ratio and evidence boundary automatically.
A real warehouse measurement can teach why length, width and area differ
URA’s conservation account describes the paired two-storey buildings at 19 and 20 Merbau Road as each about 12 metres wide and 26 metres deep. These figures provide a rare opportunity to teach units without inventing the source measurements. If a classroom models one building as a perfect rectangle using those approximate dimensions, the illustrative footprint is 12 × 26 = 312 square metres. That is a calculation under a simplifying assumption, not an official surveyed gross floor area.
The word approximate matters. Real building shapes may include irregularities, walls, setbacks or other physical features. Multiplying exterior width and depth does not prove exact usable interior area. Also, the building has two storeys, but it would be wrong to double the footprint and automatically call the result its verified floor area without knowing the internal layout.
| Teaching question | Working | Evidence limit |
|---|---|---|
| Rectangular model footprint | 12 m × 26 m | 312 m² under the model |
| Perimeter of rectangle | 2 × (12 + 26) | 76 m under the model |
| Both identical model plots | 2 × 312 m² | 624 m² combined model footprint |
| Actual usable floor area | Not provided | Cannot establish |
A good learner distinguishes metres, measuring linear distances, from square metres, measuring area. If the child answers 312 metres rather than square metres, the multiplication is right but the unit is wrong. If they claim the 312 square metres represents visitor capacity, they have invented a different variable.
Give an unseen fictional warehouse of 10 metres by 24 metres and ask for both perimeter and area. The answers are 68 metres and 240 square metres. Then ask whether this proves how many people can occupy the building. It does not, because occupancy depends on other information and regulations.
The aim is to use a real historical source carefully while making every numerical modelling assumption explicit. That habit improves Geography and Mathematics at the same time.
One network has many links, and the fewest links need not be the shortest route
Robertson Quay sits within a river corridor whose promenade and bridges connect several quays. At Secondary 1, a simple network exercise can make this idea concrete. A station, crossing or public space can be a node; a path or bridge is a link. However, a diagram of links does not automatically reveal which route is fastest or most accessible. Length, timing and path conditions are separate questions.
Imagine a fictional graph from start S to destination D. Route S–A–D has lengths 80 and 70 metres; S–B–D has lengths 40 and 135; S–C–D has lengths 100 and 85. These are invented values, not measured waterfront paths. Compare the sum of labelled links, not which drawn line looks the neatest.
| Imagined route | Segment lengths | Total |
|---|---|---|
| S–A–D | 80 + 70 m | 150 m |
| S–B–D | 40 + 135 m | 175 m |
| S–C–D | 100 + 85 m | 185 m |
S–A–D is shortest by the specified fictitious distances. It is not automatically fastest for a wheelchair user, a young child or someone moving during an event. Such judgements would require actual route conditions and user needs. A shortest-distance statement should preserve the basis of its ranking.
Now change the second S–A–D link to 115 metres. That route becomes 195 metres and S–B–D at 175 metres becomes shortest. Ask the learner to explain why the result changed and how they would check the new winner. This builds a healthy willingness to revise conclusions when information changes.
A small group can divide roles for the first problem, but all students must complete a second route independently. The purpose is not to learn an actual Robertson Quay path from a fictional network, but to develop transferable map reasoning.
Swampy tidal land and godowns: the map can show change without proving every cause
URA records that upstream of Clarke Quay remained relatively undeveloped and swampy in the 1890s, before reclamation and an expanding trade economy supported a greater number of warehouses. By the early 1930s, warehouses extended through Robertson Quay, Havelock Road and Jiak Kim Street, with river boats transporting goods. This is an official description of changing human use and physical form over time.
A pupil should be able to say what the source documents without compressing it into the claim that “all of Singapore was swampland until 1930”. URA describes the specified upstream river area, not the whole island. The correct geographical unit and date are essential, even when a simplified historic map looks impressive.
A first-year lesson can draw two fictional land-cover diagrams: one with more tidal land and another with additional built plots. The student describes the mapped change, then asks which human activities the added warehouses might have served. General mechanisms such as access to river transport and storage of imported goods are consistent with the official account. Exact motivations for each building or measured ecological effects need other evidence.
The teacher should avoid treating the source as a present-day building-use register. A former godown may remain visible while its activity changes, and current URA guidelines identify residences, hotels and arts-related uses as well. Physical form and economic function are different observations.
This source comparison sets a foundation for Secondary 2. The student should learn that a new building use may appear on later maps even when part of the historic structure survives. The exact distinction matters more than a dramatic story.
The 2014 conservation date is not the construction date of every old warehouse
URA states that Robertson Quay Conservation Area was gazetted on 6 June 2014. This is the legal designation date recorded by the agency, not the construction date of every building in the area. Its profile also identifies warehouses at 17, 19 and 21 Jiak Kim Street built in 1919, and the dated 1921 facade at 63 Caseen Street. These dates refer to different kinds of events and different properties.
A common source-reading error is to write, “All Robertson Quay warehouses were built in 2014 because that is when they were conserved.” The correction is to distinguish construction from later protection. A source about the conservation area documents regulations and heritage values, while an individual building profile may document its earlier form and history.
A small timeline is a useful first-principles tool: 1890s swampy upstream area; 1919 selected warehouses; 1921 a particular facade; early 1930s broader warehouse development; 2014 conservation gazette. The dates should not be collapsed or applied indiscriminately across every site. A source can be authoritative but narrowly scoped.
Ask the student what preservation does and does not necessarily mean. An old facade may be kept while a new use occupies a building, subject to conservation permission. An official listing does not guarantee every business from 1919 is still operating today, or that the owner may change the structure without review.
The learner can then handle an unfamiliar historic district with its own construction and gazette years. If they keep the dates separate without hints, they have gained a transferable source skill rather than memorising one Robertson Quay fact.
A safeguarded promenade width is a planning rule, not a measurement of every walkway
URA’s Singapore River urban-design guidelines provide for a 15-metre-wide riverfront promenade incorporating footpath, cycling facilities, landscaping and amenities. These are design and safeguard requirements for relevant development, not a verified claim that every existing segment measures exactly 15 metres clear and unobstructed in October 2026. A source may describe planning intention or regulation without recording every completed condition.
At Secondary 1, the distinction can be taught through two diagrams. One shows a designated strip with a labelled total width and different illustrated functions; the other shows an actual measured path cross-section, if supplied. Students should not assume that a 15-metre planning figure is identical to the clear walking width left after planting and other facilities. The question must specify what is being measured.
A fictional example divides a 15-metre diagram into 5 metres of walking, 3 of cycling, 4 of landscaping and 3 of amenities. These allocations are entirely invented, not a URA design for any street. The totals add to 15, which is a useful check; however, the exercise does not establish that the real promenade has exactly those components.
| Illustrative function | Fictional width | Share of 15 m |
|---|---|---|
| Walking | 5 m | 33.3% |
| Cycling | 3 m | 20% |
| Landscaping | 4 m | 26.7% |
| Other amenities | 3 m | 20% |
Ask the pupil to explain why the total strip width differs from the walking portion in the diagram. If a parent asks whether a particular actual section is easily accessible, the answer requires current route information, not a classroom allocation of widths. Geographical precision prevents a planning rule from being transformed into misleading practical advice.
This simple problem builds careful unit handling and prepares learners for later evaluations of public space.
Worked imaginary footfall: the highest count is not always the highest rate
Imagine three invented Robertson Quay-themed sampling points with different observation durations. A has 36 hypothetical crossings in fifteen minutes, B has 52 in twenty, and C has 27 in ten. The numbers are fictional classroom data, not measured people at Robertson Quay. To compare fairly, calculate the crossing rate per ten minutes.
| Invented point | Crossings | Observation duration | Per 10 minutes |
|---|---|---|---|
| A | 36 | 15 min | 24 |
| B | 52 | 20 min | 26 |
| C | 27 | 10 min | 27 |
B has the largest raw count, but C has the highest rate: 27 crossings per ten minutes. For A, 36 ÷ 15 × 10 = 24. For B, 52 ÷ 20 × 10 = 26. The denominator is essential. A pupil who picks B because 52 is largest has ignored unequal sampling periods.
The same table does not establish that C is the most crowded walkway. Crowding would depend on space occupied, width, time and user movement. The table also does not identify tourists or unique people; one person crossing repeatedly could contribute several crossings. The student should state what was counted instead of renaming the variable.
For a new problem, replace B’s 52 with 60 in twenty minutes. Its rate becomes 30 per ten minutes and B becomes the highest. Ask the learner to revise the conclusion independently. Changing an answer in response to changed evidence is exactly what Geography should teach.
A three-learner tutorial can let one pupil check division, another units and another source limitations. Then each should complete a fresh table alone. Learning is individual even when the first example is shared.
Weekday or weekend: choose the slot that allows a second independent attempt
For a new Secondary 1 student, the family timetable can quickly fill with school lessons, CCA and homework. A weekday Geography class may help correct a freshly returned map error while the material is familiar, provided the child is alert. A weekend session may offer more rested discussion but can also squeeze out family time, sport and follow-up. No day is universally best.
| Parent observation | Weekday may work | Weekend may work | Evidence after two weeks |
|---|---|---|---|
| Map returned with an error | Fast correction while fresh | More patient reconstruction | Unseen map solved |
| Late CCA | Avoid that tired evening | Potentially better concentration | Accurate final work |
| Weekend already packed | Protect family recovery | Only with genuine free time | Return question completed |
| Child understands with tutor only | Next-day recall | Midweek retrieval | Independent method retained |
The useful teaching cycle includes identifying the first error, explaining the idea, practising with guidance, completing a different question alone and returning to it after a day or two. A beautifully completed model worksheet is not sufficient evidence that a new problem can be solved at school. Ask the tutor to specify the transfer task.
Compare the child’s alertness over a fortnight on two similarly demanding questions, taking commute, meals and sleep into account. One poor afternoon is only a clue; repeated patterns are more helpful for schedule decisions. A sustainable arrangement matters because Geography relies on attention and thoughtful explanation, not merely time seated in a class.
The best tuition may sometimes be no tuition if the learner already reads unfamiliar sources accurately and independently. Parents are entitled to a specific diagnosis before committing to repeated sessions. Adding hours without a clear skill gap is not automatically an improvement.
Confirm real tutor availability, venue, group size and fees; this local Robertson Quay guide does not imply an operating Geography classroom on the riverfront.
What happens inside an effective ninety-minute three-learner tutorial
A small group should let the teacher see each pupil’s reasoning. One might misread compass directions; another might calculate rates correctly but overstate their meaning; a third may need help turning observations into an explanation. The tutor can use a shared source for discussion, then offer differentiated practice and inspect each child’s independent writing.
| Illustrative minutes | Learning activity | Individual check |
|---|---|---|
| 10 | Recall a prior map skill | Response without notes |
| 20 | Diagnose a marked school answer | Exact unstable step identified |
| 20 | Guided new scale or map task | Concept explained clearly |
| 20 | Unseen individual problem | Prompt dependence recorded |
| 10 | Rotate source-challenge roles | Each learner defends a claim |
| 10 | Error log and short retrieval plan | Return task is clear |
The First Principles method repairs the missing concept before demanding an advanced answer. The Fencing Method keeps the conclusion inside the source’s scale, variable, time and boundaries. A model rectangle cannot supply a building’s certified floor area, and a planned promenade width cannot establish the clear width of every existing path. These are the kinds of small but important distinctions a thoughtful tutorial should teach.
Group learning should not allow the most vocal pupil to do every question. Rotate the roles of source reader, calculation checker and claim challenger. Each student must then solve a fresh map or table independently, with the teacher noting any hints. That is how group size translates into useful feedback.
Parents should confirm that a proposed maximum of three learners actually applies, and ask how the tutor handles differences in school units and ability. The eduKate Clementi Mathematics three-learner reference illustrates a teaching approach, not a guarantee of Robertson Quay Geography availability or venue.
A learner who needs fewer hints and can explain why an answer is bounded by the source has made a measurable educational gain. Completed pages alone are not a substitute.
Four-week Geography foundation plan: maps, measures and evidence
An initial month can focus on two or three recurring errors rather than attempting the entire subject at once. Start with the child’s current school unit and a real marked question. Week one could repair map symbols and geographical units. Week two could address scale and dimensions. Week three could develop fair rate comparisons and source limitations. Week four tests transfer to a different river or town.
| Week | Teaching focus | Independent evidence |
|---|---|---|
| 1 | Point, line, area and compass conventions | Accurate fresh map response |
| 2 | Scale, footprint model and units | New sums with correct labels |
| 3 | Rate comparison and observations versus plans | Fair denominator and bounded conclusion |
| 4 | Unfamiliar riverfront case | Response without prompts |
Keep an error log in simple words: north arrow ignored, hectares confused with square metres, actual walkway assumed from a planning rule, or sample count relabelled as tourists. These are teachable behaviours. Calling the learner weak at Geography without a specific example does not help anyone choose the next task.
Parents can help through short conversations: “What does this number measure?” and “How do you know this picture is of that location?” Let the child point to the source or its caption before supplying the answer. This encourages independence without adding another long lesson at home.
At the end of four weeks, compare two independent tasks requiring the same underlying skill but using different data. If the newer answer has fewer errors and less teacher prompting, tuition is serving a purpose. If progress is absent, adjust the instruction or schedule rather than simply add more identical worksheets.
A healthy timetable should preserve sleep, family routines and time for other subjects. Properly taught students grow less dependent on constant help as their methods stabilise.
Parent checklist, FAQs and the Robertson Quay Geography learning pathway
- Confirm the child’s current Secondary 1 Geography or Humanities school unit.
- Bring one marked map or source question showing a recurring error.
- Ask for an unfamiliar independent task after guided correction.
- Distinguish real Robertson Quay sources from downstream photo references and fictional tables.
- Check units, map scales, spatial boundaries and observation durations.
- Compare weekday/weekend CCA, commute, rest and retrieval time.
- Verify actual Geography teacher, genuine group size, venue, fees and subject availability.
Is Robertson Quay the same as the entire Singapore River? No. It is the upstream of three named quays within a larger river planning corridor. A claim about one conservation area should not be applied to every quay.
Were all Robertson Quay warehouses built in 2014? No. The conservation area was gazetted on 6 June 2014, while listed buildings have much earlier construction histories, including the Jiak Kim Street warehouses dating from 1919.
Does the 15-metre promenade guideline tell us every clear footpath is 15 metres wide? No. It is a design requirement for the riverfront promenade and includes multiple functions, not a measurement of clear walking width everywhere.
Are the grid and crossing figures observations at Robertson Quay? No. They are original fictional classroom worksheets. The photograph above is an explicitly labelled downstream Singapore River reference.
Does every Secondary 1 learner need Geography tuition? No. Support is most valuable when a real skill gap can be repaired and progress demonstrated independently.
Read Secondary 2 Robertson Quay Geography for dated urban change, Secondary 3 for riverfront enquiry and Secondary 4 for examination judgement.
Official sources: URA Robertson Quay Conservation Area · URA Singapore River urban design · URA Merbau Road warehouse · URA 320 Havelock Road · MOE lower-secondary Geography. All original calculations and sample figures identified as fictional are teaching exercises; any school fieldwork needs approved methods and safe supervision.
Families can contact eduKate Singapore with their child’s current schoolwork and realistic time windows. Confirm the actual teacher, group, location and fees. No Robertson Quay tuition branch or guaranteed mark is claimed. Properly taught kids shine a bright light into the future.