
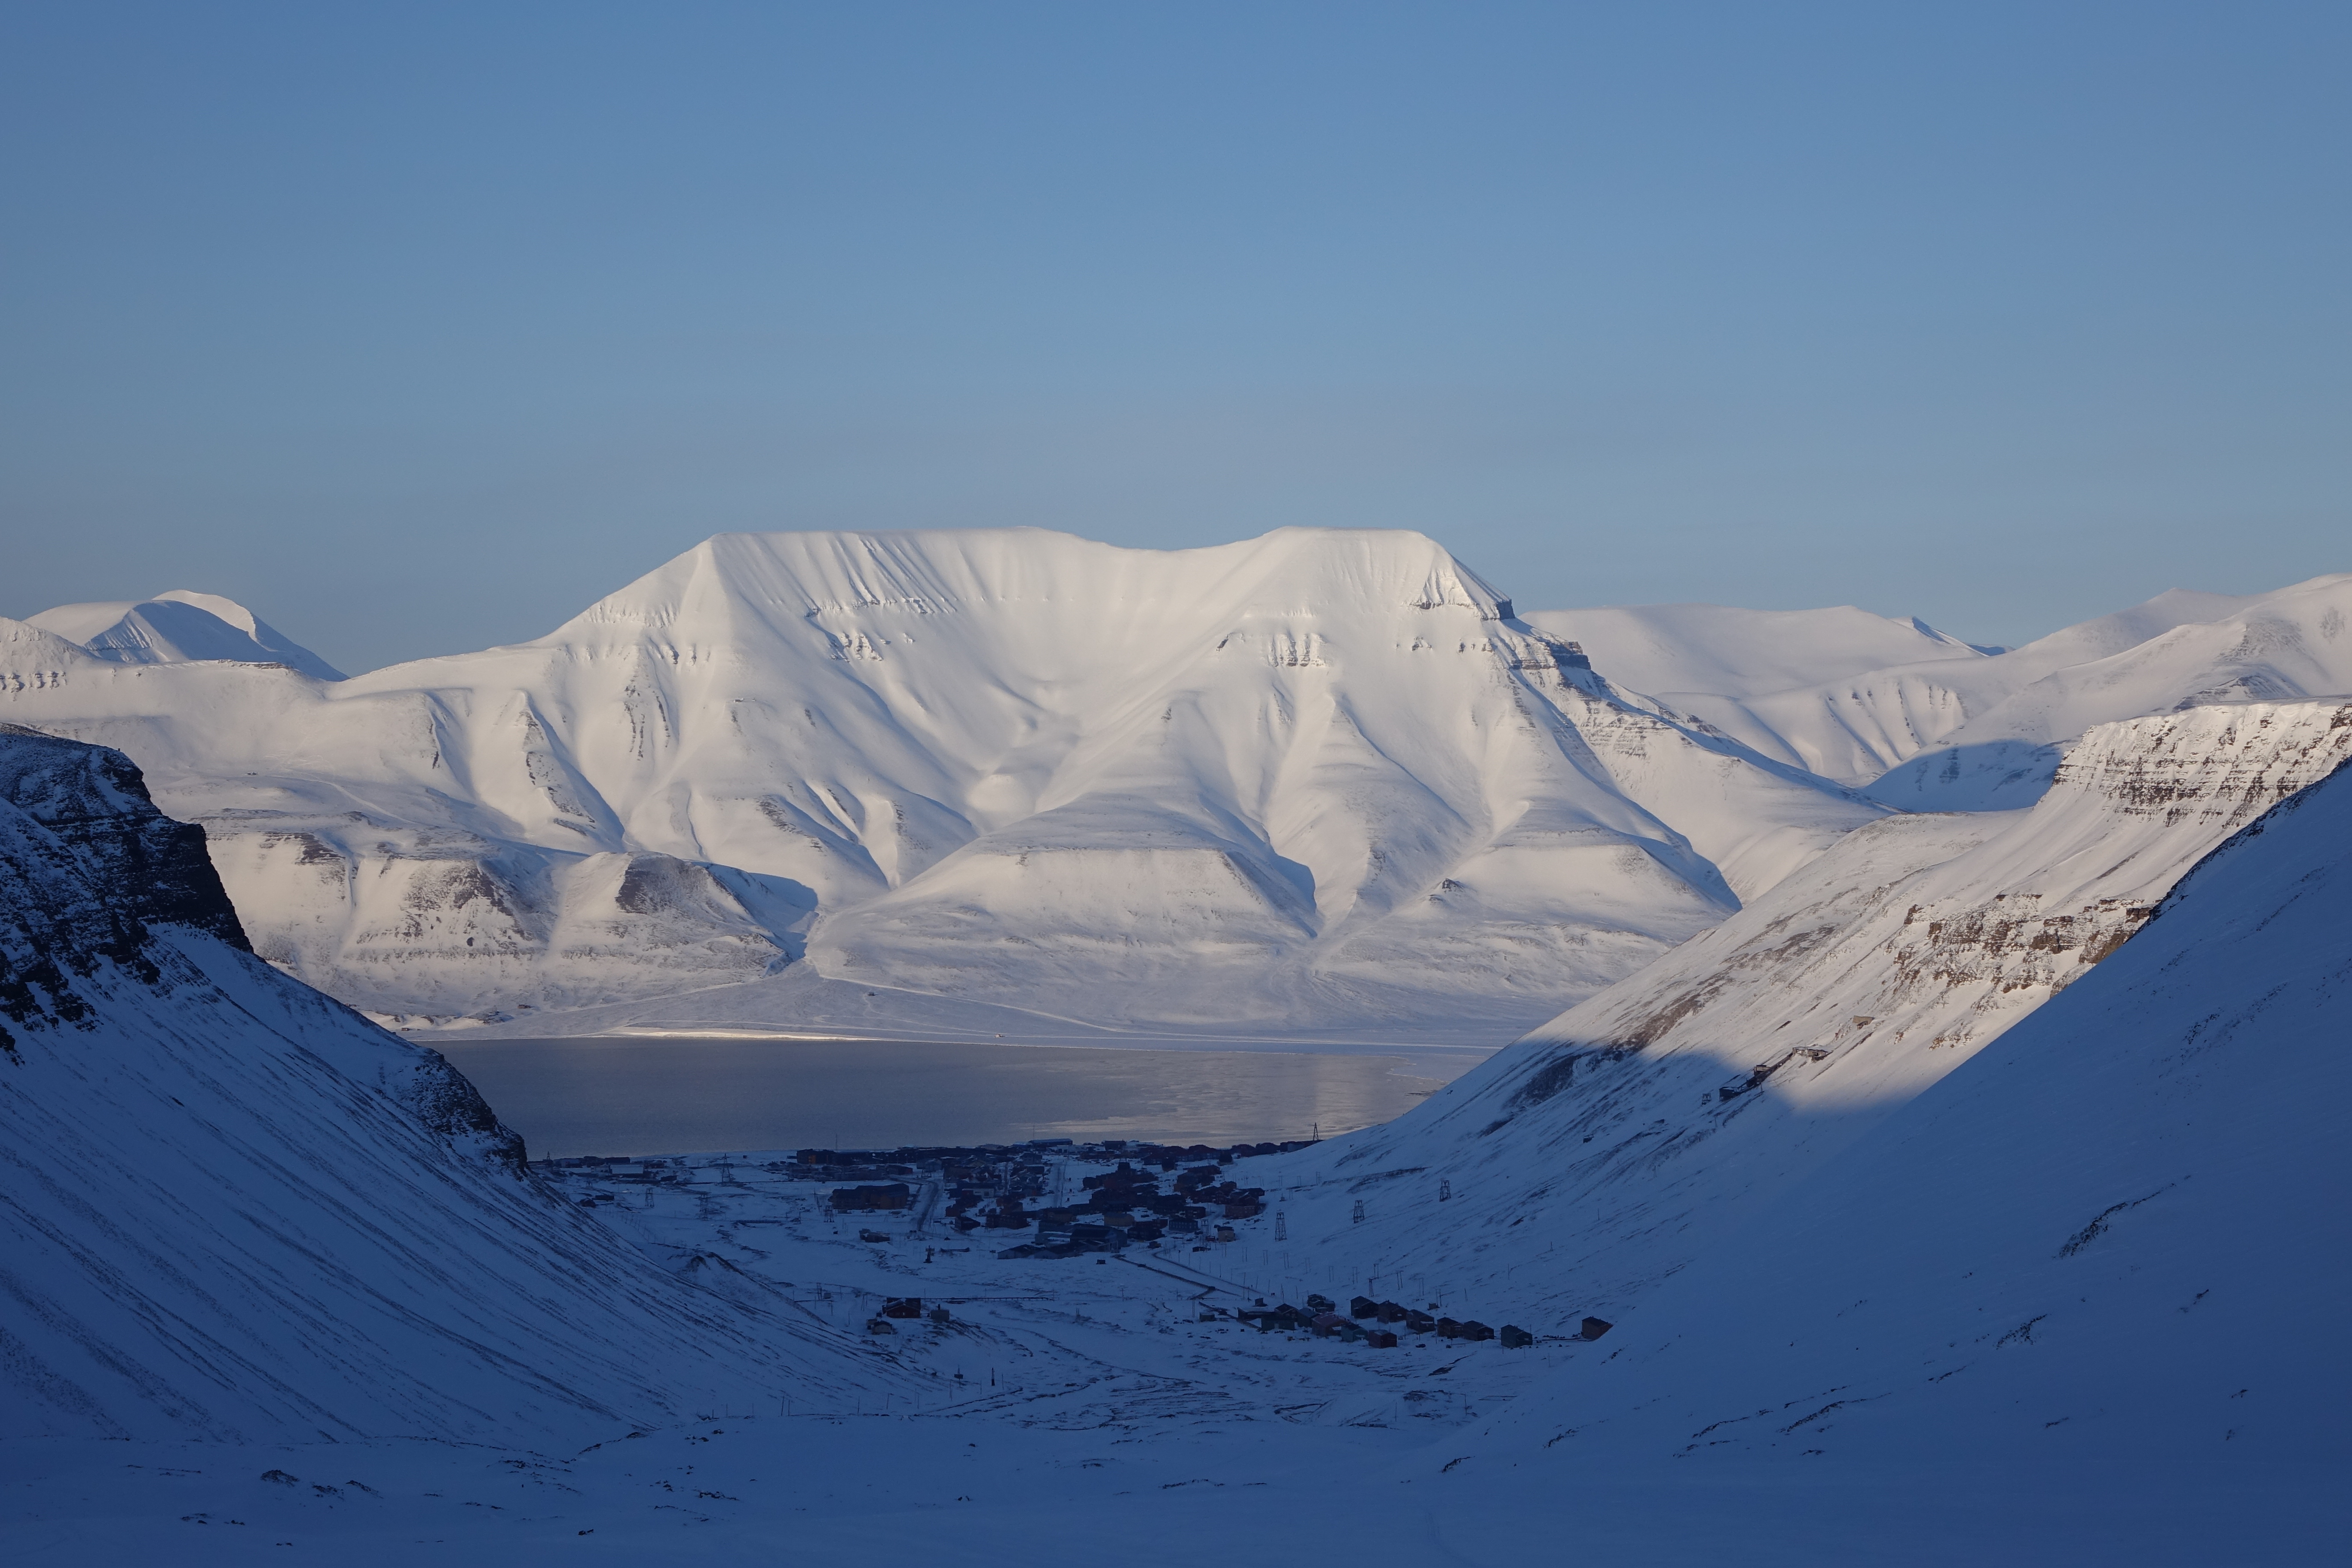
Cryosphere science studies Earth’s snow, ice and frozen ground as parts of a connected water and energy system. It asks where frozen water is stored, how it changes, what those changes mean and which observations can establish them. The gold standard is an explanation that keeps the physical material, the measured quantity and the consequence connected.
A photograph of a smaller white patch can begin an investigation, but it cannot finish one. Was the photograph taken in the same season? Does the white patch represent snow or glacier ice? Did the surface lose mass, become darker or move out of view? Cryosphere science turns those possibilities into questions that can be checked.
This root links the frozen components together. Glaciology remains the specialist route for glaciers and flowing ice. Atmospheric science explains weather and radiation; hydrology follows water through catchments; oceanography develops ocean processes. Here, readers learn how those subjects meet without treating every frozen system as the same kind of ice.
The calculations below use invented cases and stated approximations. They explain relationships, rather than estimate a current polar trend or certify a travel route. Their educational purpose follows The Gold Standard of Education: learning should remain usable when the photograph, units or setting change.
Find your next question
Begin with the route that fits your purpose. Read sequentially for the full argument, or use the chapter index to return to a worked example, an evidence check or a connected guide.
Full chapter index · Cryosphere Science: mechanism library · How X Works
Chapter index
Identify snow and ice · Chapters 1–4
Follow energy and ice movement · Chapters 5–7
Read sea ice and frozen ground · Chapters 8–10
Connect water and evidence · Chapters 11–14
Learn, check and continue · Chapters 15–19
CHAPTER 1 OF 19 · Identify snow and ice
1. Identify the frozen component before explaining its change
Snow, glacier ice, sea ice and frozen ground share connections through temperature and water, yet their formation, movement and consequences differ. A seasonal snow cover can disappear each summer. A glacier forms from accumulated snow and flows. Sea ice develops through the freezing of ocean water. Permafrost is defined through ground temperature and duration, rather than by the appearance of a white surface.
Begin with a classification that serves the question. If the concern is spring river flow, snow water storage and melt timing may be central. If it is sea-level contribution, distinguish grounded land ice from floating ice and identify how mass reaches the ocean. If the concern is ground stability, examine frozen-ground properties and thaw processes.
Ice shelves are floating extensions of ice systems and can influence the flow of the glaciers feeding them. They should not be conflated with sea ice merely because both float. Lake and river ice introduce other settings, with currents, water levels and seasonality affecting their behaviour.
The National Snow and Ice Data Center provides a useful entry map of these components. The map is a classification aid, not an invitation to assume that every component responds at the same rate to a warmer season.
For a learner, the first checkpoint is to label the material and its setting in a sentence: “This is seasonal snow on land,” or “This is floating ice formed from seawater.” Then state the quantity of interest. That short description prevents a surprising number of later errors, including attempts to interpret area as mass or frozen ground as a block of pure ice.
CHAPTER 2 OF 19 · Identify snow and ice
2. Temperature, energy and phase are different quantities
Temperature describes a thermal state. Energy transfer can change temperature, cause a phase change or contribute to several processes together. At the melting point under suitable pressure and composition, energy can melt ice without producing a corresponding rise in the temperature of the remaining ice–water mixture.
This distinction explains why a day with more energy input need not produce a simple proportional temperature increase. Some energy may melt snow, warm colder layers, evaporate water or be transferred elsewhere. A complete interpretation requires a budget rather than a single thermometer reading.
For a simplified case, use a latent heat of fusion of about 334,000 joules per kilogram for ice near its melting point. If 668,000 joules is available exclusively for melting, it can melt approximately two kilograms. If the ice starts well below its melting point, some energy first warms it, so the same input melts less. The starting state changes the answer.
Suppose a student doubles the mass of cold ice but keeps the energy input fixed. The outcome cannot be inferred by doubling a temperature rise from a previous experiment without considering phase change and heat capacity. The student must identify where the energy goes in the new case.
Salt changes freezing conditions, and pressure can also matter. For elementary calculations, explicitly use fresh ice near its melting point and ordinary pressure. The gold standard does not pile every complication into the first example. It introduces the simplest defensible model, then makes the conditions visible enough that the learner knows when another model is needed.
CHAPTER 3 OF 19 · Identify snow and ice
3. Snow depth does not tell you the stored water by itself
A deep layer of light new snow can contain less water than a shallower layer of dense, compacted snow. Snow water equivalent expresses the depth of water obtained if the snowpack melts, subject to the defined measurement. It connects a visible depth with the mass of water stored over an area.
For a uniform pack, water-equivalent depth equals snow depth multiplied by snow density divided by water density. Take an invented snowpack 0.50 metres deep with mean density 200 kilograms per cubic metre. Using water density of 1,000 kilograms per cubic metre gives 0.50 × 200 ÷ 1,000 = 0.10 metres of water, or 100 millimetres.
Spread over 1,000 square metres, that represents 100 cubic metres of water before losses or redistribution. The volume comes from water-equivalent depth multiplied by area. Calling the original 0.50-metre snow depth “500 millimetres of water” would overestimate the storage fivefold in this example.
Now compact the same snow without adding or removing water. Depth decreases while mean density increases; total water equivalent remains the same. A smaller snow depth therefore does not automatically establish that meltwater has left the system. This changed-context check exposes the difference between geometry and mass.
A real pack has layers with different densities, liquid-water contents and temperatures. Representative sampling or an appropriate remote-sensing product is needed to estimate the total. A single surface photograph cannot reveal all of those properties. Students should learn the simple relationship and the reason that measuring the inputs responsibly is harder than performing the arithmetic.
CHAPTER 4 OF 19 · Identify snow and ice
4. A snowpack changes internally as well as at its surface
Snow is a porous material whose structure evolves after it falls. Grain changes, compaction, wind redistribution, melt and refreezing alter properties important to water storage, insulation and movement. A snowpack is therefore not a passive pile whose only meaningful change is becoming deeper or shallower.
Fresh snowfall can add a low-density layer above an older, denser pack. Wind can remove snow from an exposed ridge and deposit it elsewhere. Meltwater can move through the pores, refreeze in colder layers or leave as runoff. Each process changes a different part of the accounting.
Consider two fictional observation sites. Both receive the same snowfall, but one is sheltered and the other exposed to wind. A later difference in depth may reflect redistribution rather than a difference in precipitation. The explanation must follow the snow after it arrives, not assume that the depth gauge is a direct precipitation total.
The connected snow-crystal guide explains how growth conditions affect crystal form. That mechanism is a useful starting point, but a crystal’s initial shape does not by itself determine the later properties of a whole snowpack. Conditions after deposition continue to matter.
For a classroom exercise, compare a sequence of supplied depth, density and water-equivalent measurements. Ask which changes could be explained by compaction alone and which require water entering or leaving. This is safer and more informative than attempting a field stability judgement from a school model. Snow science can explain why structure matters while recognising that avalanche assessment requires specialist methods, local evidence and professional training.
CHAPTER 5 OF 19 · Follow energy and ice movement
5. Surface brightness changes an energy budget
Albedo is the fraction of incoming shortwave radiation reflected by a surface. A brighter surface can reflect more sunlight, reducing the shortwave energy absorbed under the specified conditions. Snow and ice properties vary, so a single albedo value cannot describe every frozen surface.
Use an invented surface receiving 300 watts per square metre of sunlight. At albedo 0.8, it reflects 240 and absorbs 60 watts per square metre. At albedo 0.5, it reflects 150 and absorbs 150. The difference in absorbed shortwave energy is 90 watts per square metre, provided the incoming radiation and other conditions are held fixed.
If every joule of that additional energy went to melting ice already at its melting point for one hour, the idealised extra melt would be 90 × 3,600 ÷ 334,000 ≈ 0.97 kilograms per square metre. That is a deliberately restricted upper accounting exercise. Actual surface energy includes infrared exchange, turbulent transfers, heat storage and changing conditions.
The feedback idea follows from the mechanism: melting can expose a darker surface, which may absorb more sunlight and favour further melt. The strength of that feedback depends on the setting. Clouds, season, snow cover and the material exposed all influence the response.
Ask a learner what would happen during polar night. A calculation based on incoming sunlight cannot be transferred unchanged to an interval without sunlight. The physical relationship remains useful because its input changes appropriately. A memorised claim that darker surfaces always receive a fixed extra amount of heat does not survive the changed condition.
CHAPTER 6 OF 19 · Follow energy and ice movement
6. Glaciers require both a mass budget and an account of flow
A glacier gains mass through processes including snowfall and loses mass through processes such as meltwater runoff, sublimation and ice discharge. It also transports ice internally. The glacier’s surface and terminus respond to the combined budget and flow, sometimes with a delay.
For an invented glacier over a defined year, accumulation adds 12 mass units, runoff removes 8, sublimation removes 1 and discharge removes 5. Net mass change is 12 − 8 − 1 − 5 = −2 units. The glacier loses mass even though snowfall was substantial. Snowfall alone cannot establish a positive balance.
Boundary definitions matter. If a surface mass-balance estimate already includes snowfall, melt and sublimation, adding those same components again double-counts them. A report of total mass change and a report of surface mass balance can differ legitimately because discharge enters the broader accounting.
Flow also means that a particle of ice can move downhill while the glacier terminus retreats uphill. The terminus is a boundary, not a painted mark attached to one ice particle. Confusing material movement with boundary movement makes retreat seem physically impossible when it is not.
The Gold Standard of Glaciology provides the deeper route into ice deformation, basal conditions and glacier observations. This root uses that specialist knowledge to connect glaciers with snow storage, atmosphere and oceans. For an evidence check, ask whether a claim is based on terminus position, surface height, volume or mass. Those measurements are related, but none should silently replace the others.
CHAPTER 7 OF 19 · Follow energy and ice movement
7. Ice sheets and ice shelves connect land with the ocean
Ice sheets store large masses of ice on land and move under gravity. Where flowing ice reaches an ocean margin, it can form a floating shelf. The grounding zone separates ice supported by the bed from ice that is floating. The location and behaviour of that transition are central to many ice-sheet questions.
An ice shelf can resist or buttress the flow of ice upstream. Changes to the shelf can therefore alter discharge of grounded ice. This is why the statement “floating ice has little direct sea-level effect” does not establish that an ice shelf is unimportant. Direct displacement and influence on upstream flow are different mechanisms.
NSIDC’s ice-shelf resources explain this distinction. Avoid turning it into a universal claim that any shelf loss produces the same acceleration everywhere. Shelf geometry, contact with margins, grounding conditions and ocean influences affect the response.
Imagine a fictional ice system whose surface balance is unchanged but whose discharge increases from 4 to 7 mass units per year after a change at its ocean boundary. The additional loss is 3 units per year under the stated bookkeeping. A climate explanation that considers only snowfall and surface temperature misses the changed discharge term.
For teaching, sketch three boundaries in words: the ice surface, the grounding zone and the ocean contact. Then assign each proposed process to the boundary it affects. This turns a dramatic image into a tractable physical problem. Professional interpretation requires observations and models appropriate to the geometry; a classroom diagram supplies a reasoning framework, rather than an operational prediction of collapse.
CHAPTER 8 OF 19 · Read sea ice and frozen ground
8. Sea ice concentration, area, extent and volume answer different questions
Sea ice concentration describes the fraction of a surface region covered by ice. Area weights each region by its ice-covered fraction. Extent counts the full area of cells meeting a specified concentration threshold. Volume additionally requires thickness information. A change in one quantity cannot automatically be described as the same proportional change in another.
NSIDC’s Sea Ice Index uses a 15% concentration threshold for extent. A reader should check the definition of the particular product, including its treatment of grid cells, land and missing data. Definitions are part of the measurement, rather than decorative notes after the graph.
Consider three invented 100-square-kilometre cells with concentrations of 20%, 60% and 90%. All exceed 15%, so their extent is 300 square kilometres. Their ice-covered area is 20 + 60 + 90 = 170 square kilometres in this simplified grid. The equal-thickness assumption would still be needed to infer volume from area.
Now reduce the first concentration from 20% to 16%. Extent remains 300, while area falls to 166. The unchanged extent does not prove unchanged ice conditions. If concentration falls below the threshold, the full cell stops contributing to extent, even though some ice can remain.
For changed-context practice, use another threshold and calculate again. The physical surface is identical; the summary changes because the rule changes. This does not make extent meaningless. It means comparisons require a consistent product and definition. The same discipline applies to many environmental indicators based on threshold categories.
CHAPTER 9 OF 19 · Read sea ice and frozen ground
9. Sea ice growth involves both heat and salt
Ocean water generally freezes at a lower temperature than fresh water because of its dissolved salts. During sea ice formation, much of the salt is excluded from the growing ice into the surrounding water, while brine can remain within the ice structure. Sea ice is therefore not simply a perfectly fresh, solid lid placed on the ocean.
Growth requires the removal of energy, and its rate depends on the surface and ocean conditions. Existing snow and ice affect heat transfer. Winds and currents can move the ice, opening leads or compressing it into ridges. Thickness patterns therefore reflect deformation and transport as well as local freezing and melting.
Imagine two regions with similar surface air temperature. One receives substantial heat from the ocean below; the other does not. Equal air temperatures do not require equal ice growth. A complete energy account includes the lower boundary and the insulating layers, not only the weather above.
The connection with oceanography is important: freezing and melting can alter local salinity and buoyancy, while ocean circulation transports heat toward or away from the ice. The strength and consequences of those interactions depend on the setting. They should not be reduced to a rule that every freezing event triggers the same large-scale circulation response.
Students can use a supplied energy-budget comparison to identify the missing heat source. They should also distinguish scientific explanation from ice-travel advice. Concentration or thickness in a regional data product does not establish that a particular route is safe. Local fractures, currents and rapidly changing conditions require a very different evidence standard.
CHAPTER 10 OF 19 · Read sea ice and frozen ground
10. Permafrost is a temperature condition with material consequences
Permafrost is ground that remains at or below 0°C for at least two consecutive years. The definition concerns temperature and persistence. It does not require the ground to be pure ice, and different permafrost materials contain very different amounts of ground ice.
The active layer above permafrost can thaw seasonally and refreeze. An increase in seasonal thaw depth is not identical to the complete loss of the permafrost beneath it. Distinguish a layer’s seasonal behaviour from a long-term change in the deeper thermal state.
Where ice-rich ground thaws, melting ground ice can change support, drainage and surface shape. The consequence depends on ice content and material structure. A temperature record alone cannot specify settlement without information about the ground. Conversely, a visible surface change needs investigation before it is assigned exclusively to permafrost thaw.
Frozen ground also connects with carbon processes. Thaw can expose previously frozen organic matter to conditions that permit decomposition, with outcomes dependent on temperature, moisture and oxygen. A stock of soil carbon is not the same thing as an immediate emission of that entire stock. Rates and pathways matter.
For a fictional monitoring exercise, compare three borehole records with surface observations. Ask which meets the two-year temperature definition, which shows seasonal freezing only and which cannot be classified because the record is too short. This teaches a precise use of definitions. It also explains why one warm afternoon or one frozen surface photograph is insufficient evidence for the state of a deeper ground system.
CHAPTER 11 OF 19 · Connect water and evidence
11. Sea-level reasoning starts with where the water was stored
Adding water from grounded land ice to the ocean changes ocean mass. Melting floating ice involves a different starting displacement. The familiar floating-ice demonstration is useful for that direct distinction, but real sea-level change also involves seawater density, ocean heating, circulation, gravity and land movement.
For a clean teaching calculation, imagine that 100 billion kilograms of land ice melt and reach an ocean represented by a fixed area of 4 × 10¹⁴ square metres. Using freshwater density of 1,000 kilograms per cubic metre, the added volume is 1 × 10⁸ cubic metres. Spread uniformly, the depth change is 2.5 × 10⁻⁷ metres, or 0.00025 millimetres.
The small result follows from the chosen mass. If the mass were 100 trillion kilograms instead, the model result would be 0.25 millimetres. Checking prefixes and powers of ten matters as much as remembering the physical mechanism. Neither number is a report of an observed annual ice loss.
This uniform-layer model explains mass-to-depth conversion; it does not predict sea level at a named coast. Local relative sea level is the height of the sea compared with local land and can differ from a global mean. The fixed-area assumption and omitted processes must remain attached to the calculation.
For transfer practice, ask why a floating ice-shelf change may still matter even though the simple direct-displacement example differs from grounded ice. A good answer returns to its influence on upstream ice flow, rather than abandoning the original distinction.
CHAPTER 12 OF 19 · Connect water and evidence
12. Frozen water changes the timing of river supply
Seasonal snow and ice store water and release it later. A catchment can therefore receive precipitation in one season and substantial runoff in another. The timing of release matters to ecosystems, water supply and flood conditions, even when the annual total appears similar.
For an invented catchment, suppose 120 water units fall as snow. Twenty leave through sublimation or other specified losses, and 100 remain available for later release. If 60 are released during one spring month and 40 during the following month, the two-month total is 100. Changing the split to 80 and 20 preserves that total but changes the timing significantly.
Do not equate earlier melt with an equal increase in total annual water supply. Some water simply arrives sooner. Changes in rainfall, evaporation, soil storage and glacier mass can further alter the annual balance. The relevant question must specify whether it concerns volume, peak flow, timing or reliability.
A glacier losing mass can temporarily contribute additional water by drawing down stored ice. That contribution is not a renewable gain that can continue indefinitely under the same conditions. Distinguish the annual transfer from the remaining stock, just as one distinguishes spending from a bank account from a recurring income.
Hydrology provides the deeper route for catchment storage, routing and runoff. For a practical evidence check, compare rainfall, snow water equivalent and river discharge over consistent periods. A river peak cannot be assigned to snowmelt merely because mountains are visible upstream. The mechanism must be supported by timing, weather and the relevant catchment observations.
CHAPTER 13 OF 19 · Connect water and evidence
13. Measurement methods reveal different aspects of change
Field stakes, snow sampling, boreholes, aerial surveys and satellite instruments answer different questions. Surface elevation can be estimated from altimetry; changes in gravity can inform mass estimates; images can map boundaries and surface conditions. Each approach requires processing, assumptions and uncertainty estimates.
A lowering ice surface does not automatically equal the same thickness of melted solid ice. Snow compaction, firn changes, ice motion and bed geometry can affect the interpretation. A mass estimate derived from height change needs a suitable density model and an account of relevant processes.
Consider a fictional surface that lowers by 0.20 metres while its material compacts without losing water. Height changes, but mass does not. Another surface can lose mass through melt and runoff. Similar-looking elevation changes can therefore require different explanations.
Time coverage is equally important. Comparing a late-winter maximum with a late-summer minimum mixes seasonal change with any longer-term trend. Repeated observations at comparable seasonal points help, but weather variability and method changes still need attention. A longer record can support questions that a pair of photographs cannot.
Ask learners to produce a measurement note with five elements: the variable, spatial coverage, period, method and principal uncertainty. Then ask whether another independent method supports the same conclusion. Agreement strengthens an interpretation when the methods have meaningfully different limitations. Repeating the same processed product in several charts is not the same thing as obtaining several independent lines of evidence.
CHAPTER 14 OF 19 · Connect water and evidence
14. Explain uncertainty before turning a trend into a story
A trend is an estimated pattern across a defined record. Its interpretation depends on the period, variability, measurement consistency and the model used to summarise it. A straight line through noisy data can be useful, but it is not a guarantee that the same rate will persist forever.
Separate uncertainty about a measurement from uncertainty about future conditions. Better calibration may improve an estimate of current snow depth; it does not remove uncertainty about next month’s weather. Similarly, a well-measured ice boundary does not determine every process controlling its future movement.
In an invented series, a glacier’s mass changes by −2, +1, −3, −1 and −5 units over five years. The total is −10 and the mean annual change is −2. One positive year does not negate the net loss. The average, however, does not tell us the exact change in the sixth year.
Avoid converting this reasoning into a rhetorical trick. If the question concerns a particular year’s hazard or water supply, that year’s deviation matters. If it concerns a long-term storage trend, a broader record is needed. Both scales can be important without being interchangeable.
The practical skill is to preserve a conclusion’s level of confidence and scope when explaining it to another person. “This dataset estimates a decline across this interval” carries more information than an exaggerated claim of certainty or a dismissal that everything is uncertain. Useful uncertainty tells the reader which comparison is robust and which additional evidence could alter the interpretation.
CHAPTER 15 OF 19 · Learn, check and continue
15. Learning routes from observation to professional practice
Young learners can begin by distinguishing ice, liquid water and invisible water vapour, then observing melting under safe, supervised conditions. The goal is to describe what changes and record a comparison fairly. A household melting experiment can reveal an energy relationship while remaining a very limited model of a glacier.
At secondary level, connect density, pressure, energy, graphs, ratios and mass conservation. Ask the learner to calculate snow water equivalent, explain an unchanged extent with a changed area, and distinguish a flow rate from a stored amount. These are substantive scientific capabilities, rather than vocabulary recognition alone.
Advanced learning adds continuum mechanics, heat transfer, remote sensing, statistics, geophysics and numerical modelling. Professional work also requires instrument methods, site knowledge, data stewardship and collaboration with communities affected by frozen-ground and water changes. A calculation in this guide does not replace those responsibilities.
Teach by changing one condition at a time. Start with uniform snow density, then introduce layers. Begin with a fixed-area water budget, then consider a changing boundary. Compare a floating-ice demonstration with grounded ice entering water. Ask which relationship survives and which assumption must be replaced.
Progress appears when a learner challenges an unsuitable proxy, preserves unit conversions and requests the missing metadata. An error record can distinguish confusion about material, boundary, density, season or rate. That makes revision purposeful. The next lesson repairs the actual connection rather than asking the learner to memorise the same diagram more intensely.
CHAPTER 16 OF 19 · Learn, check and continue
16. Independent checks with explained answers
| Quantity | Evidence needed | What it does not establish alone |
|---|---|---|
| Snow water equivalent | Depth and representative density or a validated product. | Timing of river runoff. |
| Sea ice extent | Defined concentration threshold and grid. | Ice thickness or volume. |
| Glacier mass change | Consistent mass accounting and relevant methods. | The exact movement of the terminus. |
| Permafrost | Ground-temperature history over the defined duration. | A universal ground-ice content. |
Check one: snow 0.40 metres deep has uniform density 250 kilograms per cubic metre. Water equivalent is 0.40 × 250 ÷ 1,000 = 0.10 metres, or 100 millimetres. If depth halves through compaction alone, the density must double to preserve that water storage under the ideal assumptions.
Check two: a fictional ice system gains 15 mass units and loses 11 through surface processes plus 6 through discharge. Total change is −2. Snowfall does not establish growth because the loss terms exceed the gain. Check that no loss is already included in another reported net quantity.
Check three: two 100-square-kilometre cells have concentrations 40% and 80%, both above the stated extent threshold. Extent is 200 square kilometres; area is 120. If the concentrations become 50% and 70%, the same simplified extent and area remain, but the spatial distribution changes. A summary can conceal rearrangement.
Check four: ground is measured below freezing for one year. The record alone does not establish the two-consecutive-year permafrost definition. It may be part of a longer frozen period, but that requires additional evidence. Absence of sufficient evidence is different from proof that permafrost is absent.
Check five: an ice shelf loses floating mass and a nearby glacier speeds up. A complete explanation considers both the direct floating-ice accounting and the changed discharge of grounded ice. The two mechanisms need separate observations. Connecting them carefully is stronger than treating every loss of white surface as an identical contribution to sea level.
Is cryosphere science just another name for glaciology?
Glaciology develops the specialist understanding of glaciers and ice. Cryosphere science connects that work with seasonal snow, sea ice, frozen ground, climate and water systems. This guide connects the frozen components, while the Glaciology guide develops glacier mechanics and measurement in greater depth.
Does more snow mean a glacier is gaining mass?
Not necessarily. The complete budget includes losses and, where relevant, discharge. Snowfall can increase during an interval in which the system still loses mass. Identify the region, period and meaning of the reported balance before comparing figures.
Is sea ice extent a measure of thickness?
No. Extent uses a concentration threshold over grid cells. Thickness requires other observations, and volume combines geometry with thickness. A large extent can include relatively thin ice; an unchanged extent can conceal changes within the counted cells.
Can frozen-ground photographs show permafrost loss?
They can document surface changes that merit investigation. Establishing the thermal state and its change needs appropriate records and interpretation of the material. A picture alone does not supply the temperature-duration definition or the subsurface ice content.
What should a reader take into everyday life?
Ask whether a claim concerns a stock, a rate, a boundary or a threshold summary. Then check the season, density assumptions and measurement method. These habits help interpret water supplies, environmental graphs and many claims beyond frozen landscapes.
Choose a route by the question you want to answer. These connected guides develop the specialist mechanisms and adjacent subjects; they are companions to this explanation rather than substitutes for checking a particular real-world case.
Identify the frozen component
How Science Works | Cryosphere Science — Snow, Glaciers, Ice Sheets, Sea Ice, Permafrost and the Frozen Earth — Use the full existing subject library for the frozen Earth and its interactions.
How Science Works | Why Snowflakes Grow into Different Shapes — Examine how conditions shape snow-crystal growth.
How Science Works | Earth Science — Deep Time, Rocks, Climate, Oceans and a Dynamic Planet — Place frozen systems within the wider Earth-system account.
Follow water, energy and movement
How Science Works | Hydrology — Rainfall, Catchments, Rivers, Groundwater, Floods and the Movement of Water — Trace storage, runoff and catchment timing.
How Science Works | Atmospheric Science — Radiation, Weather, Circulation, Clouds, Climate and Prediction — Connect weather, radiation and moisture with freezing and melting.
How Science Works | Oceanography — Seawater, Currents, Waves, Chemistry, Ecosystems and the Seafloor — Follow ocean heat, salinity and circulation around ice.
How Science Works | Geophysics — Seismic Waves, Gravity, Magnetism, Deformation and the Hidden Earth — Explore the physical measurements and subsurface structure used to investigate Earth.
Read the frozen record
Why Science? | Ice Cores, Trapped Air and Past-Climate Evidence — Distinguish trapped air and other ice-core evidence from a direct view of past climate.
How Science Works | Paleoclimatology — Proxies, Ice Cores, Sediments, Tree Rings and Reconstructing Past Climate — Compare ice records with other proxies and their uncertainty.
Continue across Gold Standard subjects
The Gold Standard of Glaciology provides the connected glaciology perspective.
The Gold Standard of Hydrology provides the connected hydrology perspective.
The Gold Standard of Oceanography provides the connected oceanography perspective.
The Gold Standard of Climate provides the connected climate perspective.
The Gold Standard of Thermodynamics provides the connected thermodynamics perspective.
The Gold Standard of Water Security provides the connected water security perspective.
The Gold Standard of Geophysics provides the connected geophysics perspective.
For the wider collection, return to How X Works and How Science Works.
These primary institutional and research sources were checked on 21 October 2026. They support the scientific framing and specialist references; the numerical cases, teaching sequence and interpretation checklists are original educational examples.
NSIDC: parts of the cryosphere — Identify distinct frozen systems and their connections.
NSIDC: science of snow — Snow structure and snow water equivalent.
NSIDC: why snow matters — Albedo and snow’s role in energy and water systems.
NSIDC: science of sea ice — The distinction among concentration, area and extent and the threshold definition.
NSIDC: permafrost-region definition — The temperature-duration condition and the seasonally changing layer.
NSIDC: why ice shelves matter — The influence of floating shelves on the flow of grounded ice.
NSIDC: the Airborne Snow Observatory research paper — Measurement methods linking snow depth, albedo and water-equivalent estimates.
Return to the source appropriate to the specific measurement, method and context before using a classroom model to make a professional decision. Where the article states a conditional example, its conclusion depends on the assumptions explicitly given with it.
Contents · Previous chapter · Continue into the subject mechanisms