
Make the inference visible before trusting it
Several species may support the same ecological function, yet resilience depends on whether those contributors respond differently when conditions change.
Functional redundancy describes overlap among species in their contributions to a specified ecological function. Response diversity describes variation in how contributors to that function respond to environmental change. Together they can support an insurance-like argument: if one contributor declines, another may maintain the process. That argument is conditional on traits, abundance, scale, disturbance and the function being measured.
Frame the claimROUTE 02 · CHAPTERS 4–6
Work the evidenceROUTE 03 · CHAPTERS 7–9
Test transferROUTE 04 · CHAPTERS 10–12
Audit and continue
Open the chapter contents · Visit the Ecology root
Chapter contents
01 · Frame the claim
02 · Work the evidence
03 · Test transfer
Species are never redundant in every respect. Two grazers may remove similar algae but differ in nutrient transport, habitat use or value to predators. Begin with a focal function, place, time window and environmental range: for example, pollination of an orchard during spring heat events or grazing that limits algal dominance on a reef. Then identify evidence connecting organisms and traits to that function. “Functional redundancy” without a named process risks treating different lives as interchangeable merely because a classification placed them in the same group.
Effect traits influence how an organism contributes to an ecological process, such as body size, feeding mode or flowering depth. Response traits influence how it reacts to stress or change, such as heat tolerance, drought sensitivity, dispersal or phenological plasticity. One trait can serve both roles, but the distinction keeps the logic clear. Redundancy is assessed in relation to effect on the focal function; response diversity asks whether apparently similar contributors react differently to a driver. Using only effect traits can make a group look insured when all its members share the same vulnerability.
| Trait role | Question | Example |
|---|---|---|
| Effect trait | How does the species shape function? | Flower visitation rate |
| Response trait | How does it react to change? | Heat tolerance |
| Both | Does one trait affect both paths? | Body size |
Grouping species by guild, cluster or position in trait space is a model. Thresholds, trait selection, scaling, abundance weighting and missing-data treatment decide which species look similar. Broad groups can manufacture redundancy; narrow groups can remove it. Where possible, use measured rates or mechanistic traits rather than labels inherited from another ecosystem. Show within-group variation and alternative classifications. A defensible analysis explains why members can compensate for one another in the process of interest, not merely why they share a convenient name.
A backup species cannot stabilise a function if it is too rare, absent when needed or unable to increase activity after another declines. Presence-only measures may overstate insurance by giving a scarce species the same weight as a dominant contributor. Record abundance, biomass, interaction frequency or process rates when relevant, and consider whether density dependence permits compensation. At the same time, current dominance is not destiny: a low-abundance species may become important after conditions shift. Report both capacity and realised contribution rather than forcing them into one number.
| Evidence | What it adds | Caution |
|---|---|---|
| Presence | Potential contributor | May be too rare |
| Abundance | Current capacity | Can change after disturbance |
| Process rate | Realised contribution | Context-specific |
Response diversity is always diversity of response to something. Heat, drought, fire, harvest and nutrient enrichment can reorder the same community in different ways. The metric also depends on whether response is measured immediately, across seasons or over recovery years. Specify the driver, intensity, duration and response variable. Correlated declines among contributors signal little response diversity for that disturbance even if their average tolerances differ. Opposite responses can stabilise an aggregate, but only if timing and magnitude overlap enough to maintain the function.
6. Worked example: three pollinators during a heat event
Three pollinator species visit the same crop and contribute similarly under mild weather. Species A and B are abundant but both sharply reduce activity above 34°C; species C is less common and remains active through the heat. Effect overlap suggests redundancy. If C can increase visitation when A and B decline, the group has useful response diversity and crop pollination may be buffered. If C is too scarce, nests outside the flight range or visits a different flowering time, nominal response diversity does not maintain the function. The worked conclusion therefore reports contribution, heat response, phenology and capacity to compensate rather than counting three interchangeable species.
Asynchronous or opposing responses can reduce variability in an aggregate process, much as a diversified portfolio can buffer loss. But stable totals may also arise from environmental constancy, one dominant resistant species or averaging across space. Conversely, variable composition can accompany stable function. Test the proposed pathway: disturbance changes contributors differently, compensatory dynamics occur, and the focal process is maintained or recovers. Distinguish resistance, recovery rate, temporal stability and persistence. “Resilience” should identify which property was observed rather than stand in for every desirable outcome.
| Stability property | Meaning | Required evidence |
|---|---|---|
| Resistance | Small initial change | Before and during disturbance |
| Recovery | Return after change | Post-event time series |
| Temporal stability | Low variation through time | Repeated process measures |
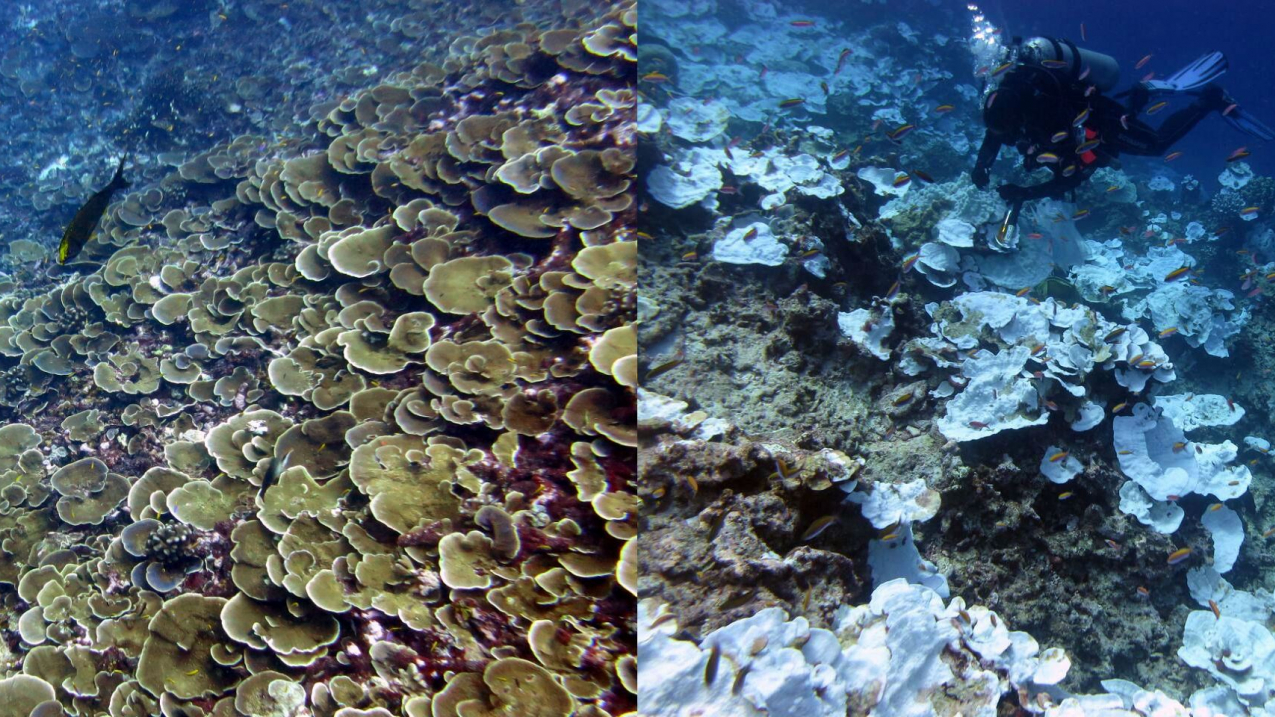
On a coral reef, several fishes and an urchin may all consume algae. A simple feeding-guild count suggests redundancy. After a cyclone, however, habitat structure changes, fishing pressure differs among species and the urchin responds to disease rather than shelter in the same way as fishes. The transferable method is to retain the focal function—algal removal—while rebuilding effect and response evidence for the new disturbance and scale. Functional substitutes in a tank experiment may not compensate across a reef if movement, harvest or microhabitat limits where they act.
Local redundancy can be low while regional insurance remains high if dispersal replenishes contributors; the reverse occurs when sites share the same climate sensitivity and fail together. Seasonal turnover may stabilise annual function even when no species overlap at one moment. Choose grain and extent to match the mechanism, and do not average away local collapses that matter to management. Repeated measurements are needed to observe compensation and recovery. A one-time trait table can generate hypotheses about resilience, but it cannot demonstrate dynamic buffering on its own.
Redundancy does not mean species loss is harmless. Species can carry unique functions not measured, provide future options under novel conditions or support cultural and evolutionary values outside the focal metric. Response diversity can also create trade-offs: a tolerant species may maintain one process while altering another. Trait databases may miss intraspecific variation, plasticity and local adaptation. Avoid claiming that high functional overlap guarantees resilience or that low overlap proves fragility. State the domain of inference and the functions deliberately left outside it.
Publish species and abundance data, effect and response traits with sources and units, missingness, scaling, grouping rules, disturbance definition, process measurements and temporal window. Recalculate with alternative trait sets, group thresholds and abundance transformations. Test whether results rely on one dominant species, one imputed trait or one unusual event. Compare predicted compensation with observed process dynamics where possible. The audit should reveal whether resilience was measured, inferred from response diversity or merely assumed from species counts.
| Audit step | Retain | Sensitivity |
|---|---|---|
| Trait model | Variables, units and sources | Alternative trait sets |
| Grouping | Distance and thresholds | Alternative classifications |
| Dynamics | Abundance and process time series | Remove dominant species |
12. The gold standard tests the backup mechanism
Functional redundancy becomes ecologically useful when multiple contributors can actually support a named process, and response diversity becomes protective when those contributors differ in their reactions to a relevant disturbance. The gold standard links traits to mechanisms, abundance to capacity, responses to time and stability to observed function. It treats insurance as a testable chain, not a comforting label. That makes both conservation priorities and uncertainty clearer: protect complementary responses without pretending any species is simply spare.
Contents · Previous chapter · Ecology root · Return to Ecology
Continue through verified routes
Core route
- Ecology: subject root and specialist index
- The Gold Standard of Education: learning transfers into life
- The Gold Standard: eduKate Singapore
- How X Works: systems and first-principles hub
Specialist route
- Functional diversity, trait imputation and distance metrics
- Dark diversity, species pools and absent-but-suitable species
- Same richness, different species and evenness
- Spatial grain, extent and scale-dependent patterns
- Biotic homogenisation, beta diversity and turnover loss