
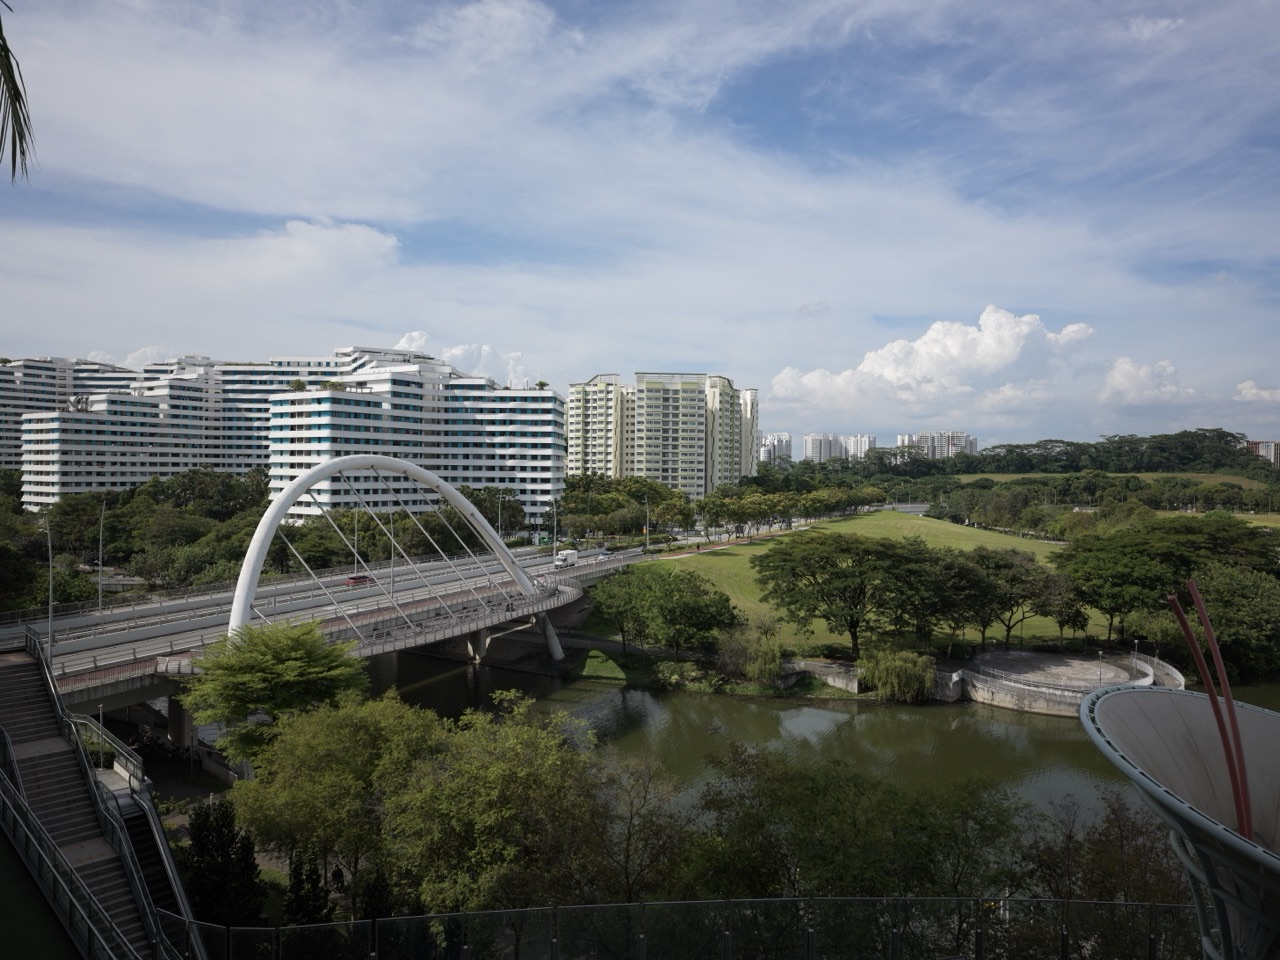
The gold standard of geomorphology is an explanation of landscape change that connects landform, material, process and time to defensible evidence. A useful account shows what changed, how it was measured, which processes could explain it and what remains uncertain. It also recognises that a landscape has a history: today’s shape may preserve conditions that no longer operate in the same way.
Geomorphology studies the formation and development of landforms at Earth’s surface. Hillslopes, river channels, floodplains, beaches, dunes and glacial valleys provide different records of movement, erosion and accumulation. Rock properties, water, climate, gravity, organisms and human activity interact across different scales. A landform name begins an investigation; it does not complete the explanation.
This root guide connects the existing eduKate articles on physical geography, geology, rivers, hydrology, surveying, coastal systems, restoration and teaching. It follows a landscape investigation from a question through observation, measurement and interpretation. Fictional sediment and shoreline examples show how a correct calculation can still require careful limits on its meaning.
eduKate · Geomorphology
Find the part you need
Choose a reading route or expand a chapter-index group. All eighteen teaching chapters stay open below, with Contents, Previous and Next links for moving through the complete guide.
Full chapter index · Connected articles · Learning that transfers into life
Chapter index
Read the landscape · Chapters 1–4
Follow the moving material · Chapters 5–8
Build an evidence-based explanation · Chapters 9–12
Connect change to decisions · Chapters 13–16
Teach and extend the subject · Chapters 17–18
A landform is a feature of the surface, such as a valley, terrace, dune or channel. A process is an activity that creates, modifies or removes material. Geomorphological explanation connects the two while asking when the relevant activity occurred and what evidence survives.
A river terrace, for example, is a visible form. Explaining it requires investigation of its materials, position and relationship to other features. Naming the terrace does not by itself establish a date, cause or complete sequence of events.
USGS’s Geomorphology and Sediment Studies overview introduces the study of landform formation and evolution. The central practical habit is to distinguish description from explanation. Record what can be observed before deciding which process history best accounts for it.
The Physical Geography root places landforms within a wider study of Earth-surface environments. This dedicated subject root follows the movement of materials and the changing shape of the surface in greater detail. A strong explanation remains open to revision when a new deposit, measurement or chronological constraint changes the picture.
Begin with the materials, structures and surrounding conditions. Rock and sediment properties influence how a surface responds to water, loading and other processes. Fractures, layering, relief and drainage relationships can matter alongside climate and vegetation.
Distinguish a regional expectation from a local observation. A geological map can guide an investigation, but the exact condition at a site may need checking. A similar-looking slope elsewhere is a comparison, not proof that the same process operates here.
Build a conceptual sketch showing the main sources of material, pathways and receiving areas. Identify the relevant boundaries: an entire catchment, a short channel reach or a section of coast. The boundary should suit the question and the evidence available.
The Geology and Geologists guides develop the material and field context. Ask what the setting makes plausible and which observations would challenge that first interpretation. Keeping those questions separate prevents a background map from becoming an untested explanation of every feature in the landscape.
CHAPTER 3 OF 18 · Read the landscape
3. Distinguish weathering, erosion, transport and deposition
Weathering breaks down or alters rock in place. Erosion removes material, transport moves it, and deposition adds it to a location. These processes are connected, but the distinctions help explain where material comes from and what happens to it.
The National Park Service’s Weathering guide distinguishes mechanical breakdown from chemical alteration. Its erosion overview connects moving material with water, wind, ice and other processes.
A weathered surface does not automatically show that its products have left the site. A deposit does not automatically identify the exact source of its grains. Investigate the material, pathway and timing before joining those observations into one story.
For a fictional hillside, loose fragments at the foot of a rock face suggest material movement. The next questions concern their source, transport mechanism and age. Repeated observation or suitable additional evidence may distinguish a recent event from an older accumulation. Use the vocabulary to organise investigation rather than to assign a complete cause from one photograph.
CHAPTER 4 OF 18 · Read the landscape
4. Choose the relevant spatial and temporal scales
Landscapes change through individual events and longer sequences. A storm can move material within hours, while a valley can reflect a much longer history. A short observation period may capture an unusual episode or miss the events responsible for most of the visible change.
Spatial scale matters too. A bank can erode while a downstream bar grows. A local beach can accumulate sediment while another part of the connected coast loses it. The conclusion depends on which area is included and which transfers cross its boundary.
State the observation interval and the scale of the question. Are you describing a single event, an average over several years or an inherited landform? Do not present a rate calculated over one interval as a permanent property of the place.
A useful exercise compares a close-up photograph, a reach map and a catchment map. Ask which relationships become visible at each scale and which disappear. The Cartography branch helps readers examine scale and representation. A complete explanation often moves between scales while preserving the limits of each source.
A dated image can constrain a sequence without dating every part of a landform. Suppose a fictional survey shows a clearly defined bank before a change and a comparable later survey shows its new position. The change occurred within that interval if the comparison is valid. An earlier map that lacks enough detail to show the bank cannot supply the same constraint. State why the records are comparable before using their dates as a boundary.
CHAPTER 5 OF 18 · Follow the moving material
5. Investigate hillslopes and material movement
Hillslopes connect weathering, water movement, gravity and the transfer of material to lower ground. Different mechanisms can produce movement at different speeds and depths. The shape of a slope alone does not provide a complete assessment of its condition.
Describe the evidence carefully: exposed material, deposits, drainage patterns, changes in surface level or features visible across repeated records. Keep a distinction between an observed feature and a proposed mechanism. Cracks or displaced material require appropriate specialist interpretation when safety is involved.
Consider where moved material goes. It may remain on a lower slope, enter a channel or be redistributed again. A deposit at the foot of a slope can temporarily store material rather than mark the end of its journey.
The Geotechnical Engineering branch addresses engineering responsibilities around ground behaviour. Geomorphology contributes an understanding of process and landscape history. An educational interpretation or remote image is not a site-safety clearance. Field observation must follow the permissions, access arrangements and competent assessment appropriate to the location.
CHAPTER 6 OF 18 · Follow the moving material
6. Read rivers as connected sediment systems
Rivers erode, transport and deposit material while their channels and floodplains change. The National Park Service’s River Systems and Fluvial Landforms overview describes that relationship between moving water, sediment and landforms.
Separate water discharge from sediment movement. A water measurement does not alone establish how much material is being transported or how a channel will change. Sediment supply, grain properties, vegetation, channel geometry and the sequence of flows can all matter.
A bend, bar or floodplain deposit should be read in relation to the wider reach and catchment. Erosion in one location may supply material elsewhere, while storage can delay the connection. A snapshot can reveal form without capturing the events that built it.
The Rivers, Hydrology and Hydraulics roots develop complementary questions about rivers, water movement and flow behaviour. Use the distinctions to ask what evidence each field contributes. A river intervention needs an account of material and channel response as well as the immediate movement of water.
CHAPTER 7 OF 18 · Follow the moving material
7. Understand coasts through connected processes
Coasts combine waves, currents, water levels, sediment supply, geology and human interventions. Beaches, cliffs and other landforms can respond differently across events and longer periods. The National Park Service’s Beaches and Coastal Landforms guide introduces those erosional and depositional settings.
Look beyond the visible beach. Material may move alongshore, across the shore and between connected stores. NPS’s coastal sediment-transport overview explains why the source and movement of sediment belong in the account.
A changed waterline in two photographs is not automatically a measured shoreline trend. Water level, waves, the shoreline indicator, viewpoint and survey alignment can affect the comparison. Define what is being measured before assigning a rate.
The Coastal Engineering and Coastal Ecosystem Restoration guides connect physical processes to interventions and living environments. Ask which parts of the coast are connected and whether a local change could affect conditions elsewhere. The relevant boundary may extend beyond the immediate project frontage.
CHAPTER 8 OF 18 · Follow the moving material
8. Recognise the roles of ice and wind
Glaciers can erode, carry and deposit material, leaving landforms that remain after the ice has gone. NPS’s Glaciers and Glacial Landforms guide explains the connection between moving ice and features such as glacial valleys and deposits.
Wind also moves sediment and shapes landforms. Its effects depend on available material, surface conditions, vegetation and the wind regime. The Aeolian Landforms guide describes wind-driven erosion, transport and deposition across several environments.
These processes can interact with water and later landscape changes. A landform may preserve evidence from a past climate while being modified by present processes. Avoid treating every visible feature as a direct record of current conditions.
Compare a proposed process with the material and geometry it would need to produce. Then identify what additional evidence could distinguish it from another explanation. This keeps the topic connected to the subject’s wider method: recognise a form, examine its materials and setting, reconstruct a plausible history, and state where the reconstruction remains uncertain.
CHAPTER 9 OF 18 · Build an evidence-based explanation
9. Build a sediment budget with stated boundaries
A sediment budget accounts for material entering, leaving and being stored within a defined system over a stated interval. It makes connections visible and can reveal missing information. Use consistent mass or volume units, and do not combine them without a justified conversion.
Suppose a fictional reach receives 12,000 tonnes during one year and exports 8,000 tonnes. If those are all the relevant transfers, storage increases by 4,000 tonnes. The result is a conditional account. Unmeasured bank inputs, extraction or another pathway would change it.
| Budget term | Fictional annual value | Interpretation |
|---|---|---|
| Material entering | 12,000 tonnes | Specified inputs across the boundary |
| Material leaving | 8,000 tonnes | Specified outputs across the boundary |
| Storage change | 4,000 tonnes increase | Input minus output under the stated assumptions |
USGS’s sediment-budget and coastal-process discussion notes the importance of limited data and uncertainty. A budget is strongest when it shows which terms were measured, estimated or omitted. A balanced-looking total does not verify every pathway or locate the stored material.
The residual also needs interpretation. If the input estimate later changes from 12,000 to 10,000 tonnes while the output estimate stays at 8,000, the inferred storage increase becomes 2,000 tonnes. Neither result identifies where deposition occurred. Comparing the account with mapped changes can reveal whether the proposed explanation is physically plausible or whether an important term remains missing.
CHAPTER 10 OF 18 · Build an evidence-based explanation
10. Measure landscape change consistently
Evidence can include field observations, maps, photographs, repeated surveys, elevation models and material records. Each represents a particular scale, date and method. Before comparing them, establish whether their positions, elevations and feature definitions are compatible.
An apparent elevation difference can arise from a changed reference system or processing method. A line on an old map may represent a different feature from the line traced in a modern survey. Record the coordinate system, vertical reference, dates, resolution and relevant uncertainty.
Preserve the original data and explain the processing used to make a comparison. A finer display grid does not automatically add new information to a coarser measurement. Separate observed coverage from interpolation across gaps.
The Surveying Engineering branch develops position and level responsibilities, while Geophysical Engineering connects physical measurements to subsurface interpretation. Combine methods when they address different uncertainties, while keeping clear what each method actually measured.
Consider a second fictional calculation: a 1,200-square-metre area has a measured mean surface rise of 0.20 metres between compatible surveys. Area multiplied by mean rise gives an estimated volume increase of 240 cubic metres. It is a volume estimate, not a mass. Converting it to tonnes requires appropriate density information. Vegetation, surface-water conditions, survey alignment and measurement uncertainty must also be examined before interpreting the difference as deposited sediment.
CHAPTER 11 OF 18 · Build an evidence-based explanation
11. Test competing explanations of the same form
Similar forms can arise through different histories, and several processes can modify the same feature. An investigation should compare plausible explanations rather than adopt the first familiar pattern.
For a fictional channel that has widened, consider what evidence would distinguish a change in flow regime, altered sediment supply, direct works or a sequence involving several causes. Timing, material records, upstream changes and repeated cross-sections may contribute different constraints.
Correlation is a starting point for investigation. A change observed after vegetation clearance does not by itself identify the size of that change’s contribution or exclude another event. State the proposed mechanism and the observations it should help explain.
Use an evidence table or field notebook to record the claim, supporting observations, alternatives and next question. The Research and Data Literacy roots develop that distinction between an observation and a causal explanation. A useful conclusion can be narrower than the original question when the available evidence cannot separate the competing causes.
Write a prediction for each candidate explanation before choosing one. If a change is attributed to material introduced from upstream, ask what distribution and composition would be consistent with that pathway. If direct excavation is proposed, seek records and field evidence appropriate to the claimed works. A plausible mechanism helps organise the search; the search must still be able to produce evidence that weakens it.
CHAPTER 12 OF 18 · Build an evidence-based explanation
12. Work through a shoreline-rate example
Consider a fictional transect measured from a fixed inland origin, with distance increasing seaward. The same defined shoreline indicator is recorded at 100 metres in Year 0, 97 metres in Year 5 and 95 metres in Year 10. Assume for the arithmetic that the records are correctly aligned and comparable.
Over ten years, the indicator moves 95 − 100 = −5 metres. The average signed change is −0.5 metres per year, representing landward movement under the stated convention. Over the first five years the rate is −0.6 metres per year; over the second five it is −0.4.
| Interval | Position change | Average signed rate |
|---|---|---|
| Year 0 to Year 5 | −3 m | −0.6 m/year |
| Year 5 to Year 10 | −2 m | −0.4 m/year |
| Year 0 to Year 10 | −5 m | −0.5 m/year |
The calculation does not show steady annual retreat, a single cause or the future rate. Measurement uncertainty also matters. USGS’s historical shoreline-change assessment explains why shoreline definitions and quantified uncertainty need attention. A responsible account reports both the arithmetic and the conditions required for the comparison to mean what it claims.
CHAPTER 13 OF 18 · Connect change to decisions
13. Consider thresholds, lags and inherited forms
A landscape response may be delayed or uneven. Material can accumulate before an event redistributes it. A change in water or sediment supply may appear first in one part of a system and later elsewhere. A period of little visible change does not establish that the system cannot respond.
Threshold language needs care. State which process or condition is being discussed and how it could be examined. Do not invent a universal threshold from one site’s observations or treat a simplified classroom model as a design criterion.
Inherited features add another layer. A valley, terrace or deposit may preserve earlier conditions while present processes operate within it. The current form can therefore constrain modern behaviour without having been created entirely by that behaviour.
NPS’s river-system monitoring discussion connects process, spatial scale and change over time. The practical question is which observation interval and location could reveal the expected response. Design monitoring around the proposed mechanism, including the possibility that the important event occurs outside a convenient survey schedule.
CHAPTER 14 OF 18 · Connect change to decisions
14. Connect landforms with soils and living systems
Landforms influence where water and material accumulate, while vegetation and organisms can affect surface conditions and sediment movement. These relationships connect physical processes with habitat and soils. Their importance varies by setting and needs to be investigated at the relevant scale.
A restored channel might look more varied while its material pathways remain unstable. A planted area might change some surface conditions without resolving another source of sediment. Evaluate the stated physical and ecological objectives separately, then examine how they interact.
USGS’s work on riparian vegetation and fluvial processes provides a research reference for those connections. It should not be converted into a universal planting prescription for every river.
The River Restoration Engineering branch develops the responsibilities behind interventions and evidence of recovery. A geomorphological contribution asks how form, material and process are changing and whether the interpretation is consistent with the wider system. A living landscape requires evidence over time, alongside an account of what the project was intended to achieve.
CHAPTER 15 OF 18 · Connect change to decisions
15. Recognise people as part of landscape change
Channels, shorelines and slopes can be modified by excavation, filling, drainage, dams, roads, extraction and other activities. These changes can alter material sources, pathways, storage and the conditions driving movement.
An engineered waterway remains a landscape system with material and water moving through it. Its visible form may reflect design and maintenance as well as the processes acting today. Ask which parts are constructed, which are inherited and which have changed since the works.
Use records of interventions carefully. A proposal drawing does not automatically show what was built, and an old plan may omit later maintenance. Check relevant dates and distinguish intended configuration from observed condition.
The Dam Safety Engineering, Flood Risk Engineering and Water Resources Engineering guides connect physical evidence to practical responsibilities. An intervention should be examined within its connected system and over an appropriate period. Moving a problem beyond the immediate study area does not make its consequences disappear.
CHAPTER 16 OF 18 · Connect change to decisions
16. Report evidence for an accountable decision
A useful report identifies the question, setting, sources, methods, observation period and results. It distinguishes mapped features, measured changes, interpreted processes and recommendations. Readers should be able to trace a consequential conclusion to the evidence supporting it.
Include units, legends, reference systems, dates and the effective coverage of the investigation. Show important gaps and explain how uncertainty affects the decision. A smooth map or single rate should not conceal variation among locations or intervals.
| Output | What it represents | Essential qualification |
|---|---|---|
| Mapped landform | A feature identified using stated evidence | Definition, scale and observation date |
| Measured difference | Change between compatible observations | Reference systems, uncertainty and coverage |
| Process interpretation | An explanation of how change occurred | Supporting evidence and competing causes |
| Management scenario | A conditional account of a possible intervention | Assumptions, boundaries and verification needs |
Describe what would change the interpretation. Further measurements, a newly identified intervention or a better chronological constraint may alter the explanation. State which follow-up observation would resolve the most relevant uncertainty.
Keep a usable handover of data, processing, field notes and relevant limitations. The Geologists guide connects interpretation with professional accountability. Geomorphological quality appears when the next reader can distinguish a supported conclusion from a scenario, a possibility or an unanswered question, and can understand the scope of the proposed next step.
CHAPTER 17 OF 18 · Teach and extend the subject
17. Teach landscape reasoning that transfers
Begin with an observable landscape question. Ask students to describe a photograph or map before naming the process. Then ask what evidence would help distinguish their first explanation from another plausible one.
Use the fictional sediment budget and shoreline example to connect arithmetic with physical meaning. Students should explain the boundary, units, sign convention and observation interval. A correct division is only part of a defensible conclusion.
The Teaching Geography and Teaching Earth Science branches develop related skills. The fuller Secondary 1 Mathematics Tutor Clementi guide provides a reference for diagnosis, explanation, guided practice and independent application.
Following learning that transfers into life, give students an unfamiliar pair of images taken under different conditions. Ask whether a rate can be calculated meaningfully and which information is missing. Strong work recognises both a usable relationship and a limit. A learner who asks about scale, dates and measurement compatibility is beginning to think beyond the appearance of the landform.
A field notebook can use four short entries for each feature: observation, proposed explanation, alternative and next useful evidence. Students should record safe, permitted observations from suitable locations. The assessment can then examine the quality of the reasoning even when a single visit cannot settle the landform’s history. Return to the initial claim after the new evidence and ask the learner to identify exactly what changed.
What is the gold standard of geomorphology?
An evidence-based explanation connecting landform, material, process and time, with appropriate measurements, alternative explanations and explicit uncertainty.
How does geomorphology relate to geology and geography?
It focuses on landforms and surface change while drawing on geological materials and history and the wider environmental relationships studied in geography.
Are weathering and erosion the same process?
No. Weathering breaks down or alters material in place. Erosion removes it; transport and deposition describe further parts of its movement and accumulation.
Does an eroding riverbank mean the whole river is losing sediment?
Not necessarily. Material can move into downstream storage or across the chosen system boundary. A wider sediment account is needed.
Can two beach photographs establish an erosion rate?
Only if the compared feature, dates, scale, position and conditions support a meaningful measurement. A changed visible waterline can have several explanations.
Does an average historical rate predict next year’s change?
No. An interval average summarises the stated observations. Events, changing conditions and uncertainty need separate analysis before making a forecast.
Can this guide determine whether a slope or coast is safe?
No. It explains subject reasoning. Real safety, design and management decisions require the relevant site evidence and competent assessment.
Where can I explore the applications?
The connections below lead to physical geography, geology, rivers, water, surveying, restoration, coastal systems, engineering and teaching.
Connected articles across the eduKate ecosystem
The Earth-surface setting
These roots connect landforms to the wider physical environment, Earth materials and the representation of space.
Rivers, water and changing channels
Use these guides to connect water movement with sediment pathways, channel form and evidence of restoration.
- Rivers
- Hydrology
- Hydraulics
- River Restoration Engineering | Living Channels and Verifiable Recovery
- Water Resources Engineering | From Catchment to Community
Coasts and connected living environments
These branches develop coastal processes, protection and ecological restoration, where local interventions must be understood within a wider system.
- Coastal Engineering | Connected Defences and Adaptable Shorelines
- Coastal Protection
- Coastal Ecosystem Restoration
Measurement, ground evidence and engineering decisions
These specialists contribute different kinds of evidence and responsibility when landscape interpretation informs a consequential decision.
- Surveying Engineering | Boundaries, Levels and As-Built Truth
- Geologists | Rock Records, Ground Truth and Defensible Interpretation
- Geophysical Engineering | Subsurface Evidence with Known Limits
- Geotechnical Engineering | Ground Uncertainty Managed Before It Moves
- Flood Risk Engineering | Catchments, Exposure and Resilient Decisions
- Dam Safety Engineering | Evidence for Safe Reservoirs
Teaching and checking an explanation
Continue here for the learning progression from maps, observations and measurements to a defensible explanation that can be applied in an unfamiliar setting.
- Teaching Geography | From Maps to Evidence-Based Decisions
- Teaching Earth Science | Read Rocks, Time and Earth Systems
- Data Literacy
- Research
- Education | Learning That Transfers into Life
- Secondary 1 Mathematics Tutor Clementi | Small Groups Tutorials
Sources and scope
USGS’s Geomorphology and Sediment Studies provides a subject overview. NPS guides cover weathering, fluvial landforms, coastal landforms, glacial landforms and aeolian landforms.
USGS’s sediment-budget discussion and historical shoreline-change assessment support the treatment of boundaries, measurement and uncertainty. NPS’s fluvial monitoring guidance and USGS’s riparian-process research provide further methodological context.
All numerical values, transects, reaches and site scenarios are fictional teaching examples. They are not measurements of the featured waterway or a real site’s sediment balance, erosion rate, future change or safety.
“Gold standard” describes the educational benchmark explained in this guide. It is not an official accreditation or certification.
Back to contents · Explore the Gold Standard article directory