
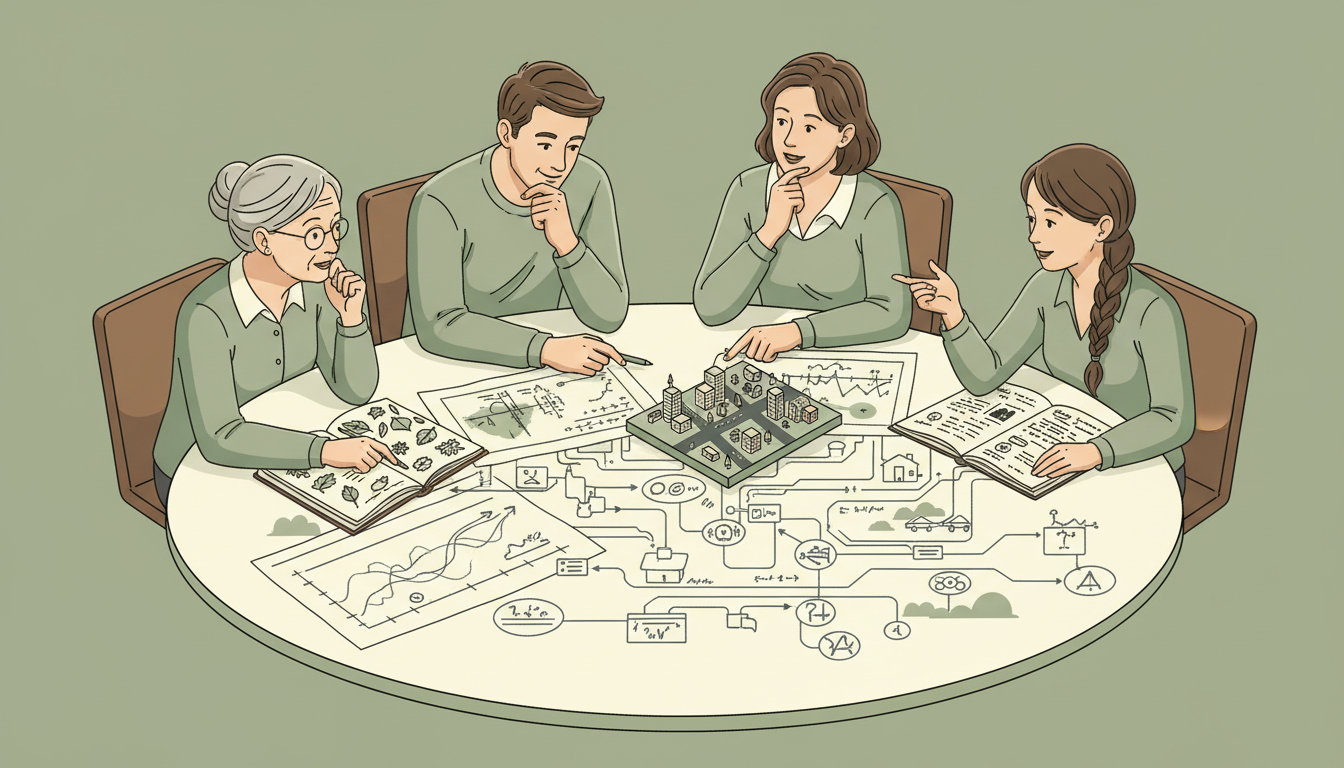
Interdisciplinary research begins when one discipline cannot fully answer a question and another contributes more than an extra appendix. It integrates methods, concepts and evidence into an explanation that can be tested. Real integration changes a research decision: who is studied, what is measured, which alternative explanation is credible or what response is appropriate.
This ten-chapter guide follows a joint investigation from problem definition through sampling, collaboration, weighted examples, contradictory evidence and research ethics. It links the subject into the existing eduKate knowledge network while keeping measurements and causal interpretations distinct.
THE GOLD STANDARD · INTERDISCIPLINARY RESEARCH
Integrate knowledge rather than stack disciplines
Ten connected chapters · Worked household-exposure example · Ethics and research practice
Chapter index
Frame the research · Chapters 1–2
Build compatible methods · Chapters 3–4
Build shared evidence · Chapters 5–6
Interpret together · Chapters 7–8
Practise and connect · Chapters 9–10
CHAPTER 1 OF 10 · Frame the research
1. Define integration rather than simply collecting disciplines
Back to contentsInterdisciplinary research draws knowledge, methods or concepts from more than one discipline and integrates them to answer a question that a single field cannot address adequately. The National Academies’ Facilitating Interdisciplinary Research explains why integration and synthesis, rather than the mere presence of several experts, matter. A report containing an engineering chapter, a sociology chapter and an economics chapter may be multidisciplinary but remains weakly interdisciplinary if none of the findings change the shared explanation.
Imagine a city asking why residents remain dangerously hot indoors despite public cooling campaigns. Building science can measure heat transfer, public health can analyse vulnerability, geography can examine land cover, and anthropology can investigate residents’ lived constraints. Integration happens when these findings jointly determine which mechanisms are plausible and what intervention would actually be usable.
The gold standard begins by naming the problem and the additional understanding that integration should produce. Teams need a common research question and an explicit account of why each form of expertise is necessary. Interdisciplinary work is not automatically superior to disciplinary research; it is justified when the nature of the question requires it.
Field task: Explain what would be lost if one participating discipline were removed. If the answer is nothing, reconsider whether the proposed work is integrated.
CHAPTER 2 OF 10 · Frame the research
2. Turn a societal question into a testable research design
Back to contentsBroad questions such as ‘How can cities become more resilient?’ have to be reduced into specified outcomes, populations, mechanisms and time horizons before evidence can be collected. One project might study indoor heat exposure among older residents during warm evenings, while another studies the economic feasibility of district cooling. They can inform one another without pretending to measure the same outcome.
Write a shared question with careful boundary conditions: which places, which people, which season, which hazard threshold, and which policy alternatives? Then distinguish explanatory questions from descriptive and normative ones. Measuring the number of hot nights is descriptive; identifying why a retrofit changed indoor heat may require causal design; deciding whose needs should receive priority involves values and public deliberation.
Disciplinary methods supply different kinds of evidence. Sensors record environmental conditions, survey instruments capture reported experience, historical documents explain decisions, and cost models estimate feasibility. A common protocol should explain how each data stream addresses the same research question instead of letting a convenient dataset redefine the problem.
Field task: Write one sentence identifying the study’s population, outcome, comparison, period and major uncertainty before proposing any instruments.
CHAPTER 3 OF 10 · Build compatible methods
3. Translate concepts without destroying their meaning
Back to contentsWords such as exposure, risk, resilience, equity, adaptation and efficiency can mean different things across fields. Engineers may define exposure as a physical threshold crossed during specified hours; healthcare researchers may refer to a dose or clinical hazard; social researchers may examine an experience shaped by housing and work conditions. A shared vocabulary should preserve these distinctions rather than imposing one vague definition.
Create a concept map with field-specific definitions and explicit links. Document measurement units, individual versus household or district levels, timing and missing-data conventions. An hourly temperature observation cannot simply be matched to a once-a-year household survey without explaining the timescale mismatch. Likewise a neighbourhood average cannot prove every resident experienced the mean conditions.
Methodological integration benefits from disagreement. If interviews describe severe discomfort on nights when average sensor values seem moderate, the result may indicate placement bias, humidity, individual vulnerability, missing peak periods or a poorly chosen outcome. Rather than deciding that one discipline is correct by default, use the disagreement to generate more informative tests.
Field task: Choose one common term such as risk and write each discipline’s operational definition. Specify one observation that would reconcile conflicting uses.
CHAPTER 4 OF 10 · Build compatible methods
4. Choose sampling and measures that fit the shared question
Back to contentsA sampling frame determines whose evidence enters a study. If environmental sensors are placed only in accessible public buildings, their readings may not represent private homes where heat exposure is greatest. If interviews recruit only people already engaged in an advocacy group, the views recorded may not represent all residents. Describe recruitment, eligibility, response rates and the populations for which conclusions are intended.
Integration requires comparable identifiers and timing without exposing unnecessary personal information. A household interview may need to be joined to approximate building age and environmental conditions, but fine-grained location data can raise privacy risks. Use coded keys, access controls and well-defined matching rules. Build a clear data dictionary before analysts from different fields produce incompatible spreadsheets.
Design for error as well as successful measurement. Calibrate sensors, test translated survey questions, check whether administrative records change their definitions, and specify missing-data treatment. Report uncertainty relevant to each component. Strong research does not hide a poor environmental sample behind excellent interviews or use the precision of temperature readings to imply equal precision in social causal claims.
Field task: Produce a measurement table listing the construct, field, units, collection method, sampling frame, timing and major bias risk.
CHAPTER 5 OF 10 · Build shared evidence
5. Create a collaboration charter and fair contribution model
Back to contentsInterdisciplinary teams depend on coordination between researchers who may use different evidence standards, review cycles and publication norms. The National Academies’ 2015 report Enhancing the Effectiveness of Team Science recommends explicit collaboration plans and attention to integration across the project life. A charter can define decision rights, responsibilities, milestones, conflicts and routes for resolving disagreements.
Clarify who is responsible for protocol changes, data quality, ethical review, community engagement, analysis code, external communications and stewardship after publication. Authorship and credit should be discussed before the final manuscript, then revisited as real contributions develop. A project can exploit community knowledge or early-career work if only the senior disciplines receive recognition.
Meetings alone do not prove collaboration. Look for shared analytic decisions: did an interview finding change which buildings were sampled? Did physical exposure measurements alter the questions posed to residents? Did budget evidence lead to a different policy alternative? Record these decisions so a reviewer can trace integration to an observable change in research rather than a claim in the introduction.
Field task: Write a one-page charter specifying evidence owners, conflict escalation, contributor credit, versioned protocol changes and the treatment of community partners.
CHAPTER 6 OF 10 · Build shared evidence
6. Worked example: weight exposure by the population actually studied
Back to contentsA fictional joint research team measures the hours per evening that two housing areas exceed a defined indoor heat threshold. Area A has 120 sampled households and averages three hot hours; Area B has 30 sampled households and averages nine. The simple average of the two area averages, (3 + 9) / 2 = 6 hours, gives both areas equal weight regardless of their different numbers of observed households.
If each household has a valid, comparable observation, the pooled household-weighted mean is (120 × 3 + 30 × 9) / (120 + 30) = (360 + 270) / 150 = 4.2 hours per sampled household. This is a measure for the combined sampled households, not necessarily a city-wide average. If the sampling probabilities or the underlying household populations differ, separate design weights may be required.
Neither 4.2 nor 6 hours explains why Area B is hotter or proves that a particular retrofit would solve its problem. Building materials, floor level, ventilation, time spent at home, appliance use and ability to afford cooling may matter. Interviews can suggest mechanisms and priorities; properly designed comparisons and physical observations must test them. Integration turns a numerical discrepancy into a better investigation.
Field task: Verify 630 household-hot-hours divided by 150 households. Explain why this measure is different from the unweighted average of the two area means and why no causal claim follows.
| Fictional housing group | Observed households | Average hot hours | Household-hot-hours |
|---|---|---|---|
| Area A | 120 | 3 | 360 |
| Area B | 30 | 9 | 270 |
| Combined sample | 150 | 4.2 (weighted) | 630 |
CHAPTER 7 OF 10 · Interpret together
7. Triangulate contradictory observations honestly
Back to contentsTriangulation uses multiple sources or methods to examine a claim from different directions. It is not a voting rule in which whichever method has the largest number of observations wins. A reliable temperature sensor and a detailed interview can disagree because they measure different constructs. If residents report sleeping poorly despite modest average room temperature, investigate humidity, nighttime peaks, sound, stress, data location and personal factors.
Predefine how disagreements will be evaluated. Check time alignment, measurement quality, missing observations, response patterns and alternative explanations. Preserve contradictory evidence in the analytic record. A synthesis that omits one inconvenient dataset may look elegant but be less truthful. The final explanation should show how combined evidence changed confidence in each mechanism.
Conceptual and methodological transparency are vital. State which claims are established by measurement, which are supported by interviews, which depend on modelling and which are normative judgements. Interdisciplinary research often produces conditional conclusions rather than one final number. This is a strength when the evidence genuinely calls for a more nuanced account.
Field task: Describe an apparent conflict between a physical measurement and interview evidence. Propose an additional observation that could distinguish at least two explanations.
CHAPTER 8 OF 10 · Interpret together
8. Protect participants and support reproducible work
Back to contentsResearch across disciplines can combine datasets in ways that increase identification risk. A temperature sensor file, approximate address, mobility history and interview transcript may together reveal a household even if each is labelled with a code. Collect only information needed for the question, set access roles, obtain appropriate ethics approvals, and communicate clearly what participants have agreed to share.
Maintain versioned protocols, data dictionaries, calculation scripts, instrument calibration notes and a decision log. Reproducibility does not require public release of identifying records. Secure access, synthetic teaching data, aggregate statistics and independently checkable methods can allow scrutiny while protecting participants. Explain what cannot be disclosed and why.
Community participation is more than recruitment. Affected residents may help choose research priorities, identify harms that experts overlooked and interpret practical constraints. Their participation must be respected rather than treated as automatic scientific validation of every interpretation. The project should distinguish lived expertise, empirical measurement, political preferences and the decisions made by accountable public authorities.
Field task: Plan an independent audit that can reproduce the aggregate results without releasing personally identifying household records.
CHAPTER 9 OF 10 · Practise and connect
9. Practise a second mixed-population calculation
Back to contentsConsider fictional mobility researchers combining two study groups. Fifty households in Group C experience an average of eight inaccessible-transport hours per month. One hundred and fifty households in Group D report two such hours. Averaging the group means gives (8 + 2) / 2 = 5 hours, but that treats the groups as though they contained equal numbers of households.
The pooled sample-weighted mean is (50 × 8 + 150 × 2) / 200 = (400 + 300) / 200 = 3.5 hours per household per month. This number describes the observed sample under equal household weighting. If groups were deliberately oversampled or their actual population shares differ, analysts should account for the sample design before claiming population representativeness.
The challenge is interdisciplinary because transport engineers may calculate service availability, economists may estimate time costs and social researchers may investigate the experience of inaccessible routes. Decide what ‘inaccessible hour’ means before combining their observations. Show subgroup burdens as well as the pooled average so that a modest combined mean does not conceal severe difficulty for one population.
Practice test: Answer 3.5 hours versus 5 hours. Specify the unit of analysis and one reason the pooled sample estimate might not reflect the wider population.
Practice result: 50 × 8 + 150 × 2 = 700 household-hours; 700 / 200 = 3.5 hours per observed household, not the unweighted group-mean average of 5 hours.
CHAPTER 10 OF 10 · Practise and connect
10. Connect research integration to the verified knowledge network
Back to contentsBegin with Interdisciplinary Studies for the educational foundations of combining subject perspectives, and Scientific Method for framing hypotheses, tests and corrections. Statistics supports sampling, uncertainty and weighting; Ecology illustrates biological systems that require multiple scales of observation. Innovation helps readers connect new knowledge to implementation and social value.
Research teams also need Information Governance for defensible records and access, Institutions to understand decision rights, and Ethics to evaluate participation, consent and distributional consequences. Education provides a broader destination for transferring inquiry into everyday decisions. These are verified existing eduKate subject roots, not placeholders for unpublished material.
The best interdisciplinary work changes the shared explanation through disciplined exchange between different kinds of knowledge. Learners can practise this by linking a mathematical calculation to a human consequence, comparing different sources and naming what each method cannot establish. The final test is whether another investigator could follow the integration, reproduce the calculations and recognise the limits of the claims.
Field task: Choose a public problem, identify three disciplines, describe one shared decision that would change after seeing evidence from each, and specify an ethical safeguard.
Questions learners often ask
Is any team with several departments interdisciplinary? No. The project’s methods, concepts or interpretations must actually be integrated.
Does a bigger dataset always outweigh other evidence? No. A large biased sample can answer the wrong question very precisely.
Is one weighted mean a complete account of inequality? No. It can hide substantial differences between groups and depends on the sampling design.
Must protected interview data be publicly released for reproducibility? No. Methods, metadata, aggregate results and appropriately controlled independent access can support scrutiny without disclosing identities.
Evidence sources and limits
The National Academies’ Facilitating Interdisciplinary Research (2005) and its defining chapter explain integration across disciplines. The National Academies’ Enhancing the Effectiveness of Team Science (2015) discusses research teams, collaborative charters, integration plans and institutional support. The report summary describes why collaboration procedures and shared decisions deserve deliberate design.
All hot-hour and transport figures are fictional demonstrations, not measured environmental exposure or evidence about a real population. Calculations, modelling, interview findings and ethical judgements serve different questions and should be labelled accordingly.