
Palynology studies pollen, spores and other microscopic organic-walled particles, including their modern distribution and their preservation in sediments and rocks. It connects the biology of living organisms with evidence about past environments. Its central challenge is to explain how a particle reached an archive before using it to describe the world outside that archive.
A lake-sediment slide can contain local pollen, grains carried from distant vegetation and particles eroded out of older deposits. Those grains do not arrive in equal numbers from every plant. The gold standard of palynology follows the whole chain: biological production, transport, deposition, preservation, identification, measurement and interpretation.
This subject root takes the wider scientific route through modern reference material, geological time, concentration and accumulation. The linked teaching guide retains its detailed classroom treatment of pollen percentages. Here, a new marker-grain calculation shows why a percentage, an absolute concentration and an accumulation rate answer different questions.
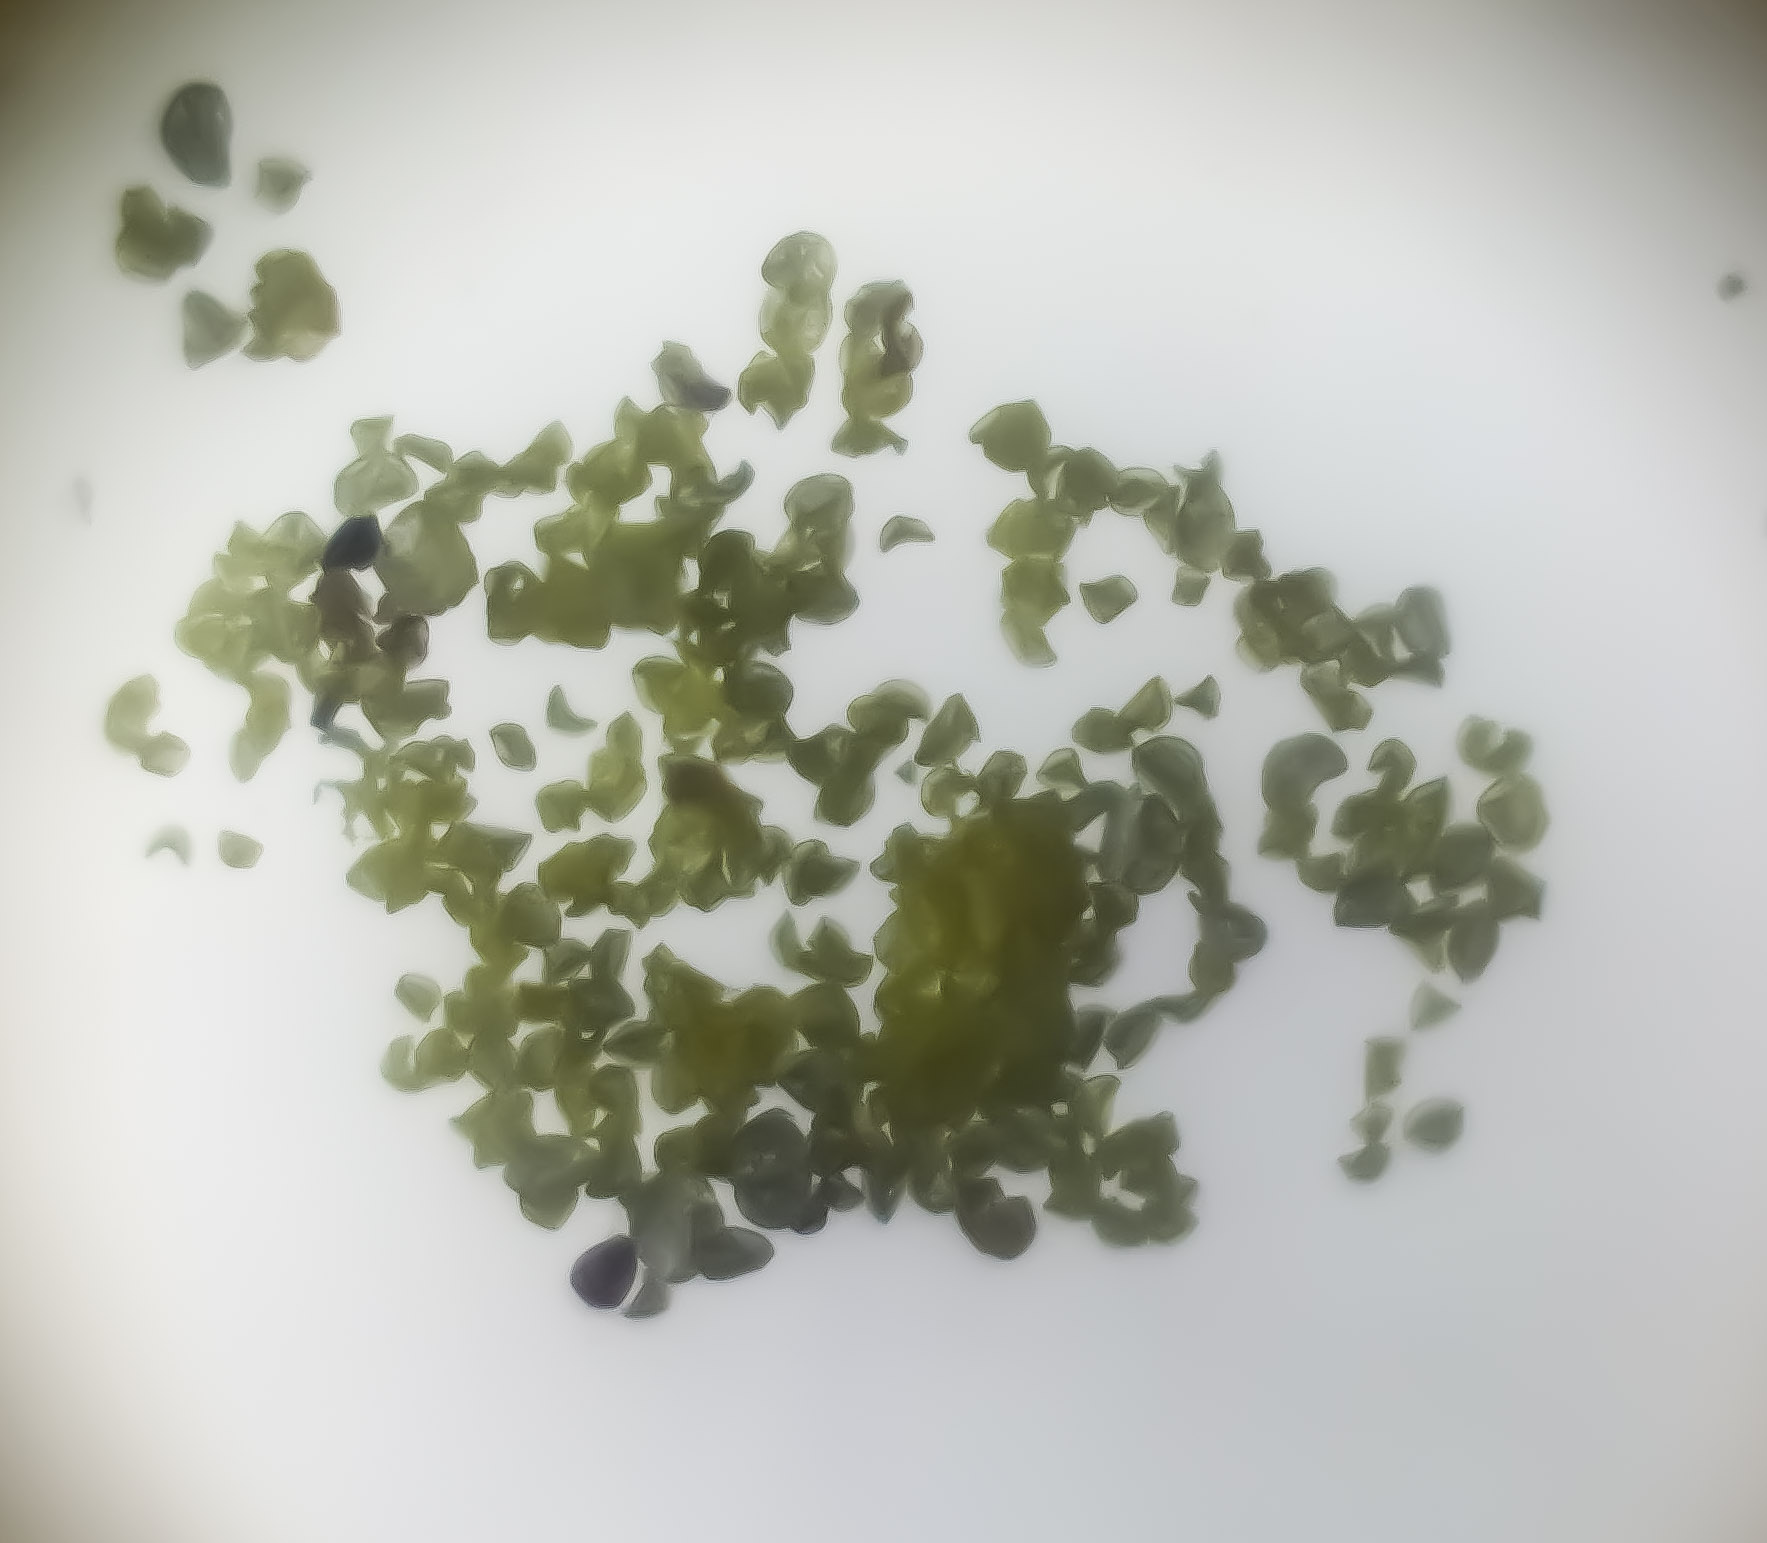
Featured image: modern pollen photographed by Korinna, CC BY 4.0, unmodified. It illustrates morphology; it is not material from the invented calculations.

This guide connects with The Gold Standard of Education and How X Works: learn the mechanism, test an explanation and use the relationship in a changed setting. All numerical datasets here are invented teaching examples, not reported field measurements.
Find your next question
Choose a route, or read from the beginning. Teaching chapters stay open; the grouped index helps you return to a method or calculation.
Full chapter index · Practice and answers · Connected guides and sources
Chapter index
Meet the particles · Chapters 1–3
Build a trustworthy sample · Chapters 4–6
Calculate the record · Chapters 7–10
Explain environmental history · Chapters 11–13
Check and continue · Chapters 14–16
CHAPTER 1 OF 16 · Meet the particles
1. A grain has a biological source and a depositional history
Pollen grains carry the male gametophytes of seed plants. Spores belong to a different reproductive pathway, found in groups such as ferns and mosses as well as fungi. Palynologists use diagnostic features of these particles, rather than treating every small round object as pollen.
Features such as size, openings and surface sculpture can support identification. Some grains can be assigned to relatively narrow groups; others can only be described at a broader taxonomic level. An honest family-level identification is more useful than an unsupported species name.
The surrounding material matters too. A grain photographed from a modern flower, collected in an air sampler and recovered from ancient sediment may look similar while carrying very different contextual information. The observation begins with morphology; the environmental claim also needs provenance.
CHAPTER 2 OF 16 · Meet the particles
2. Palynomorphs extend the subject beyond flowering plants
Palynomorph is a useful broad term for the microscopic organic-walled remains studied in palynology. Depending on the investigation, these can include pollen, spores, dinoflagellate cysts and other particles. A freshwater vegetation question and a marine sediment correlation question may therefore use different assemblages and specialists.
This breadth connects palynology with micropalaeontology, palaeobotany and stratigraphy. The boundaries are practical divisions of evidence and expertise, rather than a claim that every palynologist works on every group.
Choose the particle group that can answer the research question. A pollen diagram may inform vegetation change, while marine organic-walled microfossils may contribute different ecological or stratigraphic information. Do not transfer the meaning of one group’s abundance to another merely because both appear on microscope slides.
CHAPTER 3 OF 16 · Meet the particles
3. An archive is a filter, not a complete landscape inventory
Plant groups differ in pollen production and dispersal. Wind, water, vegetation structure and the distance to a sampling site influence what reaches the deposit. Sediment mixing and later erosion can then alter the sequence. Preservation adds another filter.
A small basin may emphasise nearby sources differently from a large lake. Neither is automatically better: the appropriate archive depends on whether the question concerns a local wetland or a wider region. The research design must identify the spatial scale of the proposed conclusion.
The British Geological Survey explains how pollen and spores contribute to reconstructing past vegetation. The important reasoning step is to distinguish the preserved sample from the vegetation that generated it. A useful reconstruction states the assumptions connecting the two.
CHAPTER 4 OF 16 · Build a trustworthy sample
4. Record the sample before interpreting the slide
Every sample needs a location, depth or stratigraphic position, description, collection method and identity that survives laboratory processing. Record disturbances, changes in sediment and the relationship to neighbouring samples. Without this context, an excellent identification may still have little historical meaning.
Use separate identifiers for a core, a sampled interval and a prepared slide. That prevents a later analyst from mistaking two slides from one interval for two independent environmental observations. Replication is only meaningful when the level of replication is clear.
A modern pollen sample can also contaminate an old deposit during handling. Blanks and documented processing provide ways to detect problems. This guide describes the reasoning of specialist preparation; it is not a home chemical extraction procedure. Appropriate laboratories determine safe methods for the actual material.
CHAPTER 5 OF 16 · Build a trustworthy sample
5. Build identification around a reference collection
Compare unknown material with reliable reference specimens and published descriptions. Record the microscope method, diagnostic characters, uncertainty and counting rules. Reference images are useful, but a single attractive photograph rarely shows every orientation or the full variation within a taxon.
Preservation can conceal a diagnostic opening or distort the surface. Keep an explicit unidentified category rather than forcing damaged grains into the nearest familiar group. Report whether unresolved particles enter the denominator used in a later calculation.
The BGS palynology collections illustrate the value of curated specimens and taxonomic documentation. A reference is part of an evidence trail: another analyst should be able to understand why a grain received its name and what would make that identification change.
CHAPTER 6 OF 16 · Build a trustworthy sample
6. Decide what the measurement will mean
A count describes particles encountered under a defined procedure. A percentage describes a count divided by a stated total. Concentration describes particles per quantity of sediment, such as grains per cubic centimetre. Accumulation rate adds the time over which material was deposited.
These are different measurements with different required information. A well-labelled percentage can be valid even when sample volume is unknown; it simply cannot provide a volume-based concentration. Similarly, a concentration does not become an annual influx until deposition through time is estimated.
Before counting, write the intended unit and denominator on the recording sheet. This small step prevents a later calculation from borrowing information that was never measured. It also makes comparisons across samples more transparent.
CHAPTER 7 OF 16 · Calculate the record
7. Use added markers to estimate concentration
In an appropriate laboratory method, a known number of distinguishable marker particles is introduced into a known sediment quantity before relevant processing. The observed ratio of fossil pollen to recovered markers can then estimate pollen concentration, provided mixing, recovery and counting assumptions are suitable.
For a teaching model, let P be counted pollen, M counted markers, A the markers added and V the original sediment volume. Estimated concentration C = (P/M) × (A/V). The result has units of grains per cubic centimetre when V is measured in cubic centimetres.
The method does not create a perfect count of the original deposit. Differential losses, poor mixing, identification errors and uncertainty in the marker preparation affect the estimate. A very small recovered-marker count is a warning about precision, not an invitation to display more decimal places.
For a documented application of added markers, see the Early Fields study methods. The example here simplifies that methodological idea and does not reproduce its data.
Suppose an invented sample has an original volume of 2 cm³. The preparation receives 10,000 marker particles. A defined count encounters 250 target pollen grains and 100 markers. Assume the marker total is known and the particles were mixed and recovered comparably for this illustrative calculation.
The pollen-to-marker ratio is 250/100 = 2.5. The marker addition per original volume is 10,000/2 = 5,000 markers per cm³. Multiplying gives an estimated pollen concentration of 12,500 grains per cm³. The 250 counted grains are not themselves the concentration.
If the same ratio came from an original volume of 4 cm³ with the same marker addition, the estimate would be 6,250 grains per cm³. Changing sample volume changes the interpretation even though the microscope ratio is unchanged. That is why the original volume belongs in the evidence record.
| Quantity | Invented value | Role |
|---|---|---|
| Original sediment volume | 2 cm³ | Sets the volume denominator |
| Marker addition | 10,000 | Known reference quantity |
| Counted pollen / markers | 250 / 100 | Estimated ratio of 2.5 |
| Estimated concentration | 12,500 grains/cm³ | Ratio × marker addition ÷ volume |
CHAPTER 9 OF 16 · Calculate the record
9. Convert concentration to accumulation only with a time model
Let the invented interval accumulate at 0.04 cm per year. Multiplying 12,500 grains per cm³ by 0.04 cm per year gives an estimated pollen accumulation rate of 500 grains per cm² per year. The units show the change from a volume concentration to delivery through an area over time.
This simplified expression assumes the concentration and sedimentation estimate refer to the same interval and compatible sediment-volume convention. Compaction, changing accumulation, mixing and dating uncertainty can complicate a real calculation. The arithmetic is easier than establishing those conditions.
If the accumulation rate were 0.02 rather than 0.04 cm per year, the estimated influx would halve to 250 grains per cm² per year. The slide has not changed. The interpretation changes because the time represented by a unit of sediment has changed.
CHAPTER 10 OF 16 · Calculate the record
10. Relative percentages can move while absolute concentration stays still
Imagine two invented samples in which tree-type pollen concentration remains 6,000 grains per cm³. Other included pollen rises from 4,000 to 9,000 grains per cm³. Tree-type percentage falls from 6,000/10,000 = 60% to 6,000/15,000 = 40%.
The percentage drop is real, but these values do not show a fall in tree-type pollen concentration. Another part of the assemblage increased. This is a compositional effect: every included category shares the same percentage total.
Nor does stable tree-type concentration prove unchanged forest cover. Production, delivery and sedimentation still require investigation. The strongest report states both results and their scope: the relative share decreased while the measured concentration in this example remained constant.
CHAPTER 11 OF 16 · Explain environmental history
11. Depth needs a chronology before it becomes a date
A deeper undisturbed sediment layer is generally older than material above it, but depth is not a fixed clock. Accumulation rates can change, intervals can be missing and older particles can be redeposited into younger layers. Stratigraphic order and calendar age are related questions.
An age model draws on suitable dated horizons and assumptions about the intervals between them. Radiocarbon ages require appropriate material selection and calibration; age estimates carry uncertainty. Reworked pollen can predate the layer in which it was finally deposited.
Report chronological resolution at the scale relevant to the claim. A transition spanning centuries cannot safely identify the exact year of a historical land-use decision. If dating uncertainty overlaps two proposed causes, the pollen record alone may not distinguish them.
CHAPTER 12 OF 16 · Explain environmental history
12. Calibrate an environmental interpretation against modern evidence
Modern samples connect observed vegetation, particle production and deposited assemblages. They help test whether the archive captures the ecological contrast being proposed. Calibration must suit the region, particle group and archive; relationships established in one setting may not transfer unchanged.
A study of modern surface pollen in the Moroccan Atlas, for example, examined the effects of long-distance dispersal. Its general lesson is methodological: tree pollen at a site need not mean trees grew beside the sampling point. Its specific regional results should not be applied automatically to a different landscape.
Use multiple indicators where possible. Plant macroremains, sediment properties, charcoal and independently dated evidence can narrow interpretations. Agreement strengthens a coherent explanation, while disagreement may reveal different source areas or an overlooked archive process.
CHAPTER 13 OF 16 · Explain environmental history
13. Distinguish environmental change from its cause
A shift towards more open-ground pollen may be consistent with several processes: climate change, disturbance, changing water level, human clearance or a changing source area. The assemblage is evidence to be explained, not a label identifying one cause.
Write at least two plausible mechanisms and the observations each would predict. A clearance interpretation might benefit from independently dated evidence of land use; a changing lake-margin interpretation might require sedimentary and aquatic evidence. The appropriate test follows the proposed mechanism.
A disciplined conclusion can remain useful without being absolute. Explain which interpretation fits best, which observations support it and what uncertainty remains. Good science gives the reader a way to revise the conclusion when new evidence appears.
CHAPTER 14 OF 16 · Check and continue
14. Plan a manageable investigation from question to archive
Begin with a bounded question: did the deposited pollen assemblage change across a specified sediment transition? Establish sampling resolution, identification rules, denominator, marker method if needed and independent chronology before promising an environmental narrative.
Keep raw counts, images, reference decisions and calculations together. A second analyst should be able to reproduce the percentages and locate the original interval. Document exclusions and negative results; they often explain why two apparently similar diagrams disagree.
For learning, change one assumption at a time. Hold the count ratio constant and change the sample volume; hold concentration constant and change the age model. This isolates the relationship that controls the answer and prepares the student for an unfamiliar dataset.
CHAPTER 15 OF 16 · Check and continue
15. Practice concentration, time and interpretation
The following invented exercise changes the values and the interpretation task. Work from units and evidence rather than copying a previous final answer. No calculation estimates a real site’s vegetation cover.
After calculating, write one observation, one conditional interpretation and one additional measurement that would help test it. Keeping those statements separate makes your reasoning easier to assess.
Try it independently
A 3 cm³ sample receives 12,000 markers. You count 180 target grains and 60 markers. Estimate concentration.
If that interval accumulated at 0.025 cm/year, estimate accumulation rate.
A second sample has the same target concentration but twice the total included pollen concentration. What happens to the target percentage? Does that establish declining plant cover?
Show answers and reasoning
Concentration = (180/60) × (12,000/3) = 12,000 grains/cm³.
Accumulation rate = 12,000 × 0.025 = 300 grains/cm²/year, conditional on the stated age and sedimentation model.
The target share halves. This alone does not demonstrate declining cover: the denominator changed, and production, transport and deposition still need assessment.
CHAPTER 16 OF 16 · Check and continue
16. Continue through the connected subject guides
Use the Teaching Palynology guide for the detailed percentage-based classroom investigation. Build terminology with New Zealand pollen-analysis vocabulary and Denmark pollen-analysis vocabulary.
Connect plant evidence through Palaeobotany, archive order through Stratigraphy, and longer environmental questions through Palaeoclimatology. The associated Micropalaeontology root compares other microscopic fossil groups.
Sources for further study include the BGS explanation of vegetation evidence, BGS curated palynology collection, and Bell and colleagues’ modern surface-pollen study. These support the biological and interpretive principles; the marker calculations and practice datasets above are original illustrations.
Contents · Previous chapter · The Gold Standard master hub · Continue with How X Works