
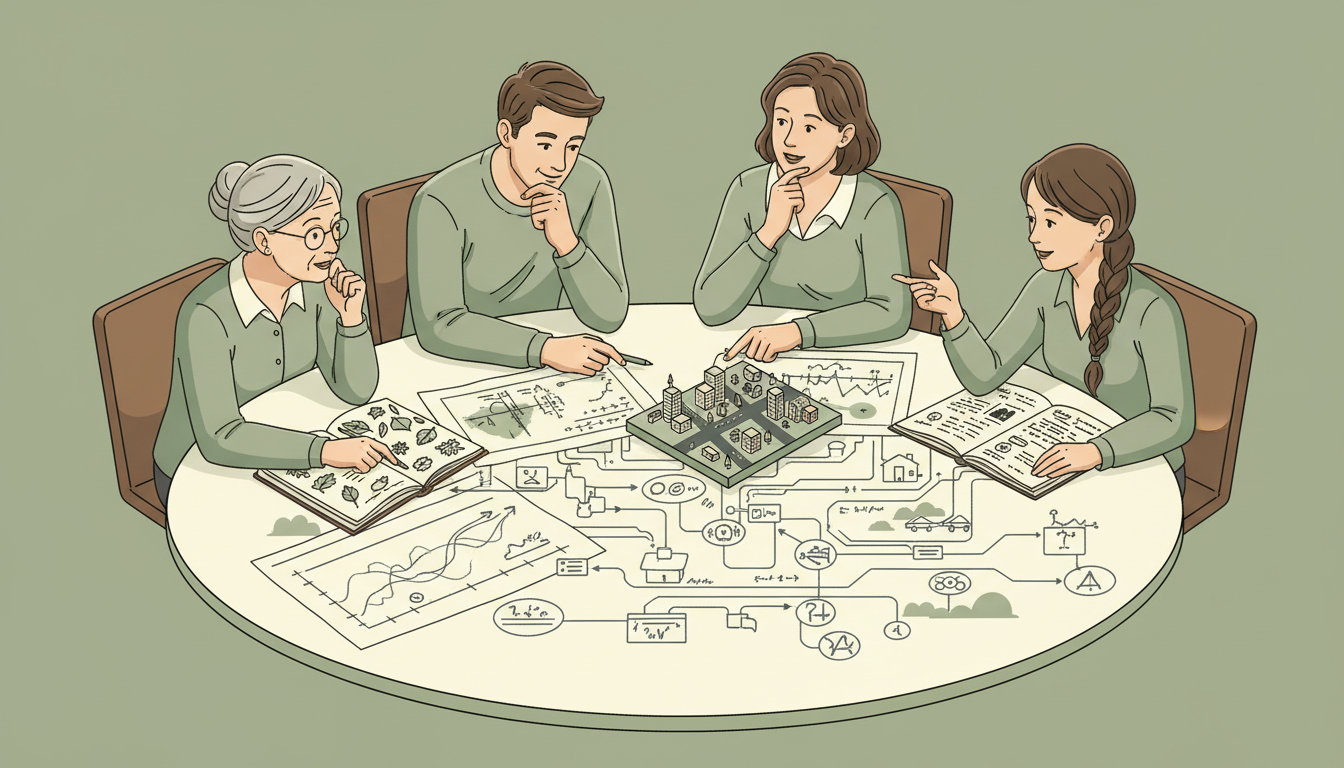
The gold standard of Scientific Literacy is the ability to explain science at the right level, evaluate how claims are investigated, interpret evidence and use the results in decisions without pretending that uncertainty has disappeared. It is the practical habit of asking what is known, how we know it and what follows.
This guide connects science lessons with everyday evidence: graphs, measurements, sampling, probability, research claims, media headlines, environmental decisions and classroom experiments. Four worked cases show how errors of interpretation can appear even when a diagram or number looks correct.
This is an educational overview, not a replacement for qualified scientific, engineering or health advice. The classroom and public-communication cases are fictional. Readers seeking the wider science curriculum can begin at The Gold Standard of Science; the chapter routes below emphasise transferable understanding.
Find the part you need
Choose a route that matches your question: understand science, interpret measurements, evaluate a claim or learn through a worked case.
Chapter index
Build the foundation
Explain and predict
Evaluate evidence
- Look for a representative sample, not just a large sample
- Understand risk as a quantity with a defined denominator
- Treat uncertainty as information, not as embarrassment
- Understand reproducibility, replication and independent checks
- Evaluate scientific sources by method and relevant expertise
- Use scientific evidence alongside values and practical constraints
Work through cases
CHAPTER 1 OF 23 · Build the foundation
1. Scientific literacy means using science to make sense of the world
Scientific literacy is more than knowing the names of planets, chemical symbols or laboratory apparatus. It means being able to explain scientific ideas at an appropriate level, examine how claims were investigated, interpret evidence and use what is known to make better-informed decisions.
A scientifically literate reader can ask why a number was measured, whether two observations are comparable and what a source can reasonably support. The reader does not need to be a specialist in every field. The essential habit is to recognise what is known, how it is known and where uncertainty remains.
The Science root offers a broad map of disciplines, while the Scientific Method and Inquiry roots explore knowledge-making more directly. This guide concentrates on the transferable literacy that readers use in classrooms, news, workplaces and civic life.
CHAPTER 2 OF 23 · Build the foundation
2. Learn facts, methods and the reasons evidence counts
Scientific understanding includes content knowledge, procedural knowledge and epistemic knowledge. Content knowledge concerns ideas about the world; procedural knowledge concerns methods of obtaining and examining observations; epistemic knowledge concerns why those methods can support some conclusions but not others.
A student learning about plant growth needs to know that light matters, how to design a comparison and why a controlled result supports a limited claim. Memorising a sentence about photosynthesis is not the same as knowing how to investigate the relationship between light and growth.
The OECD PISA 2025 Science Framework describes competencies including explaining phenomena, evaluating investigations and using information for decisions. It is a public educational reference, not a guarantee that one school activity measures every part of literacy.
CHAPTER 3 OF 23 · Build the foundation
3. Separate what was observed from what was inferred
An observation reports something that was detected, recorded or measured. An inference interprets that observation. Science often depends on inference, but the distinction matters because more than one explanation may fit the same evidence.
Suppose a student sees condensation on the outside of a cold glass. “Water droplets formed on the glass” describes an observation. “Water from the surrounding air condensed” is an explanation supported by knowledge and testable reasoning. It should not be presented as a direct visual sighting of individual vapour molecules.
Practise writing observations in a separate column from interpretations. Then ask what additional evidence would distinguish the leading explanation from alternatives. This connects Evidence with Reasoning without making either one a substitute for the other.
CHAPTER 4 OF 23 · Build the foundation
4. Turn a broad curiosity into a question that evidence can answer
“Is our classroom healthy?” is a meaningful concern but not yet a precise scientific investigation. Which aspect matters: temperature, ventilation, light, noise, illness transmission or something else? The question must become small enough that observations and a comparison can inform it.
A school might ask whether carbon dioxide readings differ between a closed-room lesson and a comparable lesson with the ventilation arrangement changed. That still requires sensible measurement conditions and cautious interpretation; the instrument reading alone does not measure every aspect of health.
State the variable, setting, comparison and outcome. The Inquiry guide shows how an answerable question can organise careful work. A good question does not promise certainty; it makes a useful method and a defensible conclusion possible.
CHAPTER 5 OF 23 · Explain and predict
5. Treat a scientific model as a representation, not reality itself
Models simplify a system so people can reason about important relationships. A diagram of the water cycle, a mathematical equation and a computer simulation are different forms of model. Each helps with some questions and omits detail that may matter in another context.
A school diagram showing a neat circular water cycle explains transfers between evaporation, condensation and precipitation. It does not mean weather systems move in fixed circular routes. Ask what is represented, which assumptions are built in and what the model is not designed to explain.
The Physics and Systems Thinking roots show how useful models reveal structure. Scientific literacy includes knowing when to use a simplified explanation and when its limitations become important to a real decision.
CHAPTER 6 OF 23 · Explain and predict
6. Read measurements together with units, calibration and limitations
A number becomes scientifically useful when the reader knows what was measured, which unit was used, how the reading was obtained and how much confidence the measurement deserves. Precision displayed on a screen is not proof of accuracy.
Imagine two thermometers that show 28.1 °C and 28.4 °C. Without evidence about calibration, placement and instrument uncertainty, a reader should not automatically attribute the difference to a meaningful environmental change. The last decimal place may describe the display better than the physical situation.
The Measurement and Laboratory Testing Companies guides connect credible measurements to traceability and stated methods. When comparing studies, check whether the variables and measurement conditions actually match.
CHAPTER 7 OF 23 · Explain and predict
7. Read tables and graphs without being led by appearance
A graph is a designed representation of data, not the data themselves. Axes, units, intervals, labels, aggregation and selection influence what a reader sees. A dramatic-looking slope may represent a small absolute change when the vertical axis begins near the measured values.
To understand a claim, inspect the axis origin and scale, sample size, missing observations, the definition of each plotted quantity and whether percentages share the same denominator. A line joining points does not prove smooth change between the observations.
Try redrawing a small dataset with a different but honest scale and explaining what did and did not change. The Statistics and Data roots support readers who need a deeper understanding of comparison and representation.
CHAPTER 8 OF 23 · Explain and predict
8. Ask what experiment or observation could test the claim
Experiments deliberately change or assign conditions and observe outcomes under a defined design. Observational investigations study events without assigning the relevant treatment or exposure. Both can be scientifically valuable, but they support different strengths of causal inference.
For a classroom investigation of dissolving, students might compare equal quantities of sugar under different water temperatures while controlling other relevant conditions. If stirring and sugar mass also change, the resulting comparison is harder to interpret.
No single school experiment should be expected to prove a universal law. Explain what was controlled, what was measured, how many trials were made and what additional conditions would need testing. Scientific Method builds the reasoning behind these design choices.
CHAPTER 9 OF 23 · Explain and predict
9. Distinguish coincidence, correlation and causation
Two quantities may change together without one causing the other. They can share a hidden driver, influence each other or align by chance. A correlation can prompt a valuable question, but causal explanation needs appropriate design, assumptions and evidence.
Imagine that cold-drink sales and swimming-pool visits both rise on hotter days. Buying a cold drink need not cause the visit; warm weather may increase both activities. A careful reader searches for plausible alternative explanations before treating the relationship as a mechanism.
When a headline declares that one behaviour causes another, ask how exposure was measured, what comparisons were made and which confounding factors were addressed. The Critical Thinking and Research roots help evaluate claims without dismissing all observational evidence.
CHAPTER 10 OF 23 · Evaluate evidence
10. Look for a representative sample, not just a large sample
A survey of many people can still misrepresent the population of interest when participation is selective. The number of observations matters, but so do the recruitment method, exclusions, timing and whether different groups had an equal chance to be represented.
Suppose a city park asks visitors at 10 a.m. on a weekday whether new opening hours are convenient. The respondents may be numerous and sincere, yet they will underrepresent people who cannot visit at that time. The sampling process limits what can be claimed about the whole community.
Ask who was counted, who was missing, and whether the result can be generalised to another setting. A scientifically literate response is not simply “the sample is biased”; it identifies the direction and importance of a plausible selection problem.
CHAPTER 11 OF 23 · Evaluate evidence
11. Understand risk as a quantity with a defined denominator
An increase of fifty per cent sounds large until the baseline is known. Moving from two events in a thousand to three in a thousand is a fifty per cent relative increase but an absolute increase of one event per thousand. Both descriptions are mathematically correct and convey different aspects.
Risk comparisons require a consistent population, period and outcome definition. Do not compare one group’s percentage from a year with another group’s percentage from a month without explaining the mismatch. Where a claim concerns health or safety, rely on qualified sources and appropriate professional context.
Use actual counts when available. The Statistics root helps separate absolute change, relative change and uncertainty, so readers can judge the significance of a number rather than react only to its largest-looking form.
CHAPTER 12 OF 23 · Evaluate evidence
12. Treat uncertainty as information, not as embarrassment
Every measurement and inference has limits. Uncertainty may come from instrument precision, sampling, natural variation, incomplete knowledge or the design of a study. Reporting it clearly is part of scientific honesty, not a sign that science has failed.
A result may support a range of plausible values rather than one exact number. The type of uncertainty matters: a standard deviation describes spread of observations under a particular definition, while a confidence interval arises from an inferential procedure. They are not interchangeable labels.
Check the caption, sample size, estimation method and meaning of any error bars before drawing a conclusion. The Gold Standard case study on a mislabeled standard deviation provides a concrete example of how apparently small wording errors can change a reader’s interpretation.
CHAPTER 13 OF 23 · Evaluate evidence
13. Understand reproducibility, replication and independent checks
Scientific findings become more trustworthy when methods and records are clear enough for other people to inspect them, repeat the analysis or conduct an independent study. Reproducing a computation and replicating a result with new observations are related but distinct activities.
A spreadsheet that calculates the reported average from the archived data helps a reviewer reproduce an analysis. A new experiment in a different class may probe whether the observed relationship recurs under appropriately comparable conditions. Neither exercise automatically proves a claim universal.
Record methods, relevant raw observations, transformations and known exclusions. Research and Inquiry explain why a reliable scientific account preserves the path between question, observation and justified conclusion.
CHAPTER 14 OF 23 · Evaluate evidence
14. Evaluate scientific sources by method and relevant expertise
A famous institution, technical vocabulary or polished chart does not make every individual claim reliable. Evaluate whether the source is relevant to the question, whether its methods can support the conclusion, whether limitations are discussed and how its findings compare with other credible evidence.
A single preliminary report may suggest an important possibility without overturning a well-studied body of evidence. Scientific consensus is not a vote of popularity; it reflects communities examining many studies, methods and criticisms over time. It can still change when stronger evidence emerges.
The National Academies report on Science Literacy considers science as knowledge, practice and an institution embedded in society. Scientific literacy includes understanding how organised criticism and cumulative evidence contribute to reliability, without treating individual experts as infallible.
CHAPTER 15 OF 23 · Evaluate evidence
15. Use scientific evidence alongside values and practical constraints
Science can inform what outcomes are likely under given conditions, but a public or personal decision may also involve costs, access, ethics and competing values. A measurement alone cannot decide what a community ought to prioritise.
A town comparing options for reducing heat exposure might need meteorological evidence, building knowledge, social access data and the experiences of people affected. Different questions require different kinds of evidence, and the strength of a conclusion should match the sources that support it.
Scientific literacy does not mean pretending every disagreement is a technical dispute. Separate factual claims from value choices, explain the evidence and engage fairly with consequences. The Environmental Science and Geography roots connect these skills to real places and systems.
CHAPTER 16 OF 23 · Work through cases
16. Worked case: a weather probability is read as a duration
At a fictional outdoor school event, a planning committee sees a forecast displaying a seventy per cent chance of rain. One organiser says the event will be wet for seventy per cent of the day and cancels activities on that basis.
A probability statement is not automatically a fraction of time. The committee should inspect the forecast provider’s precise definition, location and time period, then plan a suitable weather contingency using the actual uncertainty and the event’s consequences.
The Gold Standard case study about misreading rain probability develops the error. The transferable skill is to read the quantity and its reference carefully: percentage of what event, over what period and for which location?
CHAPTER 17 OF 23 · Work through cases
17. Worked case: error bars are given the wrong meaning
A fictional science poster plots the average reaction time of two groups. Its graph shows whiskers extending one standard deviation from each mean, but the legend calls them ninety-five per cent confidence intervals. Readers treat the overlap as a test of certainty.
The labels describe different statistical concepts. The group should identify how the whiskers were calculated, correct the legend and avoid inferring a formal comparison from the picture alone. If an inferential interval is needed, choose and document a suitable method.
This example shows why scientific literacy is not satisfied by a neat graph. A claim requires a match between computation, representation and language. See the standard-deviation-versus-confidence-interval case study and Statistics.
CHAPTER 18 OF 23 · Work through cases
18. Worked case: river-water results come from different conditions
A fictional geography class collects water temperature and clarity observations at three river locations. One group samples at 8 a.m. after a dry day; another samples late afternoon after heavy rain. Students initially rank the sites as though the observations were directly comparable.
The comparison mixes location with time and weather conditions. The class should record when and how each measurement was taken, how instruments were used and what environmental events might explain differences. It may need a revised design before making a claim about site quality.
A stronger conclusion can say what the present readings show and what they cannot establish. This connects Geography, Measurement and Environmental Science in a method that students can transfer to other field investigations.
CHAPTER 19 OF 23 · Work through cases
19. Worked case: a magnet demonstration hides a material difference
Two learners test whether magnets attract “metal”. One magnet picks up steel paper clips but fails to pick up an aluminium object. A student concludes that the magnet is broken because both objects are metals.
The observation challenges an overgeneralised model, not necessarily the magnet’s function. The explanation should distinguish materials: ordinary permanent magnets attract ferromagnetic substances such as iron and some steels much more strongly than typical aluminium objects in a simple classroom test.
A useful next task is to classify a small safe selection of materials, keep the magnet and testing distance consistent, and predict outcomes before testing. Students learn why a precise scientific term matters more than remembering an impressive demonstration. The Physics root expands the underlying concepts.
CHAPTER 20 OF 23 · Choose your next route
20. An eight-question diagnostic for a scientific claim
When a headline, video or assignment makes a scientific claim, pause at the structure of the statement rather than at whether you personally like the conclusion. Good literacy begins with asking which question the evidence could answer.
Ask: What exactly is claimed? Which quantities and units are involved? What was observed, and what was inferred? How were samples or comparisons chosen? Which alternatives remain? What uncertainty is stated? Which independent sources support the conclusion? What action would be justified at this level of evidence?
Make a short evidence map with three columns: supported, uncertain and unsupported. Identify one missing fact that would materially change the conclusion. When time is limited, this method is more useful than collecting many links that repeat the same unsupported assertion.
CHAPTER 21 OF 23 · Choose your next route
21. The Scientific Literacy specialist reading library
Scientific literacy draws on content disciplines, methods of inquiry, statistics, communication and education. The reading routes below connect established eduKateSG articles so readers can move from an everyday question into a precise specialist explanation.
Begin with Science for the domain, Scientific Method for investigation logic, Critical Thinking for claim evaluation and Education: Learning Transfers into Life for applying knowledge beyond a particular lesson.
The public sources include the OECD science framework and a National Academies consensus report. They provide broad educational grounding; worked cases here are original hypothetical exercises rather than items from those publications.
Science disciplines
Investigation and evidence
- Scientific Method
- Inquiry
- Research
- Evidence
- Investigation
- Statistics
- Measurement
- Data
- Critical Thinking
- Reasoning
Learning and communicating science
- Communication
- School Science Education and Laboratory Systems
- Science Inquiry and Laboratory Continuity
- JC1 Knowledge and Inquiry
- Higher Education: Responsible Inquiry
- Weather Probability Case Study
- Standard Deviation vs Confidence Interval Case
- Education: Learning Transfers into Life
- Clementi Secondary 1 Mathematics
External educational references
OECD PISA 2025 Science Framework and OECD: Research, Evaluate and Use Scientific Information; National Academies: Science Literacy, Concepts, Contexts, and Consequences (2016). These are public reference frameworks and research syntheses, not endorsements of the hypothetical classroom exercises in this guide.
CHAPTER 22 OF 23 · Choose your next route
22. Questions readers ask about Scientific Literacy
Is scientific literacy just knowing more facts? No. Facts help, but literacy also means understanding methods, evidence limits and how a conclusion is used responsibly.
Can a non-scientist be scientifically literate? Yes. The ability to evaluate a science-related claim, identify an inappropriate graph and ask a useful question is valuable without specialist laboratory training.
Does uncertainty mean scientists know nothing? No. Uncertainty helps express the precision and limitations of knowledge. Different levels of confidence can still support responsible action.
Does correlation prove cause? Not by itself. Causal reasoning needs suitable design, comparison and attention to alternative explanations.
Is one peer-reviewed study enough? A study can contribute useful evidence, but the weight of a claim depends on its design, quality, relevance, limitations and relationship to the broader body of research.
How can parents and teachers build this skill? Ask learners to explain a claim, design a small fair comparison, interpret its limits and apply the method to a new situation rather than only memorising an answer.
CHAPTER 23 OF 23 · Choose your next route
23. Practise scientific literacy in one new situation
Choose one accessible science-related claim from a lesson, community question or public article. Write it clearly, define the important quantities and identify which observations or sources would support it. Read the original explanation rather than copying a shortened social-media caption.
Make a miniature assessment: claim, evidence, method, uncertainty, alternative explanation and next question. Where suitable, conduct a safe small comparison or interpret a simple dataset. Ask another person to explain the conclusion and what would change their mind.
The Clementi Mathematics teaching reference demonstrates a closely related learning principle: make the reasoning visible, repair the first unstable step and verify independent use. Scientific literacy turns that habit into a lifelong way of reading evidence and making thoughtful decisions.
Contents · Previous chapter · Education root · The Gold Standard master hub