
Archaeological Geophysics allows researchers to investigate buried traces without immediately excavating them. Magnetometry, earth resistance and ground-penetrating radar measure different physical properties; their plots show contrasts rather than direct pictures of walls, graves or buildings. The Gold Standard of Teaching Archaeological Geophysics develops the ability to choose, interpret and verify the correct evidence before assigning an archaeological identity.
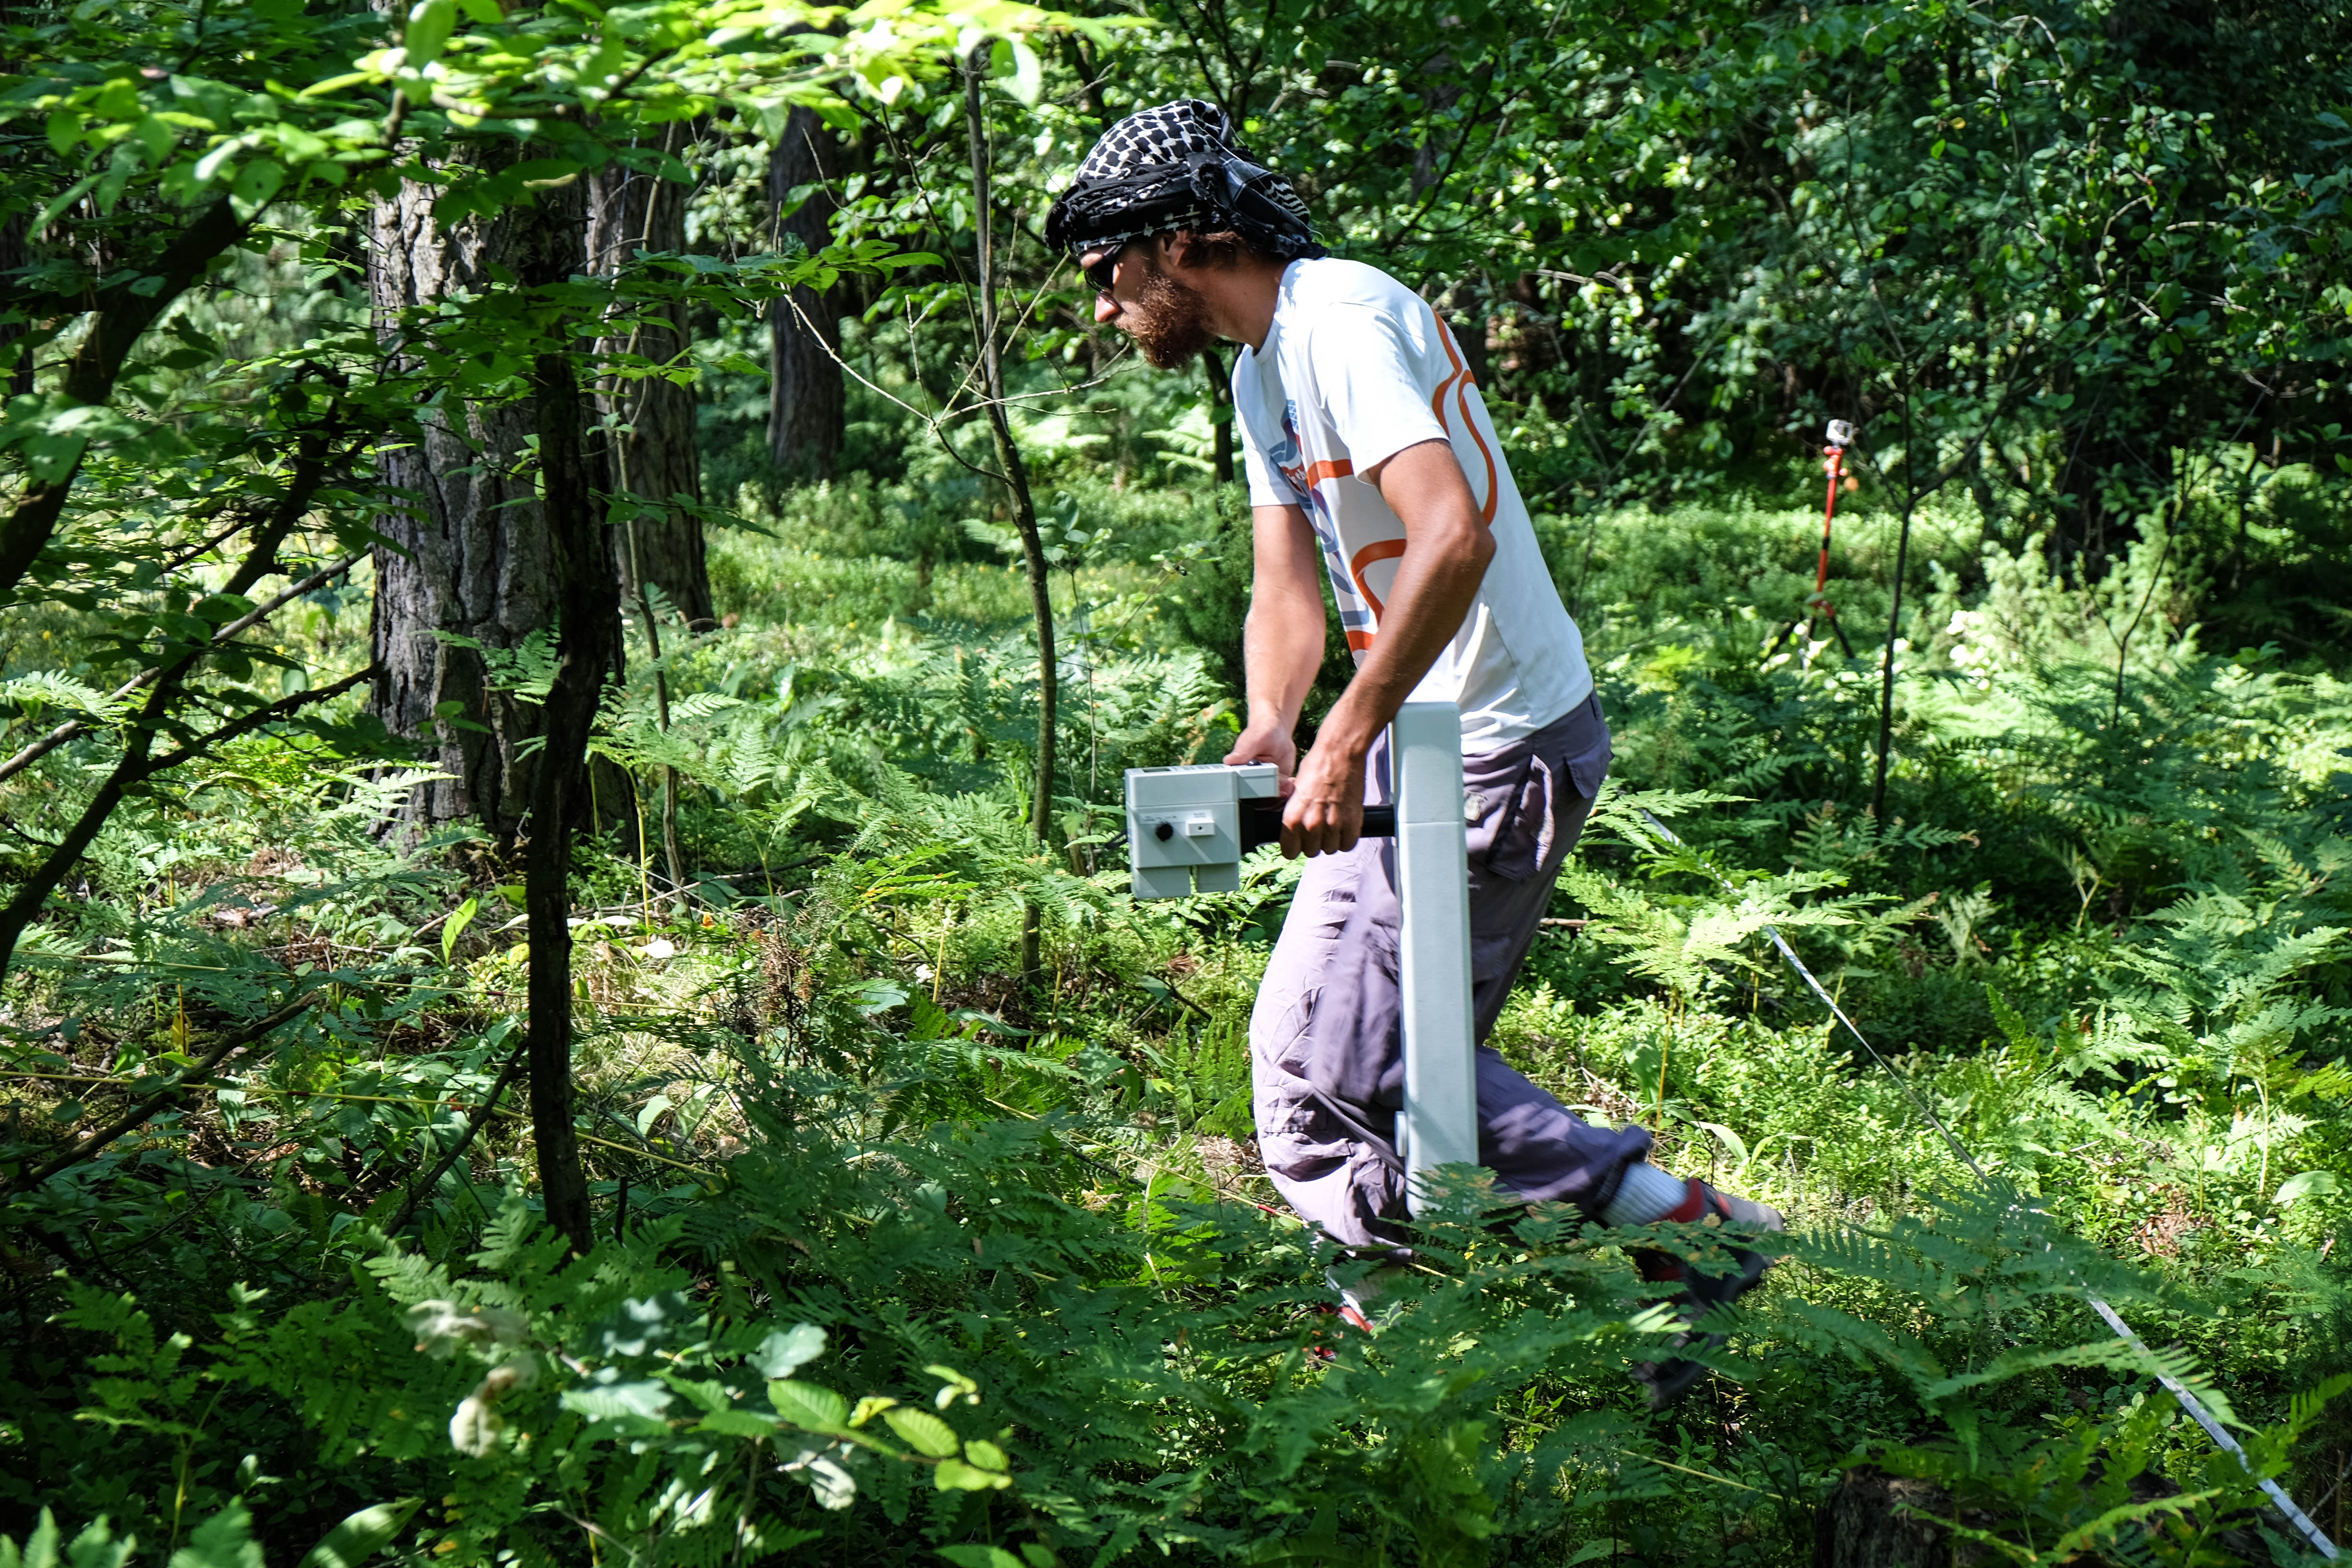
Our original teaching case is a wholly fictional survey of Meadow Field. A magnetic anomaly near a modern fence could result from recent iron disturbance rather than an ancient kiln; a radar reflection at 40 nanoseconds yields an illustrative depth of 2.0 metres only under the specified wave-velocity assumption. All survey numbers and features are invented. The featured field photograph was taken during a genuine non-destructive survey at Chodlik in Poland and is unrelated to Meadow Field.
The Historic England geophysical techniques guide, European Archaeological Council guidance and Thornborough field survey provide professional context. This guide applies the eduKate Gold Standard through field-specific reasoning, original worked cases, honest limitations and independent transfer.


Find the non-invasive survey question
Start with the measurement behind an anomaly, or follow the investigation through survey design, validation and archive.
Chapter index
What geophysical surveys actually measure · Chapters 1–5
Resistance, radar and spatial design · Chapters 6–9
Interference, processing and validation · Chapters 10–13
Care, reporting and transfer · Chapters 14–16
1. Begin with an anomaly rather than a discovered building
A fictitious geophysical survey of Meadow Field produces a strong dark-and-light pattern on a processed magnetic map. One student labels it a buried furnace, another says it is a medieval house and a third claims an ancient burial. None has yet examined excavation, archive or geological evidence. Archaeological geophysics measures contrasts in physical properties of the subsurface that may be influenced by past human activity, modern material or natural deposits. The first teaching responsibility is to distinguish a measured anomaly from the archaeological feature a researcher proposes might have caused it.
The Historic England geophysical survey guide explains that magnetometry, earth resistance and ground-penetrating radar are complementary methods of investigating buried remains without excavation. Each responds to different physical contrasts, and a visible pattern is not a direct photograph of an object. Our Meadow Field maps, numerical measurements and proposed features are invented for classroom interpretation. The real featured photograph, taken during a survey at Chodlik in Poland, documents people undertaking non-destructive prospection; it is not a map of the imagined field.
Back to chapter index · Next chapter
2. Define the research target before choosing a machine
An archaeological survey might seek settlement boundaries, ditches, masonry, kilns, paths or areas likely to be disturbed by proposed construction. Each presents different expected materials, depths, sizes and physical contrasts. A geophysical technique useful for magnetically enhanced pit fills might not be ideal for a stone wall in geology that produces similar background signals. Likewise, a very small feature may be missed if the measurement spacing is too coarse relative to its dimensions.
Give the class a fictional brief: ‘Before paths are altered, find out whether traces of a former enclosure extend across the meadow’. Students identify target size, anticipated material, survey area, ground conditions and whether archival maps already suggest a modern drain. The European Archaeological Council guidance, available via Historic England, cautions against recipe-book selection because every site and purpose differs. A good teacher makes pupils explain why a proposed technique responds to the question rather than celebrate the newest scanner.
Back to chapter index · Next chapter
3. Teach contrast rather than an imagined underground camera
A magnetometer does not display ancient objects directly. It records a magnetic response relative to its environment; earth-resistance survey measures how electricity moves through soil under a measurement configuration; radar records reflected electromagnetic energy. The eventual map results from physical measurements, positions and processing. An anomaly may be associated with a buried feature, but a mapped dark rectangle is not necessarily a rectangular room.
Use a safe synthetic worksheet with three possible subsurface sources: a filled ditch, a stone wall and modern iron rubbish. Ask what physical contrast each might create and whether it would be distinguishable from local geology. Students should recognise that absence of an anomaly does not prove absence of archaeology. A weak contrast, unsuitable survey timing, shallow or deep geometry, and interference can all obscure features. Understanding a method’s blind spots is essential before interpreting results.
Back to chapter index · Next chapter
4. Explain magnetic survey through plausible mechanisms
Archaeological magnetometers can detect differences in local magnetic properties. Fired structures, magnetically enhanced soils and certain fills may generate detectable patterns, while modern ferrous objects often produce pronounced interference. A kiln might leave a magnetic signature because heating changes the magnetic behaviour of some minerals. A ditch filled with enhanced topsoil can also contrast with surrounding material. Not all stones and soils behave similarly, and mineral geology itself can produce anomalies.
The Historic England technique description explains applications and limitations of magnetometers. In our fictitious Meadow Field, a high-response cluster near a modern fence should be treated differently from a coherent repeated pattern away from metal. Ask pupils whether an isolated +18-nT colour patch proves a furnace. It does not. Its significance depends on survey configuration, baseline, spatial form, modern interference and independent evidence. The teacher should avoid pretending one absolute amplitude threshold classifies an archaeological object across all sites.
Back to chapter index · Next chapter
5. Teach magnetic gradiometry and measurement units cautiously
A fluxgate gradiometer records a difference or gradient between sensors separated vertically; other magnetometers may record total magnetic field intensity or other configured quantities. The unit of the recorded instrument output and its processing must be specified. Some datasets are displayed in nanotesla or as a gradient in nanotesla per metre, depending on instrument and representation. Treating every colour legend as an identical physical measure makes comparisons across surveys misleading.
Provide students with an explicitly labelled synthetic map using ‘relative magnetic response, nT’ in the simplified exercise. Then show a separate example labelled gradient, nT/m, and ask why they cannot add or compare the raw values without considering the quantities and sensor configuration. A plotted anomaly scale may also be clipped for legibility. A good pupil reads the legend and metadata before saying one survey found ‘twice as much archaeology’. This teaches dimensional literacy within archaeological interpretation.
Back to chapter index · Next chapter
6. Read earth resistance as a moisture-related contrast
Earth-resistance methods pass small controlled currents through electrodes and measure an electrical response of the ground. Moisture, dissolved ions, porosity and soil conditions influence resistance. A relatively dry wall foundation may produce higher resistance, whereas a damp ditch fill may have lower resistance in some site conditions; those are tendencies, not a universal diagnostic code. Seasonal rainfall and soil moisture can substantially affect survey contrasts.
Historic England’s earth resistance guidance explains the physical relationships and seasonal dependence. Give pupils two invented resistance plots of the same field made at different moisture conditions. One shows a possible linear high-resistance feature clearly, while the other barely shows it. What changed? Perhaps the detectable contrast rather than the underlying stone. The lesson teaches repeatability of method conditions and the possibility of a false negative. Real field electrodes and permissions are for trained survey teams, not unsupervised pupils working on protected ground.
Back to chapter index · Next chapter
7. Understand ground-penetrating radar as reflected travel time
Ground-penetrating radar sends electromagnetic pulses into the ground and records their reflected responses. A reflector may arise where electrical properties change, including some buried surfaces, geology or archaeological materials. The instrument often records two-way travel time; converting that time to depth requires an appropriate estimate of wave velocity in the ground. Moisture and soil properties affect propagation and attenuation, so a strong reflection is not proof of a stone wall.
In a fictional calculation, assume a reflection at 40 nanoseconds two-way time and a stipulated radar velocity of 0.10 metres per nanosecond. The simplified depth estimate is 0.10 × 40 ÷ 2 = 2.0 metres. The factor of two accounts for travel down to the reflector and back. Change the assumed velocity to 0.08 metres per nanosecond; the estimate becomes 1.6 metres without moving the reflecting surface. Students learn why radar depth maps are model-dependent, not direct tape measurements of hidden archaeology.
Back to chapter index · Next chapter
8. Distinguish time slices, profiles and three-dimensional interpretations
A radar profile shows responses along a survey line, while sets of closely spaced lines can be processed into time slices or an estimated three-dimensional subsurface representation. These visualisations can be useful for tracing pattern continuity, but their apparent depth and shape depend on line spacing, velocity assumptions, filtering and position control. A bright rectangular image in a time slice is still a visualisation of reflected energy.
Ask students to describe an invented radar profile before viewing a processed time-slice map of the same classroom data. They should identify which features genuinely persist through multiple survey lines and which appear only after interpolation. A long thin anomaly may be a pipe, geological contact or wall-like feature, depending on context. Learners need to communicate ‘candidate reflector’ or ‘possible buried boundary’ until independent evidence supports a more specific archaeological identification.
Back to chapter index · Next chapter
9. Teach survey grids and spatial resolution as a design choice
A field survey collects measurements at positions separated by chosen intervals. The grid origin, line direction, traverse spacing, within-line sampling, orientation and location reference affect what the final map can resolve. A target smaller than the grid spacing may be poorly represented or missed. The method can appear very precise because GPS coordinates have many digits, even when the sensor footprint and spacing limit the spatial resolution.
Give pupils a ten-by-ten-metre imaginary survey divided into one-metre cells, with a suspected ditch only half a metre wide. Ask whether the chosen sampling scheme could reliably represent the ditch’s form. It might not. Then compare a finer grid requiring more field time and data management. Students should justify spacing against target dimensions rather than assume the finest possible grid is always the only responsible answer. Constraints of terrain, access, vegetation and instrument design matter.
Back to chapter index · Next chapter
10. Locate modern interference before attributing anomalies to antiquity
Modern fences, buried pipes, discarded metal, electric cables, machinery and surface structures can influence geophysical readings. A magnetometer may show a striking anomaly around a steel gate; resistance and radar can be affected by modern services or ground disturbance. If researchers ignore site history, a brilliant archaeological plan can become a map of twentieth-century infrastructure.
Add a fictional iron fence to one side of Meadow Field and place two isolated high magnetic points nearby. Ask pupils to annotate modern potential sources, compare historic mapping and explain what a professional should investigate before proposing an ancient furnace. A survey report should identify interference zones and low-confidence areas rather than hide them for a cleaner illustration. Good archaeological geophysics uses anomalies as hypotheses, not the raw material for an exciting discovery headline.
Back to chapter index · Next chapter
11. Read processing steps as decisions that can alter interpretation
Geophysical data processing may correct traverse offsets, remove drift, suppress spikes, interpolate a grid or apply filters and display clipping. These operations can make patterns easier to interpret while also concealing original measurements or creating visual artefacts if applied inappropriately. A final map is a processed product, not the only evidence of the survey. The path from raw readings to displayed colours needs documentation.
Present students with a synthetic raw plot and a second image after a strong smoothing filter. A small isolated spike disappears and a broken linear pattern seems continuous. Ask whether the processing proved the ditch continued across the gap. It did not; the algorithm affected the display. Students should keep raw data, processing parameters and an interpretive record. The objective is not teaching every software menu, but understanding that methods influence what an analyst can see and claim.
Back to chapter index · Next chapter
12. Combine complementary surveys without treating agreement as certainty
Several methods can respond to different properties of the same buried structure. A possible wall might coincide with high earth resistance and a radar reflector, strengthening a coherent interpretation, while magnetic data may or may not show it. Yet all methods can also reflect the same geological or modern feature; apparent agreement is not automatic proof of cultural origin. Corroboration must be interpreted through the physical mechanisms of each technique.
Historic England’s 2024 Thornborough survey report documents the use of magnetometry, earth resistance and GPR with indications of potentially archaeological and modern features. Ask students to compare two imaginary maps of Meadow Field and describe which anomalies overlap, which diverge and what each method uniquely measures. The best student ranks candidate explanations rather than declaring every crossing of two dark lines an excavated building.
Back to chapter index · Next chapter
13. Use validation and negative results as genuine evidence
Geophysics can guide a targeted archaeological investigation, but a map cannot substitute for the entire record of stratigraphy, artefacts, environmental material or historic maps. In some settings, validation may involve archival sources, surface survey, approved excavation or monitoring. A negative survey result can be meaningful about the absence of detectable contrast under stated conditions, but it is not proof that there were no people or structures at the location.
Give the class an invented strong magnetic anomaly for which later authorised trenching reveals modern burnt refuse rather than an ancient kiln. Would the geophysical survey have ‘failed’? Not necessarily: it correctly recorded a magnetic contrast. The archaeological attribution was wrong. Similarly, an undetected shallow feature might remain invisible because its physical properties resemble the soil. Students should distinguish measurement validity from interpretation validity, and understand why a responsible report records both successes and constraints.
Back to chapter index · Next chapter
14. Teach permissions, landscape stewardship and survey safety
Geophysical methods can reduce the need for excavation, which helps protect heritage, but ‘non-invasive’ does not mean no permission is needed or that every survey is without disturbance. Instruments may need access to private land, careful navigation near hazards and lawful arrangements for protected sites. Earth-resistance electrodes can penetrate the surface slightly, and infrastructure or ecological sensitivity can limit fieldwork. Different jurisdictions have different legal requirements.
The Historic England geophysical survey advice discusses project planning, competence and consent issues. Pupils should practise designing a hypothetical permission checklist rather than conduct unsupervised surveys at a protected monument. The featured Chodlik photograph is licensed for reuse under CC BY 4.0 and documents a real Polish research project, not a ready-made permission for access to any other site. Safety, legal access and conservation are normal components of scientific work.
Back to chapter index · Next chapter
15. Document a geophysical survey so another archaeologist can review it
A reusable survey record includes project aims, site location, grid and coordinate systems, survey dates, instrument and configuration, sampling interval, environmental conditions, observed interference, raw datasets, processing steps, interpreted anomalies, limitations and repository information. A single colourful figure titled ‘Medieval Village Revealed’ cannot provide that information. The scientific product is the evidence trail as well as the attractive map.
Students fill out a fictional survey report with separate sections for method and interpretation. Ask whether an independent analyst can reproduce the colours from raw data, locate the anomalies, compare the maps and identify where uncertainty was recorded. A later archaeological investigation may revise an earlier attribution without making the original measurements useless. That revisability is the gold standard of field science and supports ethical heritage decisions over time.
Back to chapter index · Next chapter
16. Prove transfer through an unfamiliar site and method choice
The final assessment describes an unfamiliar fictitious former orchard crossed by a modern service pipe, with possible buried masonry and uneven soil moisture. Students must choose a suitable combination of geophysical methods, specify sampling and environmental controls, predict possible interference and explain how they would verify one promising anomaly without assuming it was an ancient building.
An excellent response identifies what each instrument can measure and what it cannot, uses consistent spatial and physical units, and proposes a bounded conclusion. The learner should not turn a 2-metre radar depth estimate into a dated wall without evidence or use one absent magnetic signal to declare a site empty. The gold standard of teaching Archaeological Geophysics is a student who can design, interpret and communicate a responsible investigation while keeping physical anomalies, potential archaeological features and historic identity distinct.
Worked survey: three anomalies and three honest interpretations
The following numbers and site features are invented. The magnetic-response values use a simplified nT data display and are not actual measurements from Chodlik. This exercise is about distinguishing a reading and its spatial context from the specific buried object a researcher might infer.
| Hypothetical result | Measurement or observation | Potential explanations | Responsible next check |
|---|---|---|---|
| Magnetic cluster A | Local +18 nT response near modern fence | Modern iron, burnt material, geological source | Record fence interference, source maps and neighbouring data |
| Linear resistance B | High-resistance stripe after a dry spell | Stony material, wall-like remains, dry drainage feature | Check soil moisture, old plans and complementary observations |
| GPR reflector C | 40 ns two-way time | Soil interface, pipe, wall or geology | Model wave velocity; do not assert an object or absolute depth from time alone |
Key distinction: A magnetic contrast can be accurately recorded even when an archaeologist’s interpretation of it proves wrong. A strong student describes the geophysical measurement, notes competing explanations and proposes a relevant source check. A buried-wall label, date and function require evidence beyond a colour scale.
Worked radar calculation: why a time slice is not a depth measurement
| Stated assumption | Calculation | Depth estimate |
|---|---|---|
| Two-way travel time = 40 ns; velocity = 0.10 m/ns | 0.10 × 40 ÷ 2 | 2.0 m |
| Same travel time; velocity = 0.08 m/ns | 0.08 × 40 ÷ 2 | 1.6 m |
The factor of two accounts for the wave travelling down and back. The difference between 2.0 and 1.6 metres comes entirely from the velocity assumption in this invented example. Neither estimate establishes that the reflector is a wall or that it belongs to a historical period. Actual wave velocity depends on the medium and may need survey-specific calibration.
Four practical lessons from physics to archaeology
- Lesson 1 — Mechanism: explain what magnetometry, earth resistance and GPR measure and why buried contrasts may appear.
- Lesson 2 — Survey design: choose a grid and methods for a stated field question, considering depth, vegetation, soil and modern infrastructure.
- Lesson 3 — Interpretation: compare an invented magnetic anomaly, resistance feature and radar travel-time estimate without overclaiming.
- Lesson 4 — Transfer: analyse a new fictitious orchard site and write an evidence-safe survey proposal with relevant legal and heritage safeguards.
Advanced survey workshop: changing grid resolution changes what can be seen
The fictitious Meadow Field covers 40 by 40 metres. Team A takes readings along traverses separated by 2 metres, while Team B samples lines separated by 0.5 metres. A narrow linear feature is hypothesised to be 0.6 metres wide. Pupils should predict why Team B’s denser arrangement may represent a small feature better, assuming adequate measurement quality and within-line spacing. But they should not declare that Team A’s apparent absence of an anomaly proves no buried feature exists. Sampling orientation also matters: a narrow line aligned with traverse direction may behave differently from one crossed at a steep angle. A credible survey plan states target size, survey spacing, site conditions and the available field effort before collecting data.
Now add a modern buried service pipe, shown on an independent utilities plan but not on an eighteenth-century map. The instrument records a persistent anomaly along that line. A strong learner identifies the potential modern cause and proposes a safe source check, rather than excavating or probing the pipe for confirmation. Protected sites and active infrastructure require lawful professional arrangements. The case teaches why high spatial precision and archaeological meaning are separate. Surveying the same ground more closely can produce a sharper picture of a modern service without making it ancient.
Advanced interpretation audit: three displays from one synthetic dataset
Give students an invented raw magnetic profile, a despiked version and an interpolated image with a strong colour contrast. One isolated measurement at +18 nT disappears after removal of a suspected modern metal spike; elsewhere a broken row of moderate responses appears continuous after interpolation. The question is not which display looks more impressive. It is what the original instrument recorded, which processing rule was applied and whether the apparent archaeological geometry survives reasonable alternative processing choices. Require a brief method history beside every interpretation.
Finally introduce a fictitious GPR velocity discrepancy. Under a dry-ground assumption of 0.10 metres per nanosecond, a 40-ns reflector is estimated at 2 metres depth; under a wetter-ground assumption of 0.08 metres per nanosecond, it is 1.6 metres. The reflector’s measured travel time is unchanged. Students should identify the needed velocity evidence and resist labelling the reflector a building floor before physical origin and context are established. This single exercise combines measurement, assumptions and archaeology, and exposes a common error: treating a processed depth plot as if the instrument had measured depth directly.
Assessment rubric for a trustworthy geophysical interpretation
| Stage | Strong evidence | Misconception to diagnose |
|---|---|---|
| Question and instrument | Explains the target’s likely physical contrast and method limitations | Chooses a device because it is fashionable |
| Acquisition | Documents location grid, line spacing and environmental interference | Confuses map resolution with the precision of a buried object |
| Processing | Keeps raw data and explains filters and interpolation | Treats software smoothing as proof of a continuous structure |
| Interpretation | Reports multiple possible origins for each anomaly | Renames every dark patch as a building or grave |
| Transfer | Designs an appropriate new survey and verification plan | Claims one method is ideal everywhere |
Frequently asked questions
Can geophysics tell us with certainty that a buried wall exists?
No. Geophysics detects property contrasts; specific archaeological interpretations need corroboration.
Does a strong magnetic anomaly always indicate a kiln or furnace?
No. Geological contrasts, modern metal and other sources can create strong magnetic signals.
Does GPR measure depth directly?
It records travel time and reflected energy. Depth estimates depend on a justified wave-velocity model.
Does an empty-looking survey prove there was no archaeology?
No. An undetected feature may have little physical contrast or fall outside useful survey conditions.
Is non-invasive archaeological survey automatically permitted?
No. Land access, protected-site permissions and safety restrictions may still apply.
Geophysical field methods and official guidance
- Historic England: Geophysical Techniques
- Historic England: Archaeological Geophysical Survey
- Historic England: Geophysical Survey Advice, Updated 2025
- European Archaeological Council Geophysics Guidance via Historic England
- Historic England: 2024 Thornborough Multi-Method Survey
- Chodlik Geophysical Survey by Łukasz Miechowicz, CC BY 4.0
Explore connected eduKate evidence methods
- Teaching Archaeology | Context and Material Evidence
- Teaching Geoarchaeology | Sediments and Site Formation
- Teaching Historical Cartography | Maps and Source Criticism
- Teaching Physics | Model, Measure and Explain
- Teaching Soil Micromorphology | Microscale Layers
- The Gold Standard master hub
The gold standard of teaching Archaeological Geophysics is a learner who can distinguish what a sensor actually measured from a proposed buried feature, explain what other methods could test that proposal, and preserve a transparent record of the field conditions, processing and uncertainty.