
eduKate · The Gold Standard of Watersheds
Find your next learning step
Choose the question closest to your purpose, or follow the guide in order.
Full chapter index · Questions and checks · The Education root
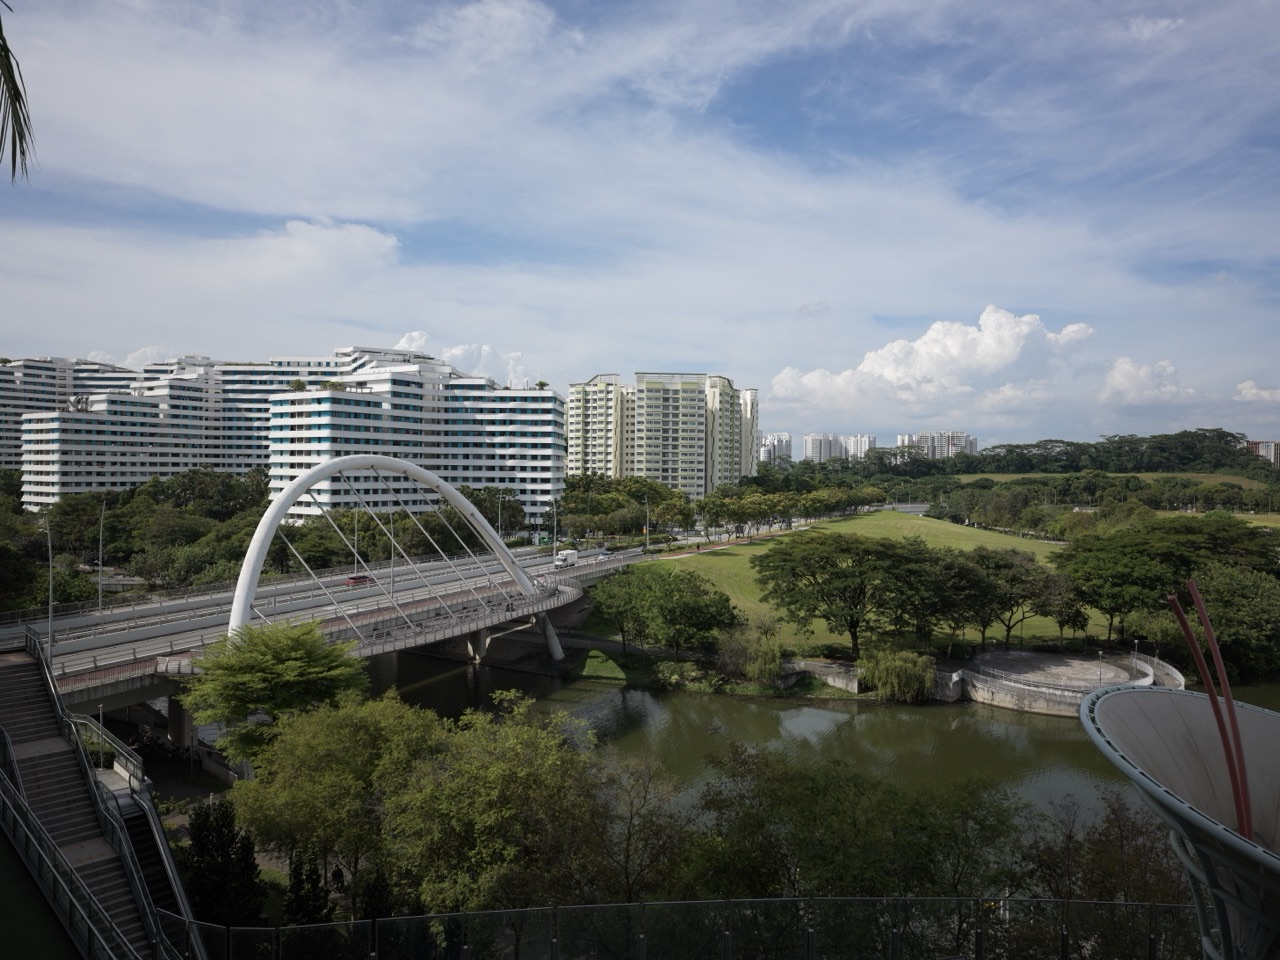
Canal and bridge at Punggol Waterway Park. A waterway is one visible part of a larger relationship between land, rainfall and receiving waters.
The gold standard of watersheds is understanding which land contributes water to a stated outlet, how that water moves and what happens along the way. The place where a river is measured and the land supplying it belong in the same explanation.
A watershed is also called a drainage basin or catchment in many contexts. The useful starting point is an outlet and a question: what area contributes to this location, and what evidence describes its water and land?
This root connects Hydrology, Rivers, Rainfall, Reservoirs, Wetlands, water resources and flood-risk engineering. The examples teach area, volume and interpretation using invented maps and figures.
Full chapter index
1–4 · Foundations and first explanations
5–8 · Worked cases and connected ideas
9–12 · Evidence, interpretation and transfer
13–15 · Specialists, questions and sources
USGS describes a watershed as land draining toward a common outlet. That outlet might be a point along a stream, a reservoir outflow or a receiving bay. Choosing a different outlet can change the area being discussed.
This makes a watershed a relationship between land and a receiving point. It is more than the blue line representing a river. Activities across the contributing land can matter to the quantity and quality of water arriving at the outlet.
Begin a map with the receiving point clearly marked. Then identify which boundary and drainage data are being used. An outline without an outlet or purpose can be difficult to interpret, especially when neighbouring catchments share a wider basin.
For students, place two supplied outlet points on the same river network and compare their contributing areas. Ask what is included at one point and added at the other. The exercise turns a map from a decorative background into a tool for reasoning.
Source reading: USGS — Watersheds and Drainage Basins
Drainage divides separate areas contributing surface water in different directions. Ridges and higher ground can help explain those boundaries, but a useful delineation depends on suitable data and the actual setting.
A contour map shows elevation through a defined representation. Its scale, interval and detail affect what a reader can identify. A broad regional map cannot resolve every small urban connection or local feature.
Engineered drainage can also influence routes. Where a system includes drains, culverts or transfers, use the appropriate current information rather than assuming that the visible surface alone describes every connection.
For a classroom exercise, use a supplied map with its intended assumptions. Mark divides and paths separately, then explain how the path relates to the outlet. If the data do not resolve an area, record the uncertainty rather than completing the outline by appearance.
A larger watershed can contain smaller contributing areas. USGS’s hydrologic-unit resources explain the use of a nested hierarchy for organising water-related geography. The hierarchy helps readers relate local observations to a wider basin.
A small upstream area and the larger area containing it should not be counted as independent pieces when calculating a combined extent. Their relationship must be understood before adding numbers.
A monitoring station’s contributing area also matters when comparing records. Two stations on the same river may receive water from different amounts of land. Equal measured volumes would therefore describe different relationships to area.
For students, draw a simple branching diagram with outlets and contributing areas. Put the smaller areas inside the larger one on a map as well. Moving between the two representations helps establish what the numbers count.
Source reading: USGS — Understanding Hydrologic Unit Codes · USGS — Rivers and the Landscape
CHAPTER 4 OF 15 · Work the area example
4. Worked example: avoid adding a catchment twice
Imagine a fictional downstream catchment with a total area of 13 square kilometres. It contains two non-overlapping upstream subcatchments, A and B, with areas of 4 and 6 square kilometres. The rest of the contributing land lies outside A and B but inside the downstream boundary.
The additional local area is 13 − 4 − 6 = 3 square kilometres. The total remains 13. Adding 4 + 6 + 13 would produce 23 and count the two upstream areas twice.
The calculation depends on the stated map relationship. If A and B overlap, or if the boundary definitions differ, the subtraction needs reconsideration. Accurate area values cannot repair an incorrect understanding of how the areas fit together.
This is a transferable Mathematics problem about sets and inclusion. The practical water question supplies the meaning: which land has already been counted? A good answer states that relationship before writing the arithmetic.
CHAPTER 5 OF 15 · Follow rain and time
5. Follow rainfall through several possible pathways
Rainfall over a catchment does not all appear immediately at its outlet. Water can enter the ground, remain in storage, return to the atmosphere or move through different pathways and timescales. Hydrology develops these relationships in more detail.
The response also depends on the land and prior conditions. A description of one storm or one surface is only part of the account. The relevant question might concern a short event, a season or a longer period.
A rainfall volume and an outlet flow record therefore answer different questions. One describes an input over an area; the other describes movement past a point through time. Connecting them requires a model or observations suited to the purpose.
For students, add arrows to a simple catchment sketch and label what each arrow represents. Include storage rather than drawing every input straight to the river. The diagram should help explain a calculation, not imply that every real pathway has been measured.
Source reading: USGS — Watersheds and Drainage Basins
CHAPTER 6 OF 15 · Follow rain and time
6. Worked example: calculate rainfall volume across unequal areas
Consider a fictional storm over two non-overlapping areas. Area A is 1 square kilometre and receives 10 millimetres of rain. Area B is 3 square kilometres and receives 30 millimetres. Assume each stated depth is uniform within its area for this model.
One square kilometre is 1,000,000 square metres. Ten millimetres is 0.01 metres, so A receives 10,000 cubic metres. B receives 3,000,000 × 0.03 = 90,000 cubic metres. Total modelled rainfall volume is 100,000 cubic metres.
Across the combined 4-square-kilometre area, the equivalent mean depth is 100,000 ÷ 4,000,000 = 0.025 metres, or 25 millimetres. The simple average of 10 and 30 is 20, which ignores the unequal areas.
This is a rainfall-input calculation. It does not establish runoff volume, flood level or peak flow. The useful learning is to weight the depths by the area each represents and to keep input volume separate from the catchment’s response.
| Fictional area | Area | Rain depth | Rainfall volume |
|---|---|---|---|
| A | 1 km² | 10 mm | 10,000 m³ |
| B | 3 km² | 30 mm | 90,000 m³ |
| Combined | 4 km² | 25 mm area-weighted mean | 100,000 m³ |
CHAPTER 7 OF 15 · Follow rain and time
7. Worked example: a volume does not specify its timing
Suppose a fictional outlet record totals 36,000 cubic metres over a six-hour interval. The mean flow over that interval is 36,000 ÷ 21,600 = approximately 1.67 cubic metres per second.
The six hours contain 6 × 60 × 60 = 21,600 seconds. The unit conversion is necessary because the requested rate is per second. Keeping hours in the denominator would describe a different unit.
The mean does not tell us the highest flow, when the peak occurred or how quickly the water rose. A steady series and a strongly varying series can have the same interval total. A time record is needed for questions about the pattern.
Ask students to sketch two different fictional flow profiles with the same total area beneath the graph. Then identify which questions the total answers and which require the profile. The exercise connects catchment thinking with graphs and rates.
For a detailed worked route, read The Gold Standard of Watersheds | Runoff Hydrographs, Equal Volumes and Different Peaks.
CHAPTER 8 OF 15 · Connect land and people
8. Connect land activities with water quality
Water moving over or through land can carry material into receiving waters. EPA’s explanation of nonpoint-source pollution describes diffuse inputs associated with runoff and other pathways. The source, route and receiving environment belong in one investigation.
A visible litter collection, a soil-control activity and a water-quality measurement describe different parts of that chain. Each can be useful, but completing one activity does not establish the condition of the entire catchment.
Potential sources can include several land uses, and the relevant contribution may vary through time. A downstream result alone rarely identifies one cause without additional evidence about locations, conditions and pathways.
For students, make a source-pathway-receiver diagram from supplied information. Mark measured connections differently from proposed ones. This helps a learner recognise a plausible explanation while keeping the next evidence question open.
Source reading: US EPA — Nonpoint Source Pollution
A lower concentration does not by itself establish removal between stations. Reconciling Material Loads Between Nested Gauges converts original records into transported masses, restores reach storage and timing, and tests the limits of a local-contribution inference.
CHAPTER 9 OF 15 · Connect land and people
9. Read urban catchments through the actual system
An urban catchment includes surfaces, drainage structures, buildings, open spaces and receiving waters. Its water relationships depend on both the land and the managed network. A neighbourhood boundary and a drainage boundary may serve different purposes.
PUB’s local-catchment and ABC Waters resources provide a Singapore route into these connections. They show why land, waterways, water collection and public spaces are useful to understand together.
Use current official maps and project information for an actual site. A photograph can introduce a place and show visible features, while the drainage arrangement may require a different source. The relevant map should identify its date and purpose.
A practical learning task starts with one approved public location and a supplied drainage plan. Identify the receiving water, land uses and questions for the responsible sources. The aim is a clear understanding of the relationship, rather than an unofficial infrastructure survey.
Source reading: PUB — Water from Local Catchment · PUB — About ABC Waters
CHAPTER 10 OF 15 · Connect land and people
10. Include habitats, storage and connected responsibilities
Rivers, wetlands and reservoirs can sit within a catchment and interact with its water pathways. Ecology asks about living relationships; reservoir and flood-risk engineering ask different questions about assets, conditions and intended performance.
The same intervention can have effects beyond its immediate boundary. A catchment perspective asks what happens upstream, downstream and over time. It helps reveal relationships that a narrow project outline may omit.
Management responsibilities may also cross administrative boundaries. Identify who owns the relevant action and who needs the information. A complete catchment map does not automatically create a complete governance arrangement.
For learners, add a responsibility layer to the water-pathway diagram. Keep physical connections and organisational duties distinguishable, then show where they meet. That makes a systems explanation easier to use in a practical discussion.
CHAPTER 11 OF 15 · Connect land and people
11. Choose monitoring that can answer the question
A useful monitoring plan begins with the decision or learning question. Rainfall, water level, flow and water quality are related observations, but they are not interchangeable measurements. Each needs a location, time basis and method.
Compare records on compatible terms. Check the contributing area, observation period, missing data and the relevant conditions. A different station or changed method can affect the meaning of an apparent trend.
Maps are evidence too. Their boundary definitions, resolution and versions matter. A more detailed dataset can change a delineated area without proving that the landscape physically changed by the same amount.
For students, create a small metadata box beside each graph or map: what, where, when, unit, source and limitation. That modest addition preserves the meaning of the record and makes another person’s review much easier.
CHAPTER 12 OF 15 · Connect land and people
12. Build a catchment explanation from land to outlet
Begin by identifying an outlet and the contributing land. Repair confusion about nested areas before calculating totals. Then work the rainfall example, naming the area and depth conversions at each step.
Next, connect rainfall input with pathways, storage and the outlet’s time record. Explain why an interval average cannot establish a peak and why a quality result needs a source-and-pathway investigation.
For extension, compare catchments through land, monitoring and management responsibilities. Use Hydrology, Water Resources Engineering, Flood Risk, Ecology and the other branches to deepen the question that actually matters.
The gold standard of watersheds is the ability to connect a local observation with the land and processes supporting it. Follow the water, state the boundary and keep every map and calculation attached to the question it can answer.
Follow the existing ecosystem guide closest to your question. The branches below connect the wider subject with particular methods, activities and responsibilities.
Read the land and water
The Gold Standard of Hydrology — Water movement, storage and observation.
The Gold Standard of Rivers — River processes and their evidence.
The Gold Standard of Rainfall — Rainfall measurements and interpretation.
The Gold Standard of Physical Geography — Surface processes and landscapes.
Connect receiving environments
The Gold Standard of Reservoirs — Reservoirs and their intended functions.
The Gold Standard of Wetlands — Wetland water regimes and ecological relationships.
The Gold Standard of Ecology — Ecology across connected environments.
The Gold Standard of Water Security — Dependable water access and resilience.
Follow management and engineering
The Gold Standard of Water Resources Engineering | From Catchment to Community — Water resources from catchment to community.
The Gold Standard of Flood Risk Engineering | Catchments, Exposure and Resilient Decisions — Catchments, exposure and flood-risk decisions.
The Gold Standard of Erosion Control Engineering | Keeping Soil Out of Waterways — Keeping soil out of waterways.
The Gold Standard Of Water Quality Monitoring — Traceable quality measurements.
What is the gold standard of watersheds?
Connecting contributing land, water pathways and a stated outlet through suitable maps, observations and reasoning.
Are watershed and catchment always separate concepts?
They are often used interchangeably; read the definition and scale used by the source.
Can a large basin contain smaller catchments?
Yes. The outlet and nested boundaries determine what is included.
Should nested catchment areas be added together?
Only after checking overlap and inclusion; a larger total may already contain the smaller areas.
Does rainfall volume equal immediate river runoff?
No. Pathways, storage, conditions and timing affect the response.
Does an average flow establish the maximum?
No. The time record is needed for the peak and its timing.
These institutional resources support the concepts and reading routes. Follow the current official information for programmes, activities and services, and preserve the source and date when using a record.
USGS — Watersheds and Drainage Basins
USGS — Understanding Hydrologic Unit Codes
USGS — Rivers and the Landscape
US EPA — Nonpoint Source Pollution
PUB — Water from Local Catchment
Keep the learning usable
Return to The Gold Standard of Education to connect knowledge, explanation and judgment across subjects.
For a concrete Mathematics learning route, explore Secondary 1 Mathematics Tutor Clementi — small-group tutorials. Begin at the first unstable step, make the relationship clear and practise applying it under changed conditions.
From catchment processes to a management plan
The Gold Standard of Watershed Management. Compare outcomes, intervention pathways and evaluation in the applied guide.