
A mark of 82 tells us what somebody scored, but it does not tell us how unusual the mark is among comparable results. A z-score answers a more specific question: how many standard deviations above or below a defined reference mean does this observation lie?
The gold standard of z-scores is not an impressive decimal. It is a carefully chosen reference, an explicit formula and an interpretation that respects uncertainty, distribution shape and purpose. Standardising an observation does not make its distribution normal or turn a potential outlier into a proven mistake.
This twenty-four-chapter root connects Statistics, Probability and Metrology. All numerical values in the worked examples are hypothetical learning data.
Choose your reading route
All chapters remain expanded. You can jump directly to the calculations or explore the full index.
Chapter index · Worked statistics checks · Gold Standard connections
Complete chapter index
Define and choose a reference · Chapters 1–5
Interpret the standardised number · Chapters 6–10
Protect statistical inference · Chapters 11–15
Use z-scores responsibly · Chapters 16–20
Work the numerical examples · Chapters 21–24
CHAPTER 1 OF 24 · Define and choose a reference
1. Define a z-score with a named reference
A z-score describes how far an observation lies above or below a chosen mean, measured in units of a chosen standard deviation. For a population reference it is z=(x−μ)/σ, where μ is the population mean and σ the population standard deviation. For a data sample an analogous standardised observation may be written (x−x̄)/s.
The formula is simple; selecting the right reference is not. A student’s score, laboratory reading or machine output can have different z-scores under different comparison populations. Report the observation, reference mean, spread and units before interpreting the dimensionless result.
CHAPTER 2 OF 24 · Define and choose a reference
2. Read positive, negative and zero values
A positive z-score means the observation is above the selected mean; a negative value means it is below, and zero means it equals the mean. The sign does not automatically express whether an outcome is desirable. A shorter waiting time and a higher examination mark can have opposite real-world meanings.
A z-score of −2 does not mean minus two marks or a negative physical quantity. It means the observation lies two reference-standard-deviation units below the selected centre. Read the underlying outcome and its direction alongside the standardised number.
CHAPTER 3 OF 24 · Define and choose a reference
3. Understand what standard deviation measures
Standard deviation is a scale of spread around a mean, not an assertion that all observations lie within one or two units. Population and sample versions use different denominators in their conventional definitions. A dataset’s spread depends on the data and inclusion criteria.
A narrow reference distribution can give a large absolute z for a modest raw difference, while a broad distribution can make a large raw difference yield a small z. This is why standardisation supports comparisons but cannot erase uncertainty about how the reference was obtained.
CHAPTER 4 OF 24 · Define and choose a reference
4. Choose the reference population before calculation
A comparison population should answer the real question. An age-specific clinical reference, a particular examination cohort and a production line’s historical measurements are distinct baselines. Pooling them can create misleading z-scores, especially if the groups have different means or spreads.
State whether the reference is current, historical or externally published, and whether relevant attributes have been controlled or stratified. An apparently high score against a weakly matched population may say more about the baseline than about the observation.
CHAPTER 5 OF 24 · Define and choose a reference
5. Distinguish population sigma from sample s
The conventional population formula uses σ calculated over the population of interest. A sample estimate often uses s, commonly with an n−1 denominator for variance when estimating a population variance from independent observations under the usual framework.
Switching from population to sample spread changes numerical results, especially with small n. It does not change the underlying raw observations. Use the symbol and denominator that matches the stated analysis, and keep rounding visible.
CHAPTER 6 OF 24 · Interpret the standardised number
6. Calculate from raw observations transparently
Write x, the mean and standard deviation before substituting into z=(x−mean)/SD. Subtract in the same measurement units and only then divide. The result has no units because the numerator and denominator share the same dimension.
For a fictional score x=82, reference mean=70 and SD=6, z=(82−70)/6=+2. A reader can check that the raw difference is 12 points and the spread is six points. The final +2 does not tell us a percentile without an additional distribution assumption.
CHAPTER 7 OF 24 · Interpret the standardised number
7. Compare different measurement scales with care
Standardisation can compare how unusual measurements are within distinct reference groups. A test score of 80 and a speed of 80 kilometres per hour cannot be directly compared in raw units, but their respective z-scores can indicate distances from their own references.
The underlying meanings remain different. A two-standard-deviation increase in income, performance, laboratory concentration or environmental exposure is not an equal biological or economic effect. Standardisation is a scale change, not an ethical ranking or causal adjustment.
CHAPTER 8 OF 24 · Interpret the standardised number
8. Know what standardisation does not do
Subtracting a mean and dividing by a nonzero standard deviation shifts and rescales a dataset. It does not automatically turn a skewed, multimodal or heavy-tailed distribution into a normal bell curve. The original shape remains under a positive linear transformation.
This distinction matters because people often move directly from ‘z=2’ to a normal-distribution tail area. A normal probability needs an assumed or validated distribution model. If the data are strongly skewed, a rank or a suitable transformation may answer a question better.
CHAPTER 9 OF 24 · Interpret the standardised number
9. Read a z-score and percentile as different ideas
A percentile describes a position within a distribution or ranking convention. A z-score describes standard-deviation distance from a reference mean. The same z can correspond to different percentiles under different distribution shapes.
In a standard normal model, z=1 has a cumulative probability of about 0.8413. That is a model result, not proof that exactly 84.13% of an arbitrary real dataset lies below one SD above its mean. Clearly label modeled and empirical percentiles.
CHAPTER 10 OF 24 · Interpret the standardised number
10. Use the empirical rule only under a suitable shape
For data that are approximately normal, the familiar 68–95–99.7 rule describes the approximate proportions inside one, two and three standard deviations of the mean. It is not a universal guarantee for any distribution with a finite mean and variance.
Check histograms, normal probability plots and study context. NIST’s statistical handbook describes the normal cumulative distribution and its use for probability calculations. For irregular data, show the observed fraction directly rather than imposing a bell curve.
CHAPTER 11 OF 24 · Protect statistical inference
11. Distinguish an individual z from a statistical z test
An observation-level z-score standardises a particular value. A z test statistic usually standardises an estimator or difference by its standard error under a specified null hypothesis. Their denominators are not generally identical, even though both may be denoted z.
For example, a sample mean can be compared with a hypothesised mean using (x̄−μ₀)/(σ/√n) when assumptions support that standard error. This is different from (x−μ)/σ for one observation. Describe the estimand, sampling design and assumptions before reporting a p-value.
CHAPTER 12 OF 24 · Protect statistical inference
12. Understand uncertainty about the reference
Estimated means and standard deviations are not perfectly known when derived from finite samples. A z-score computed against estimated parameters inherits their uncertainty. Values can vary if the reference sample, time window or data cleaning rule changes.
A precise two-decimal score is not automatically a precise statement about someone’s position in a population. Report reference sample size and evidence for how well it represents the target group where that uncertainty could affect decisions.
CHAPTER 13 OF 24 · Protect statistical inference
13. See why a high absolute z is not an automatic error
An observation far from the sample mean may be an error, a rare genuine event or evidence that the model is inappropriate. Removing a record merely because |z| exceeds a convenient threshold can bias results, particularly when the observation is scientifically important.
The NIST outlier-detection guidance distinguishes flagging observations from determining they are errors. Investigation may include checking original records, instruments, unit conversions and data-generation processes before deciding how a value should be treated.
CHAPTER 14 OF 24 · Protect statistical inference
14. Understand masking and small-sample limitations
An extreme observation can pull the sample mean upward and inflate the sample SD, reducing its own ordinary z-score. Several unusual observations can mask one another. In a small dataset, there are mathematical limits on how large internally studentised sample z-scores can be.
This means |z|>3 is not a universal outlier test and may miss striking values. Use graphical checks, domain reasoning and validated procedures. NIST explicitly warns that sequential outlier testing and small sample sizes can mislead.
Why a Same-Sample Score Has a Finite Maximum proves the sharp ceiling, tests impossible cutoffs and contrasts variance conventions, leave-one-out distances and group masking with original worked examples.
CHAPTER 15 OF 24 · Protect statistical inference
15. Learn the median-based modified z-score
A modified z-score replaces the mean-and-SD sensitivity with a median and median absolute deviation, often using M=0.6745(x−median)/MAD when MAD is nonzero. The constant makes the scale comparable to the standard deviation for normally distributed data under the conventional definition.
Modified scores are useful for flagging potential extremes in contaminated data, but they also depend on distributional context and can be undefined when MAD=0. NIST documents a commonly used potential-outlier threshold of |M|>3.5, not a proof of data corruption.
CHAPTER 16 OF 24 · Use z-scores responsibly
16. Keep sample standardisation separate from cross-validation
When standardising data for prediction, parameters should generally be estimated on the training set and then applied unchanged to validation or test data. Computing the mean and SD from all observations before validation can leak information about held-out records into the modelling pipeline.
Grouping and time dependence complicate the issue. If future measurements are being predicted, a future-derived mean is not available at decision time. Preserve the fitted transformation with the predictive model so deployment uses the same baseline.
CHAPTER 17 OF 24 · Use z-scores responsibly
17. Differentiate measurement variation from real-world change
A z-score can rise because the measured value increased, because the reference mean decreased or because the reference SD became smaller. Trend discussions should show the raw values and reference parameters, especially when scoring methods are periodically updated.
A stable z does not prove no raw change occurred; both the observation and the reference can move together. Always ask which part of the formula changed before attributing a new score to an intervention or behaviour.
CHAPTER 18 OF 24 · Use z-scores responsibly
18. Use z-scores in quality control with a declared rule
Industrial and laboratory monitoring sometimes use standardised deviations from assigned or target values. Such scores can help flag unusual results relative to agreed performance criteria. But the correct reference and scale may come from proficiency testing rather than the sample mean and sample SD.
NIST’s ISO 13528 z-score documentation describes assigned values and standards for proficiency assessment. A warning or action signal is a procedural interpretation under a particular standard, not a general law that every observation beyond two units is wrong.
CHAPTER 19 OF 24 · Use z-scores responsibly
19. Understand the special case of zero spread
If every reference observation is identical, its calculated SD may be zero. The ordinary z-score division is then undefined, regardless of whether the new observation matches the common value. Reporting infinity or zero without an explicit alternate convention would be misleading.
Check the reason for zero spread: exact measurement resolution, data coding, a truly constant process or too few observations. Choose another meaningful comparison method rather than forcing an arithmetic result where the denominator does not exist.
CHAPTER 20 OF 24 · Use z-scores responsibly
20. Worked example: population versus sample SD
Take the fictional dataset {2,4,6,8,10}. Its mean is 6 and the sum of squared deviations is 40. Population SD is √(40/5)=√8≈2.828, while sample SD is √(40/4)=√10≈3.162.
The largest observation has population-based z=(10−6)/2.828≈1.414 and sample-based z=(10−6)/3.162≈1.265. The observations did not change. The denominator convention changed, and the report must name it.
CHAPTER 21 OF 24 · Work the numerical examples
21. Worked example: a skewed score and a normal percentile
In a fictional external reference with μ=50 and σ=10, an observation x=65 gives z=(65−50)/10=1.5. Under an additional standard normal model, the cumulative probability at z=1.5 is about 0.9332, or 93.32%.
If that reference distribution is skewed, the 93.32% statement may be wrong. Report the 1.5 SD distance separately from any tail probability, and use empirical cumulative data when the application warrants it.
CHAPTER 22 OF 24 · Work the numerical examples
22. Worked example: modified z exposes an extreme
For the original fictional sample {3,4,4,5,30}, the median is 4 and the median absolute deviation is 1. The modified z for 30 is M=0.6745(30−4)/1=17.537.
The sample mean is 9.2 and sample SD is approximately 11.65, giving ordinary internally standardised z=(30−9.2)/11.65≈1.79. The comparison shows how an extreme value can change the sample mean and scale. It is a reason to investigate, not an instruction to delete the value.
CHAPTER 23 OF 24 · Work the numerical examples
23. Worked example: calculate a test statistic correctly
Suppose an artificial population standard deviation σ=12 is treated as known, a sample of n=36 independent observations has mean 104, and the null mean is 100. The standard error is 12/√36=2, so the hypothetical z-test statistic is (104−100)/2=2.
This is not the individual z-score of a measurement x=104, which would instead use the population SD 12 and yield 1/3. A p-value would also need the hypothesis direction and legitimate distributional assumptions.
CHAPTER 24 OF 24 · Work the numerical examples
24. Apply the z-score standard without overclaiming
The gold standard of z-scores is the traceable chain: observation, chosen reference, mean, standard deviation, correct denominator, possible uncertainty and justified interpretation. A z-score is useful because it gives an interpretable relative scale; it is limited because it does not repair biased measurement, inappropriate populations or non-normal tails.
Continue with Statistics, Probability, Experimental Design and Metrology. The reasoning reflects Learning Transfers into Life.
Evidence table: similar notation, different questions
| Statistic | Formula or definition | Interpretation boundary |
|---|---|---|
| Population-referenced observation z | (x−μ)/σ | Individual distance under a specified reference |
| Internally sample-standardised score | (x−x̄)/s | Depends on the same sample’s centre and spread |
| Hypothesis z test | (estimate−null)/SE | Sampling statistic with a specified null model |
| Median-based modified z | 0.6745(x−median)/MAD | Robust flagging when MAD is nonzero |
Worked checks with fictional data
| Observation | Calculation | Correct reading |
|---|---|---|
| x=82, μ=70, σ=6 | (82−70)/6=2 | Two SD above named mean |
| {2,4,6,8,10}, mean 6 | SDpop=√8; SDsample=√10 | Different denominators |
| x=10, mean 6 | zpop≈1.414; zsample≈1.265 | Same observation, different scale |
| {3,4,4,5,30} | median 4, MAD 1, M=17.537 for 30 | Potential extreme, not proven error |
| x̄=104, μ₀=100, σ=12, n=36 | SE=2; test z=2 | Statistic for a sample mean |
Connected Gold Standard reading
| Purpose | Published eduKate roots |
|---|---|
| Interpret distributions | Statistics · Probability |
| Experiments and quality | Experimental Design · Quality |
| Measurement and mathematics | Metrology · Mathematics |
| Transfer | Learning Transfers into Life |
Frequently asked questions
What is a z-score?
The signed number of reference standard deviations between an observation and a chosen mean.
Is z=2 always the 97.7th percentile?
Only approximately under a standard normal model; an arbitrary real distribution may have a different percentile.
Does a negative z mean something is bad?
No. It only means a value lies below the specified reference mean.
Does standardisation make data normal?
No. Subtracting a mean and dividing by SD does not change the distribution’s shape into a bell curve.
Should every observation above three SD be deleted?
No. Examine the measurement and model; an extreme may be genuine or a data error.
What if the SD is zero?
The usual z-score is undefined and requires another meaningful method.
Is a z test the same as an individual z-score?
No. A test usually divides an estimator’s difference by its standard error, which has a different interpretation.
How do I choose the comparison group?
Select a documented reference that matches the question, population and period being evaluated.
Verified scientific and technical sources
Official reference routes checked 24 October 2026. NIST provides the definitions and cautions about internally computed and modified z-scores. All examples are original teaching calculations.
NIST — Standardise Variables — Institutional or first-party reference on standardisation, distributional interpretation and measurement controls.
NIST — Detection of Outliers and Z-Scores — Institutional or first-party reference on standardisation, distributional interpretation and measurement controls.
NIST — ISO 13528 Z-Scores for Proficiency Assessment — Institutional or first-party reference on standardisation, distributional interpretation and measurement controls.
NIST — Exploratory Data Analysis Handbook — Institutional or first-party reference on standardisation, distributional interpretation and measurement controls.
NIST — Normal Probability Distribution — Institutional or first-party reference on standardisation, distributional interpretation and measurement controls.
Penn State STAT — Standard Normal Distribution — Institutional or first-party reference on standardisation, distributional interpretation and measurement controls.
SciPy — zscore — Institutional or first-party reference on standardisation, distributional interpretation and measurement controls.
scikit-learn — StandardScaler — Institutional or first-party reference on standardisation, distributional interpretation and measurement controls.
NIST — Sample Standard Deviation — Institutional or first-party reference on standardisation, distributional interpretation and measurement controls.
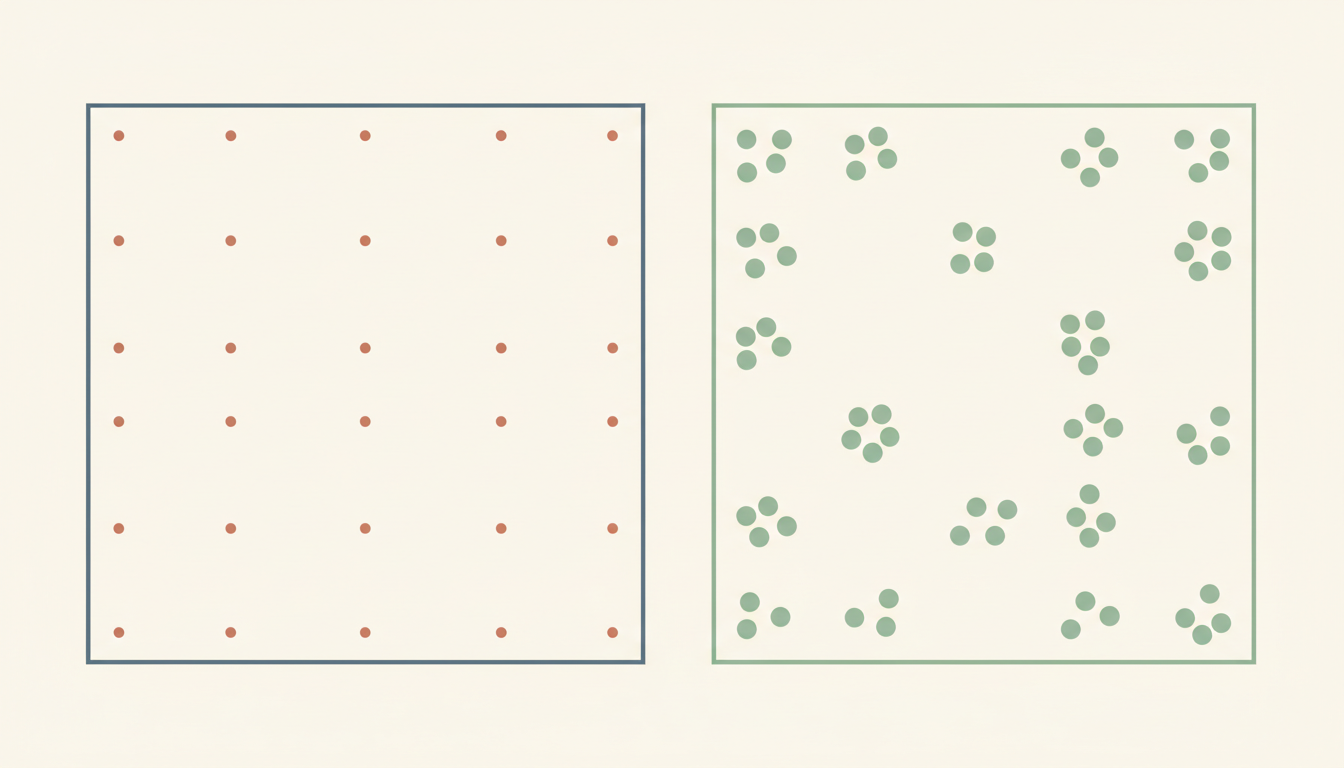
Featured illustration: eduKate’s original conceptual statistics cover contrasting clustered and dispersed survey observations. It illustrates the importance of reference distributions, not a dataset used for the fictional z-scores.