
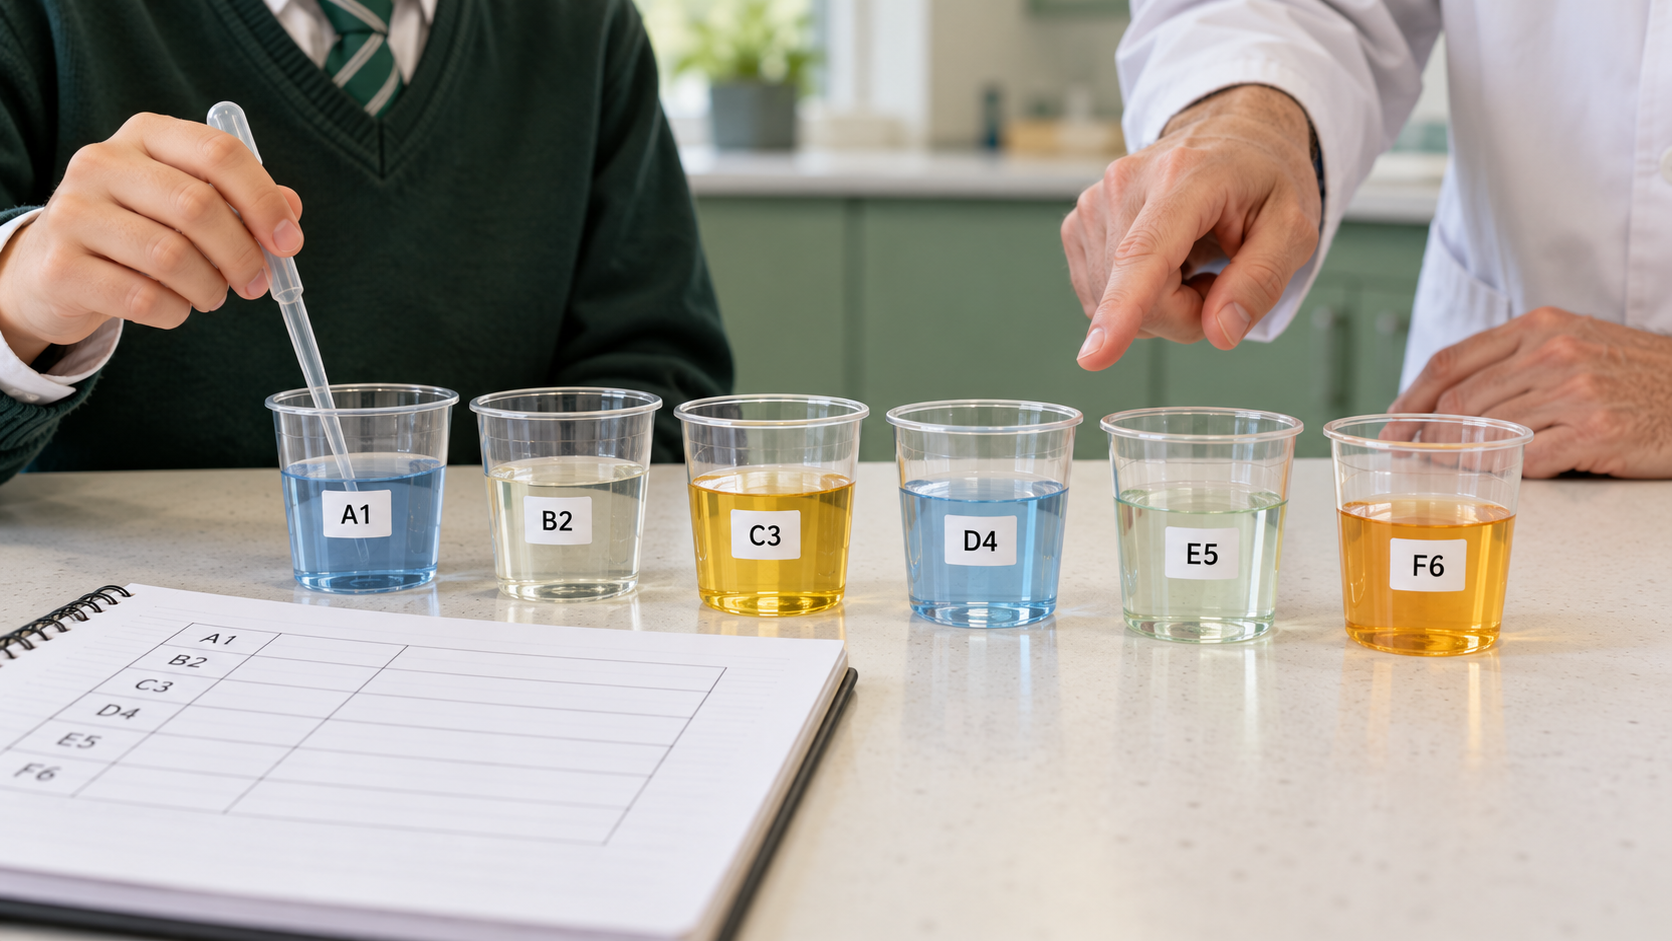
Toa Payoh G3 Chemistry students can understand reaction rate by distinguishing how quickly substances react from how much product eventually forms. Collision theory explains why greater concentration, higher gas pressure, smaller solid particles and higher temperature can change reaction speed under suitable conditions. A catalyst provides a different reaction pathway with lower activation energy, but it does not mean atoms are created or the final quantity of reactant magically increases.
The published 2027 Singapore-Cambridge SEC G3 Chemistry syllabus K324, Topic 10 Rate of Reactions, explicitly covers concentration, pressure, particle size, temperature, catalysts including enzymes, lower activation-energy pathways, investigation methods and interpretation of rate data. This guide uses theoretical experiments, fictional graphs and original calculations without instructing students to mix chemicals or collect gases at home. Other subject levels and combined Science have their own scope, so check the actual syllabus before assigning every extension.
- Rate describes change in a measured quantity per unit time
- Do not confuse a faster reaction with a larger final yield
- Successful reacting-particle collisions require suitable conditions
- Greater concentration often increases collision frequency
- Greater pressure for gases can increase collision frequency
- Smaller pieces of a solid expose greater surface area
- Higher temperature changes particle speed and effective collisions
- Catalysts can lower activation energy through an alternative pathway
- Enzymes are biological catalysts with condition-dependent behaviour
- Read graph axes, units, gradient and plateau carefully
- Plan a fair investigation by changing one relevant variable
- Choose a measurement method suited to the reaction and products
- Use correct experimental controls and never improvise hazardous reactions
- Connect a claim about rate directly with relevant collision reasoning
Definition lock: rate is not total yield
A reaction’s rate describes change per unit time. Collision theory relates concentration, gas pressure, solid particle size and temperature to successful reacting collisions. Catalysts can lower activation energy by offering an alternative pathway. The full 2027 SEC G3 K324 Topic 10 syllabus asks students to interpret rate data and evaluate fair investigations, but this article does not authorise chemical practicals.
Part One: measurable rates and the collision model
A reaction rate measures how quickly change occurs
Rate describes the change in an observable quantity over a measured time interval. For a reaction producing gas, one possible metric is the volume of gas collected per second under defined conditions.
A theoretical experiment records twenty cubic centimetres of gas produced in ten seconds. The average volume-production rate over that interval is two cubic centimetres per second, not twenty cubic centimetres.
An increasing gas-volume graph can show product accumulating while the reaction is occurring. Its gradient represents the rate of volume change, with the units supplied by the axes.
Students sometimes report a quantity without dividing by time, or apply the same interval to two different experiments even when their measurement times differ.
Ask what changed, how much it changed and how long the change took. Rate is meaningless without both a measured quantity and a time basis.
Rate and total product answer different questions
A reaction that reaches a plateau quickly may be faster than one that approaches the same plateau slowly. If both began with equivalent available reactants under suitable conditions, their total product could still be equal.
Imagine two fictional gas-volume curves both finishing at sixty cubic centimetres. One reaches the plateau after thirty seconds and another after sixty. The faster experiment has a steeper early gradient but not more final gas.
Students often conclude the faster curve produced more gas because it rose more sharply at the start. They should check the final plateau before comparing total amounts.
A different maximum volume can indicate a difference in quantities of reactants or another relevant condition rather than simply a change in reaction rate.
The best explanation distinguishes initial rate, elapsed completion time and final product yield. Each can change separately depending on the experimental setup.
Collision theory connects particles with observed rate
Collision theory explains reactions through encounters between reacting particles. Collisions alone are not sufficient; a successful event needs the appropriate energy and orientation where relevant to the molecular mechanism.
A higher number of encounters per second may increase the reaction rate, provided a suitable fraction of them are successful. This is why conditions affecting particle proximity can matter.
Students may assume that every particle collision creates a product. In reality, many collisions do not produce the necessary rearrangement.
The collision model is a simplification useful for interpreting rate trends. A full reaction mechanism can be more complicated than two particles striking one another in a textbook drawing.
Ask how the named experimental change affects collision frequency or effectiveness, and then connect that effect to the measured rate. A generic sentence that particles move faster may not answer every factor.
Concentration influences how often particles meet
In a suitable solution reaction, a higher concentration means more solute particles are present per unit solution volume, increasing opportunities for collisions with other reacting species under comparable conditions.
An imagined pair of trials uses equal solution volumes and the same type of reaction but different reactant concentrations. The higher-concentration case may produce a faster initial reaction if other factors remain comparable.
Some pupils write that the particles become individually bigger when concentration increases. Concentration changes how many particles occupy a given volume, not their atomic identity.
The increased rate does not automatically prove more final product when different limiting-reactant quantities or excess components are involved. The precise setup matters.
Explain the microscopic chain: more particles per unit volume, more frequent potentially effective collisions, and a higher rate under suitable conditions.
Gas pressure can affect collision frequency
For gaseous reactants, increasing pressure by reducing the available volume at suitable temperature can bring particles closer together and increase collision frequency. This can raise the rate for appropriate gas reactions.
A student may transfer the same explanation directly to every liquid mixture without examining which particles or phases the question describes. The pressure effect is specified for gases in the syllabus.
An idealised model shows the same number of gas particles in a smaller container. The number of particles does not increase simply because the pressure increases through compression.
Pressure changes may also be accompanied by other factors in actual systems. A fair theoretical comparison must state which conditions remain constant.
Ask the pupil to distinguish number of particles, spacing and frequency of encounters. That is the causal relationship rather than a memorised claim that pressure always makes things faster.
Particle size changes exposed solid surface
For a solid reacting with a suitable surrounding substance, smaller pieces of the same total solid mass can have more total surface area exposed to the other reactant.
A fictional comparison shows one large block and several small pieces with equal total mass and the same chemical composition. More accessible surface can allow more frequent interactions at the solid boundary.
Students sometimes say powder reacts faster because every particle is chemically stronger. The explanation concerns exposed surface area and frequency of successful collisions, not a stronger substance.
The final amount of product may remain the same if the same amount of limiting reactant is completely consumed under both conditions.
Identify which physical property changed and which stayed constant. Without equal total reactant mass, the comparison may mix surface-area and quantity effects.
Surface area and volume are not interchangeable
A solid’s surface is the interface where its constituents can interact with a surrounding reactant. Its volume describes occupied space. Two solids can have equal volume but different surface-area-to-volume ratios.
Dividing a suitable solid into many smaller pieces can increase the total exposed surface while preserving its overall mass under the idealised model.
Students may infer a bigger total surface automatically means more solid was added. The same total substance can be redistributed into smaller pieces without changing its quantity.
Do not create powders from unknown chemicals or crush hazardous tablets to test the idea. An original drawing with equal masses is sufficient for school reasoning.
Ask how many regions are available for collision and why that matters to the time required for reaction progress.
Temperature changes particle energy
Higher temperature generally increases the average kinetic energy of reacting particles. More particles have sufficient energy to overcome the relevant activation-energy barrier in a suitable chemical reaction.
Collision frequency can also increase, but simply saying the particles move faster does not fully capture why the successful-collision fraction changes.
Students should not claim temperature always changes the final amount of product proportionally to its degree value. Rate, equilibrium and decomposition can involve different considerations.
A fictional experiment may compare identical reactants at two teacher-controlled temperatures, recording faster gas production at the higher temperature. The explanation uses collision energy under the stated conditions.
Keep the teaching on paper. Heating chemical mixtures can cause burns, fumes or violent reactions and requires trained laboratory handling.
Activation energy is an energy barrier
Activation energy refers to the minimum energy barrier associated with the reaction pathway. A useful profile diagram shows reactants, a higher-energy transition region and products.
A pupil may think activation energy is the total heat released by a reaction. The barrier and the overall energy change between reactants and products are distinct quantities.
An exothermic reaction can still require activation energy to begin. A process that releases energy overall is not automatically instantaneous under ordinary conditions.
Read the vertical energy axis and locate the reactant level and peak before calculating any activation-energy difference.
The central explanation is that a greater fraction of collisions can cross the barrier when particles have a higher energy distribution or an alternative lower-barrier pathway exists.
A catalyst can provide a lower-energy pathway
A catalyst increases the rate of an appropriate chemical reaction without being consumed overall in the ideal catalytic cycle. It can provide an alternative reaction pathway with a lower activation energy.
A pupil may state that a catalyst gives every reactant particle extra kinetic energy. The main syllabus explanation concerns changing the reaction pathway, not simply heating the mixture.
An energy profile can show two paths with the same starting and finishing energy levels but different peaks. The catalysed path has a lower activation-energy barrier.
The catalyst does not alter the balanced chemical identity of the overall reaction or create unlimited reactants. Its precise activity may depend on the conditions.
Ask whether the catalyst changes the final reactant–product energy difference in the simple diagram. It changes the pathway, not the initial and final energy states themselves.
Enzymes are biological catalysts
Enzymes catalyse particular biological reactions and can be important in digestion, metabolism and other life processes. They are generally selective in their action and dependent on suitable physical and chemical conditions.
Students sometimes assume all enzymes work best at the same temperature or remain effective after extreme heating. Different enzymes have different properties, and conditions can alter their structures or activities.
The 2027 K324 syllabus includes enzymes as catalysts within the rate topic, so candidates should understand why catalysis can affect the speed of a biological reaction.
A fictional enzyme-rate graph may rise toward a suitable range and decline under another condition. The graph should be interpreted from its provided axes rather than treated as a universal curve for every enzyme.
Do not cultivate microorganisms or handle biological specimens to create home demonstrations. Safe published data and teacher-approved materials can teach the concept.
A catalyst and a reactant play different roles
A reactant contributes to the net chemical transformation described by the balanced equation. A catalyst affects the reaction pathway and is regenerated overall in an ideal catalytic cycle, although intermediate steps can involve it.
A student may subtract the catalyst’s starting mass as though it were entirely converted into product. That would confuse a catalyst with a stoichiometric reactant in the simplified model.
Some catalytic substances can deteriorate or become poisoned under real conditions. The school definition does not mean every industrial catalyst remains perfectly effective forever.
The question may ask why the rate changes without changing the reaction’s theoretical limiting-reactant yield. A lower-barrier pathway can explain faster progress when reactant amounts remain unchanged.
Ask the learner to compare the catalyst’s role with the actual substances consumed and produced. Clear definitions support valid graph interpretations.
Part Two: reaction graphs, fair tests and catalytic pathways
Rate graphs need axes and meaningful units
A graph may place time in seconds on the horizontal axis and cumulative gas volume in cubic centimetres on the vertical axis. Its gradient then has units of cubic centimetres per second.
A learner who reads only the highest gas-volume value has described a quantity, not a rate. Two readings and their time interval are needed to calculate an average gradient.
An axis can begin at a value other than zero or use increments of five or ten. Read the printed scale before counting grid squares.
Students should state which sample or curve they are discussing. A steep curve labelled A is not automatically the result of higher temperature unless the experiment says so.
A well-supported graph answer reports the relevant interval, observed change, computed gradient and qualified interpretation in the actual conditions.
Initial rate and average rate can differ
The initial rate refers to the speed of reaction near the beginning, while average rate describes change over a specified finite interval. A curved product-volume graph may have a high early gradient and a smaller later one.
Imagine a hypothetical reaction producing thirty cubic centimetres in the first ten seconds and a further ten in the next ten. The average rates for those intervals are three and one cubic centimetre per second.
Students may calculate two cubic centimetres per second over the entire twenty seconds and claim the reaction had that rate at every moment. The average does not establish a constant instantaneous rate.
A tangent to a curve can indicate the rate at a chosen instant at a suitable mathematical level; its interpretation depends on correct axis scales.
Ask whether the task requests the first interval, a particular tangent or the entire observation period. These are different quantities even on the same graph.
The plateau means measured production has stopped increasing
When a cumulative gas-volume curve reaches a horizontal plateau, no additional measured gas volume is being recorded under the model at that interval. It does not by itself identify which reactant was limiting.
The experiment may have reached completion, a limiting reactant may have been consumed, or measurement conditions may have changed. The stated chemical context determines the explanation.
A student may call a horizontal product-volume graph a negative reaction rate. Its slope is zero during that interval, not negative.
Compare final plateau heights only after checking whether the starting quantities and products are comparable. Equal heights can coexist with very different initial rates.
An accurate conclusion says what the graph directly shows and what further chemical information would be needed to explain the cause.
Gas volume can be used as a progress measure
Some suitable reactions produce a gas, and a controlled laboratory can record its volume over time. The resulting table supports calculations of gas volume produced per unit time.
A fictional dataset records volumes of zero, twelve and twenty cubic centimetres at zero, five and ten seconds. The first five-second average is 2.4 cm³/s, while the second is 1.6 cm³/s.
Students should not assume that all reactions produce a gas or that a gas-volume method is appropriate when the products remain dissolved.
Measuring apparatus may have limits, and some gas can escape through an unsuitable setup. Those issues affect whether a result accurately measures the reaction.
The school exercise can use supplied data. There is no need to collect gas from improvised acid mixtures or heat unknown reactants at home.
Mass-loss measurements need a defined system
A reaction that releases gas from an open vessel may show a decreasing measured mass of the remaining apparatus and contents. This can provide data about the rate at which material leaves the weighed system.
A pupil should not claim that mass is destroyed merely because the balance reading decreases. The escaping gas remains matter, and a wider closed-system account would include it.
An imagined result may record a drop of two grams in forty seconds. The average recorded mass-loss rate is 0.05 g/s, with the rate defined by the measured change.
Not every reaction with gas formation can be measured accurately by this approach. Safety, scale and apparatus design matter in actual work.
Use the question’s stated measuring boundary and units. Do not confuse the negative slope of a mass-versus-time plot with a negative numerical speed of a chemical reaction.
Investigating one variable requires control
A fair reaction-rate comparison changes one selected factor, such as solution concentration, while keeping other relevant variables comparable: reactant type, temperature, solid form and measurement method.
If the more concentrated trial also uses powder while the dilute trial uses one large block, the faster result cannot confidently be attributed to concentration alone.
Students should identify independent, dependent and controlled variables as the actual school task requires. The words mean what is changed, measured and held comparable.
Repeatability and consistent timing support trustworthy data, but real chemical investigations should use teacher-approved materials and procedures.
A strong method evaluation names a concrete uncontrolled variable and explains how it could affect collision conditions, rather than merely saying the experiment was unfair.
Particle diagrams should represent the stated concentration
A particle model can depict a higher concentration with more solute particles inside equal comparison volumes, not by making each particle larger or changing its chemical identity.
A pupil who adds more dots but also makes the container three times larger may not actually represent a higher concentration. The relevant ratio of particles to volume must change.
When gas pressure is compared at constant temperature in an idealised model, the same particles may be shown in a smaller container, changing their spacing.
The diagram is symbolic and not a microscope photograph. Dot counts are teaching representations that should follow the stated assumptions.
Ask which factor changed—particle number, volume, temperature or size of solid pieces—before explaining how the collision opportunities are affected.
Catalysed and uncatalysed energy profiles
A reaction-energy diagram can compare pathways with and without a catalyst. Both begin from the same stated reactants and end at the same products, but the catalysed peak is lower.
The activation energy is represented by the energy difference between the reactant level and the relevant pathway peak, not the difference between product and reactant levels.
Students may draw products at a different energy merely because they added a catalyst. Under the same overall reaction, the catalyst changes the route, not the overall enthalpy change.
An effective explanation connects lower activation energy with more particles having sufficient energy for successful reaction at the same temperature.
Check that the diagram is labelled, and avoid presenting an arbitrary peak height as a measured industrial activation energy.
Enzymes have operating limits
Enzymes are biological catalysts whose activities depend on their structure and surroundings. Suitable temperature and pH can affect how efficiently they catalyse a particular reaction.
Students sometimes state that increasing temperature must always accelerate an enzyme reaction indefinitely. Excessively high temperatures can change protein structure and reduce activity for some enzymes.
A fictional activity graph may rise and then fall with temperature. It should be interpreted using the specific enzyme and conditions, not copied as a universal graph for every biological catalyst.
An enzyme being selective does not mean only one molecule in the entire organism can react with it; the chemistry must be described at an appropriate level.
Use teacher-provided data rather than culturing microbes or handling biological specimens in household experiments.
Industrial catalysts offer context but not universal results
Certain industrial processes use catalysts to reach useful reaction rates under controlled conditions. A catalyst can influence economic and energy considerations, but its effectiveness depends on the particular reaction and operating setup.
Students may infer that adding any catalyst to any mixture will make it react faster. A catalyst must be suitable for the reaction pathway, and contaminants or conditions can alter its activity.
The 2027 K324 syllabus asks students to recognise industrial uses and biological enzymes, not memorise every proprietary catalyst manufacturing process.
An industrial comparison may require data on yield, temperature, pressure or resource use before drawing a practical conclusion. Reaction rate alone cannot answer every question about sustainability.
A balanced answer states the benefit, identifies relevant limits and avoids invented commercial production figures.
Rate, equilibrium and yield must remain distinct
A faster reaction can reach a given conversion sooner without necessarily increasing the final stoichiometric amount possible from fixed limiting reactants. Yield concerns product amount, and equilibrium concerns another chemical relationship where relevant.
Students may assume a catalyst automatically increases the theoretical maximum product because the reaction occurs faster. The balanced equation and available reactants still set stoichiometric limits.
For reversible systems, catalysts can accelerate forward and reverse reactions, and they do not change the equilibrium position under the usual thermodynamic treatment.
These connections go beyond one simple rate graph but help prevent overclaiming when a problem mentions both rate and final amount.
Ask what the question measures: time, initial gradient, final quantity or equilibrium composition. Then select the explanation specific to that quantity.
Common mistakes and targeted corrections
One pupil may confuse the steeper graph with the taller final plateau; another may believe particle size changes the total mass of reactant. The corrections must address different misconceptions.
Ask the student to name the fixed quantities and the variable that changed. That often reveals why a claimed causal explanation is unsupported.
An error about temperature needs attention to kinetic energy and activation-energy distribution; an error about concentration needs attention to particle count per unit volume.
After teaching, offer a different graph or particle diagram without announcing the factor being tested. The pupil should derive the interpretation from its evidence.
Improvement appears when the explanation stays accurate under changed data and conditions, not when one memorised sentence is repeated.
A six-week Rate of Reactions programme
Week one distinguishes measured rate from cumulative product and reads axes and units. Week two builds the collision-theory account using particle diagrams.
Week three compares concentration and gas pressure; week four investigates particle size and temperature through teacher-provided results.
Week five introduces catalysts, enzyme limits and energy-profile diagrams. Week six evaluates unfamiliar experiments, mixed data tables and short causal explanations.
The programme should match the actual Chemistry or combined-Science syllabus. Practical handling remains under qualified school supervision, not home experimentation.
Progress means a student can select a relevant rate measure, interpret an unfamiliar curve, explain the condition through collisions and identify experimental limitations.
Frequently asked questions for Toa Payoh families
Does a faster reaction always produce more product? No. Rate and final quantity are different measurements; the final yield depends on reactants and the process.
Why do smaller solid pieces sometimes react faster? They can expose greater total surface area to another reactant, permitting more effective surface collisions under suitable conditions.
Does high temperature always mean an enzyme stays active? No. Enzyme activity depends on its structure and suitable conditions; excessive heat can reduce activity.
Does a catalyst give energy to all reactants? It can provide an alternative pathway with lower activation energy rather than simply heating every particle.
What does a horizontal final gas-volume graph mean? Recorded cumulative gas volume is no longer increasing in that interval; the chemical cause depends on the experiment.
Does 2027 K324 require reaction-rate investigation? Yes. Topic 10 includes suggesting a suitable method and interpreting experimental rate data.
Your next step: compare two curves
Use two fictional gas-volume–time graphs with labelled units. Calculate the average gas-production rate over the same initial interval, compare their plateau volumes, and explain what can and cannot be concluded about concentration, temperature or reactant amounts. Then identify one factor that should remain controlled in a fair experiment.
Official sources and related learning
SEAB — 2027 SEC G3 Chemistry Syllabus K324, Topic 10 Rate of Reactions
SEAB — 2027 G3 School Candidate Syllabuses
MOE — Full Subject-Based Banding
eduKateSG — Chemistry Mole Concept and Stoichiometry
eduKateSG — Chemistry Atomic Structure and Bonding
eduKateSG — Secondary Science Particle Model and Diffusion
eduKateSG — Chemistry Electrolysis and Electrodes
eduKateSG — Clementi Immutable Format Reference
Arrange a parent–student consultation
eduKateSG offers premium three-student small-group academic tutorials by appointment at 8 Fourth Avenue, Singapore 268674, near Sixth Avenue MRT. Families from Toa Payoh can bring one Chemistry rate graph and the student’s explanation to identify a particular misconception. The centre is not in Toa Payoh; confirm programme suitability and travel before arranging lessons. Chemical experiments require qualified school supervision.
Properly taught kids shine a bright light into the future.