
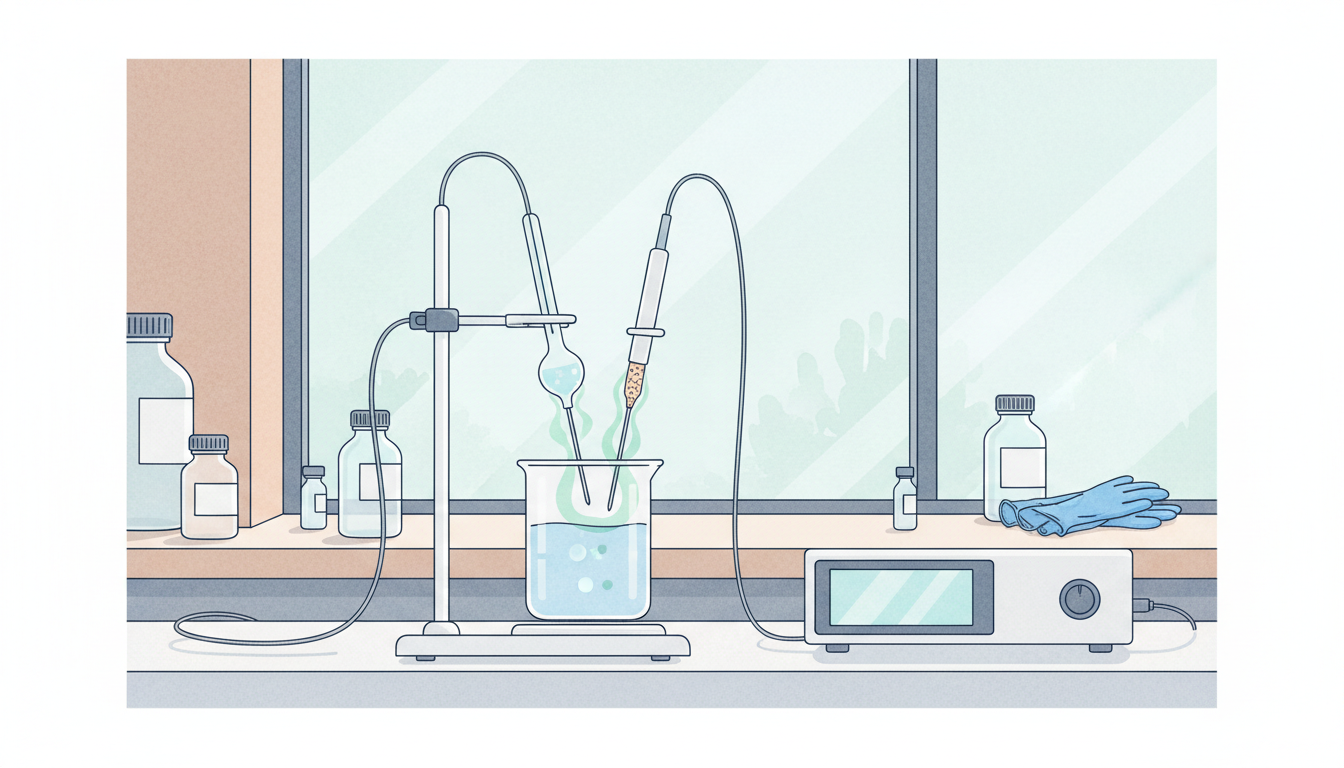
Did you know? A water sample can pass a laboratory test while a different tap, a different contaminant or a different hour remains untested. A good result is evidence—not a guarantee about every litre.
Quick answer: Water-quality monitoring fails when the sampling plan misses important hazards, measurements cannot be trusted, results are interpreted too broadly or verified problems do not lead to appropriate action. Protecting water means linking monitoring with risk management from source to consumer.
This guide explains sensors, sampling, laboratory results, data gaps and public communication in everyday language. It draws on WHO drinking-water guidance updated in June 2026 and selected US EPA materials, which must not be mistaken for universal laws.
The chain: hazard → sampling design → measurement → quality assurance → interpretation → regulatory decision → corrective action → public trust.
Choose your reading route
- 1. What does water-quality monitoring failure mean?
- 2. Follow the catchment-to-consumer evidence chain
- 3. Water quality is not one number
- 4. Sampling plans should be based on real risk
- 5. Why a convenient sampling location can be misleading
- 6. Rare contamination can hide between test dates
- 7. What is the difference between monitoring and surveillance?
- 8. Indicators can warn without identifying every cause
- 9. Sensor calibration and drift can create false confidence
- 10. A malfunctioning sensor is not proof the water is unsafe
- 11. Why sample collection is a scientific procedure
- 12. Chain of custody protects meaning as well as evidence
- 13. Laboratories need quality controls
- 14. Detection limits are not zero
- 15. Why one safe average can hide local problems
- 16. Lead at the tap illustrates the location problem
- 17. Microbial hazards require a different approach
- 18. Pressure changes and distribution failures matter
- 19. Weather and catchment events can change the risk map
- 20. Small communities face particular monitoring barriers
- 21. More dashboards cannot repair missing samples
- 22. How water-quality reports should explain results
- 23. When a violation report arrives too late
- 24. Regulatory compliance and public health risk are connected but distinct
- 25. Fictional case: the village with a beautiful dashboard
- 26. Fictional case: a sample with the wrong identity
- 27. A useful monitoring scorecard
- 28. Seven practical repairs for failing water monitoring
- 29. Five questions to ask when you see a water-quality claim
- Frequently asked questions
- Primary sources
What does water-quality monitoring failure mean?
Did you know? A water sample can pass a laboratory test while a different tap, a different hour or a separate hazard remains unchecked. One clean result is useful evidence, but it cannot certify the condition of every litre throughout a complex supply system.
Quick answer: Water-quality monitoring fails when relevant hazards are not measured at suitable places and times, samples or sensors are unreliable, results are misinterpreted, or verified problems do not lead to appropriate action and communication. Testing and keeping water safe are connected responsibilities, not the same activity.
Be precise about whether the issue concerns a source, treatment plant, distribution network, household plumbing, a recreational water body or another environment. Different standards and monitoring programmes apply.
Follow the catchment-to-consumer evidence chain
The World Health Organization’s June 2026 drinking-water guidance advocates protecting health through risk management across the entire supply system, from the water source to the consumer, together with independent surveillance.
A practical monitoring chain is known hazards → sampling plan → appropriate location and frequency → careful collection → laboratory or sensor measurement → quality checks → comparison with applicable standards → response → public communication.
Every handoff can fail. Good source-water testing may miss deterioration within distribution pipes. Accurate measurements may sit in a spreadsheet while nobody examines their trend. A correct warning may be sent to the wrong affected area.
Water quality is not one number
Water quality can concern microorganisms, chemicals, physical conditions and other parameters. Temperature, turbidity, pH or conductivity can help operators understand processes, but none alone proves the absence of every harmful contaminant.
A portable sensor reporting ordinary pH does not rule out a microbiological problem, and a clear-looking glass of water does not demonstrate chemical compliance. The relevant hazards depend on the catchment, treatment, distribution and building conditions.
Responsible monitoring begins with a list of plausible risks and specifies which measurement helps answer which question. ‘Clean water’ must never be treated as a single universal sensor reading.
Sampling plans should be based on real risk
A sampling programme needs appropriate sites, frequency, parameters and decision thresholds. A large distribution network, a small rural supply and a building with complex plumbing may face different risks and operational constraints.
WHO’s 2024 guidance for small water supplies recognises resource, management and technical challenges. It promotes context-appropriate health-based standards, water safety planning, sanitary inspection and independent surveillance.
More samples are not automatically better if they all come from convenient locations. Prioritise evidence that represents important exposure points and processes, while meeting the legal sampling requirements of the jurisdiction.
Why a convenient sampling location can be misleading
Imagine collecting from a tap next to a treatment facility because it is easy to reach. The result might describe water leaving treatment while telling little about a distant branch of the distribution system or a building with ageing plumbing.
Different hazards may require measurements at sources, treatment works, reservoirs, network points or selected consumer taps. The appropriate sampling design depends on what the test is meant to detect and the applicable rules.
Before reporting that a community’s water is safe, ask which water system, which locations and which period the evidence actually represents.
Rare contamination can hide between test dates
Water conditions change with rainfall, flooding, operations, maintenance, pressure events and failures. A sample is collected at a particular moment; it is not continuous observation of every possible change.
Sampling frequency should reflect the hazard and operational context, with additional action where unusual conditions or indicators justify it. Sensors can complement periodic testing, but only for parameters they can validly measure.
An apparently normal monthly result cannot retroactively prove that no problem occurred during the weeks between tests. That is a limitation of sampling, not a reason to abandon testing.
What is the difference between monitoring and surveillance?
Water suppliers monitor their processes and compliance; independent public-health or regulatory surveillance may evaluate whether the safety framework is effective. The precise division of responsibility varies between countries.
The WHO Guidelines for drinking-water quality describe health-based targets, water safety plans and independent surveillance as interconnected parts of protecting consumers.
A programme can have strong in-house laboratory data yet weak independent challenge. Conversely, a regulator can demand reports without providing a workable method for addressing systemic risks. Quality depends on the institutions and their real responsibilities.
Indicators can warn without identifying every cause
Changes in turbidity, residual disinfectant where relevant, conductivity or pressure may signal that an operating condition deserves investigation. But an indicator is not necessarily a direct measurement of the harmful agent of concern.
A sudden sensor change might indicate contamination, instrument drift, sampling error or routine operational adjustment. Interpretation requires the physical system, corroborating evidence and valid methods.
Alerts should trigger a defined verification and response process rather than automatically turn a single unusual signal into a definitive public health claim.
Sensor calibration and drift can create false confidence
A digital instrument may display many decimal places even when it is incorrectly calibrated or influenced by temperature, electrode condition or other factors. Apparent numerical precision is not evidence of accuracy.
Instrument quality control includes appropriate calibration, maintenance, traceability, checks against known references and records of anomalous readings. Different sensor types have different procedures and service intervals.
Treat surprising values as evidence requiring analysis, not a reason to delete the data. Repeated near-identical values should also be examined when the underlying process would normally vary.
A malfunctioning sensor is not proof the water is unsafe
Suppose a distribution-system sensor stops changing because it has failed electronically. A dashboard may show a flat, reassuring line even while true conditions are unknown.
The reverse can also happen: a faulty sensor produces an alarming spike although conditions at the sampling point remain within the expected range. Operators need instrument diagnostics and corroboration appropriate to the situation.
Separate sensor-health alerts from validated water-quality findings. If uncertainty leaves a credible health risk, competent authorities must use their established precautionary procedures.
Why sample collection is a scientific procedure
Sample containers, collection technique, handling, preservation and time to analysis can affect results. The correct requirements depend on the parameter and analytical method; microbial sampling is not interchangeable with all chemical sampling.
A technically excellent laboratory cannot recover information lost because the wrong container was used or a sample was contaminated after collection.
Follow the method authorised for the particular test and use trained personnel. This reader guide deliberately avoids inventing one generic sampling recipe that would be unsafe or invalid for different contaminants.
Chain of custody protects meaning as well as evidence
Sample labels should connect the measurement to the right place, time, collection method and operator. Where applicable, chain-of-custody records also document transfers and handling so results can be traced.
An unlabelled bottle may contain real water from a particular tap, but the laboratory cannot responsibly certify where it came from. A wrongly matched laboratory result can lead to false reassurance or unnecessary action in another location.
Stable sample identifiers, controlled records and reconciliation checks are core data-quality tools—not paperwork added only for legal disputes.
Laboratories need quality controls
Testing may rely on laboratories with established methods, suitably trained analysts, maintained equipment and internal quality controls. The specific accreditation or regulatory standards required are jurisdiction-dependent.
Replicates, controls, reference materials and method validation can help reveal problems. Reporting a result without its units, uncertainty where relevant, sample identifier or applicable reporting limit can make it unusable.
Quality assurance costs resources but prevents a more serious waste: making public health decisions from numbers whose meaning cannot be defended.
Detection limits are not zero
A laboratory might report a substance as ‘not detected’. This generally means the result did not meet the detection or reporting criterion for that method under its conditions, not that the substance is mathematically absent.
Methods have limits, and different methods can report differently at low concentrations. The important questions are which analyte, which limit, which regulatory threshold and whether the method was suitable for the decision.
Public summaries should explain that a nondetect is not automatically the same as zero. Conversely, the mere presence of a detectable substance does not establish that an applicable health standard has been exceeded.
Why one safe average can hide local problems
Imagine several sampling points with ordinary results and one high result at a particular building. Averaging the values may make the overall number look low while obscuring a problem faced by actual occupants.
For some contaminants, compliance and risk are determined by specific sampling rules rather than a simple arithmetic average. The United States EPA’s lead-and-copper monitoring uses risk-informed tap sampling approaches under its regulations.
Do not substitute a convenient average for the exact metric required by the governing rule. A correct statistic with the wrong denominator or decision rule can mislead.
Lead at the tap illustrates the location problem
Water leaving a treatment plant may not contain the same lead concentration as water drawn through particular service lines or premise plumbing. Plumbing materials and corrosion conditions can influence exposure at specific taps.
The US EPA’s 2024 Lead and Copper Rule Improvements technical guidance describes prioritising certain tap sampling sites because they are more likely to reveal elevated lead. The relevant legal details and implementation dates belong to the US system.
The general lesson is that sampling location matters. A broad conclusion about every home cannot be inferred from one source-water or treatment-plant measurement.
Microbial hazards require a different approach
Biological hazards can appear after contamination events, treatment failures or disruptions to distribution. Appropriate microbial monitoring may use indicators and testing strategies defined under the governing safety framework.
A test for one organism or indicator cannot automatically establish the absence of every pathogen. Evidence must be interpreted in light of treatment performance, events, sampling design and regulatory requirements.
If an actual authority issues a drinking-water advisory, follow its current instructions. Never infer from this article that a specific household’s water is safe to drink.
Pressure changes and distribution failures matter
Water pipes transport a treated supply through areas with varying pressure, demand and infrastructure condition. System leaks, backflow or pressure failures can create potential contamination pathways under relevant circumstances.
Monitoring pressure and network events can help identify periods when additional investigation or sampling is justified. Repair work and flushing may also require controlled procedures and verification before the area returns to normal operation.
Water quality cannot be managed solely as a laboratory issue: asset maintenance and operational reliability matter as well.
Weather and catchment events can change the risk map
Heavy rainfall, drought, wildfire, flooding or land-use changes can alter source conditions or the pressure on treatment operations. The relevant hazards differ across supplies, regions and seasons.
A water safety plan should be revisited when new events or land uses create credible risks. Historical patterns are useful, but yesterday’s normal conditions are not guaranteed to represent today’s catchment.
Early warning should connect environmental and operational observations with updated monitoring decisions instead of waiting for a confirmed downstream problem.
Small communities face particular monitoring barriers
A small supply may lack the laboratory access, technical staff or spare equipment of a large utility. Transporting samples to an appropriate laboratory can take time, and complex reporting software may be impractical.
WHO’s 2024 small-water-supply guidance explicitly recognises these difficulties and promotes proportional risk management, surveillance and regulatory support suited to local circumstances.
The choice is not between an expensive big-city system and no oversight. It is to build a credible, supported approach matched to the actual population and hazards.
More dashboards cannot repair missing samples
A sophisticated map can display coloured zones and precise graphs even when the underlying measurements are sparse or outdated. The visual confidence of a dashboard can exceed the quality of its evidence.
Useful public dashboards should reveal sampling dates, sites or area coverage as appropriate, units, methods, missing measurements, corrections and how regulatory decisions were made.
Interpret the picture and its gaps together. A blank area should not automatically be coloured as safe, and an unconfirmed sensor anomaly should not be presented as a verified health violation.
How water-quality reports should explain results
In the United States, EPA’s Consumer Confidence Report rules require community water systems to provide annual water-quality information. EPA’s consumer guidance explains that these reports include source information, regulated contaminants found, and explanations of relevant violations and actions.
These requirements are US-specific. Other countries have their own reporting structures and public notices. Still, the communication principle travels: tell readers what was measured, where the data apply, whether a standard was breached and what is being done.
Clear explanations should distinguish routine annual summaries from urgent health advisories, since the latter require timely, event-specific action.
When a violation report arrives too late
Even an excellent laboratory result is less useful if a credible hazard remains unaddressed while data move through disconnected organisations. Testing, regulators, health authorities and operators must have defined responsibilities.
An effective process specifies who reviews results, what thresholds trigger verification or response, how urgent situations are escalated and when people must be informed under applicable rules.
Regular publication deadlines are not substitutes for urgent communication. A completed annual report does not resolve an acute event discovered earlier.
Regulatory compliance and public health risk are connected but distinct
Standards translate evidence and policy into measurable obligations. A compliance determination relies on the exact jurisdiction, parameter, method and sampling rules.
A monitoring violation may concern a missed test rather than a confirmed exceedance, though missing data can prevent reliable assurance. A detected health-related exceedance is a different finding requiring its own evaluation and action.
Readers should not interpret every compliance notice as proof that harmful water was consumed, nor dismiss a monitoring failure because no harmful result was measured.
Fictional case: the village with a beautiful dashboard
Imagine fictional Clearwater Village. An online portal displays a green water-quality score every day, based on a single sensor at the treatment plant. Residents in a distant area report irregular supply pressure after pipe repairs.
Officials discover the dashboard has no measurements that directly represent those downstream conditions. They review distribution events, update the monitoring plan and publish information about what can and cannot be concluded.
The original sensor was not necessarily wrong. The monitoring claim was broader than the evidence. This invented case is a lesson in geographic and system coverage.
Fictional case: a sample with the wrong identity
In fictional Willowtown, a technician collects water from several buildings but labels two containers with reversed site numbers. The laboratory performs the tests correctly and reports an unusual result under the wrong address.
The subsequent investigation compares collection logs, sample histories and instrument data, then repeats appropriate tests under the governing plan. Managers improve identifier controls and training.
The lesson is that analytical accuracy cannot compensate for broken sample identity. The example does not allege misconduct by any real utility.
A useful monitoring scorecard
Combine coverage of relevant risks, sampling-plan completion, timeliness, calibration and laboratory quality, traceability, verified exceedances, corrective action and accurate public communication.
Different parameters need different measures, so one numerical ‘water score’ should not conceal meaningful exceptions. Auditors should examine periods of missing data and not only the values that happened to be captured.
Progress means that hazards are less likely to go unnoticed and that institutions respond reliably when evidence changes.
Seven practical repairs for failing water monitoring
First identify the actual supply and hazards. Second compare sampling locations and frequency with credible risks. Third maintain instruments and laboratories. Fourth protect sample identity and data quality. Fifth set clear thresholds for verification and action. Sixth coordinate utility, regulator and public-health responses. Seventh communicate findings transparently with relevant uncertainty.
Risk management should be integrated across the catchment, treatment, distribution and consumer interface. Independent surveillance helps determine whether the system works as intended.
Not every improvement requires a new digital platform. Sometimes a correctly designed sampling location, an unbroken record trail and a trusted decision maker provide more value.
Five questions to ask when you see a water-quality claim
Ask which water supply and period were assessed, where samples were collected, which hazards were measured, what standards and methods applied, and which authority verified any corrective action.
Distinguish a sensor reading, laboratory result, compliance determination and public-health advisory. Those are not interchangeable kinds of evidence.
For a real concern about drinking-water safety, rely on current advice from the responsible utility, regulator or public-health authority rather than general material written for education.
Frequently asked questions
Does one passing water sample prove all water is safe?
No. Results apply to specific parameters, locations, methods and collection times. A monitoring programme needs representative coverage and risk assessment.
Is clear water necessarily safe water?
No. Some microbiological or chemical hazards cannot be identified by appearance, taste or smell.
What does ‘not detected’ mean?
Usually that the analyte was not detected or reported under the method’s specified conditions and limits; it does not mean mathematically zero.
Can a sensor alert be wrong?
Yes. Drift, calibration problems or environmental interference can produce anomalies that need verification.
Does missing a required test prove contamination?
Not automatically. It is a monitoring or compliance concern and can leave important uncertainty about actual conditions.
Why sample water at the consumer’s tap?
Some risks may arise or change within distribution or building plumbing, so treatment-plant data alone may not represent every tap.
Which 2026 WHO guidance is relevant?
WHO published an updated compilation of its fourth-edition Guidelines for drinking-water quality in June 2026, supporting risk-based management and independent surveillance.
Primary sources and further reading
WHO guidance supports risk-based drinking-water management. The EPA references are examples of regulatory practice in the United States, not substitutes for your local water standards or immediate advisories. Fictional examples are for education only.
- WHO: Guidelines for Drinking-water Quality, Fourth Edition with Three Addenda (17 June 2026)
- WHO: Drinking-water Quality Guidelines and Water Safety Plans
- WHO: Guidelines for Drinking-water Quality — Small Water Supplies (2024)
- WHO: Drinking-water Quality Resource Roadmap (June 2026)
- US EPA: Consumer Confidence Reports — Information for Consumers
- US EPA: Tap Monitoring Requirements in Lead and Copper Rule Improvements (2024)
Explore related failures
- How Water Systems Work | Source, Treatment, Distribution and Return
- Why Water Systems Fail | Leaks, Drought and Unsafe Supply
- Why Public Health Surveillance Fails | Data Gaps, Delays and Trust
- Why Public Records Systems Fail | Errors, Access and Trust
Final thought: Monitoring succeeds when the system measures the risks that matter, honestly explains uncertainty and converts credible evidence into safer water—not when a dashboard merely stays green.