
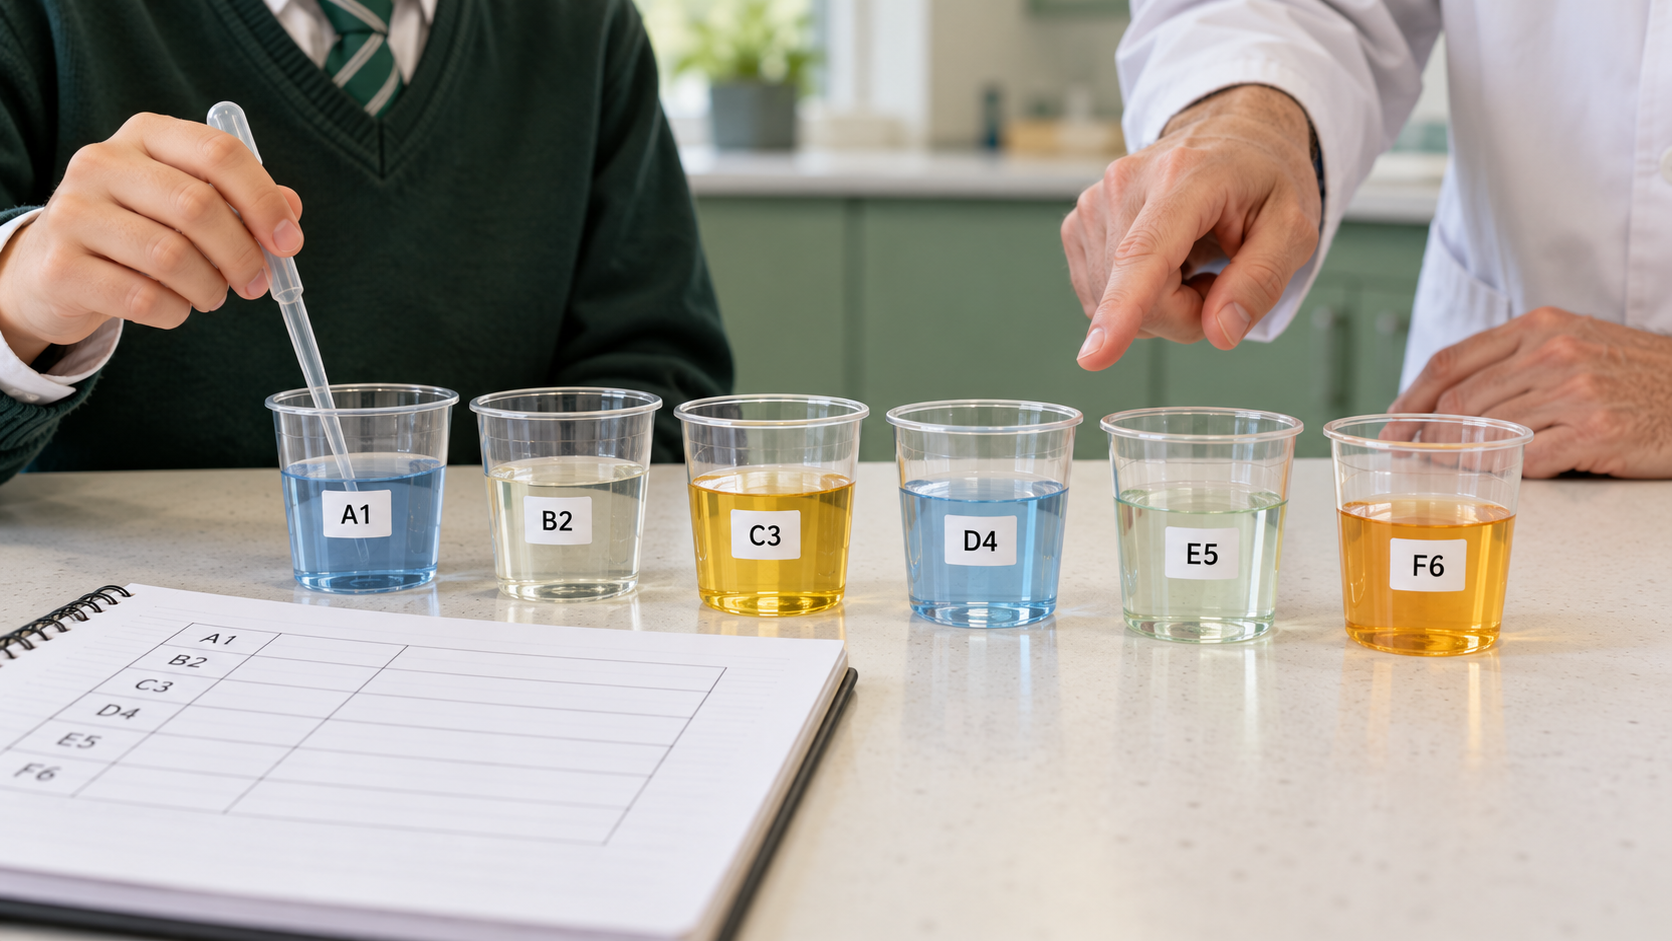
Did you know? A student can submit a science laboratory report with a textbook-correct conclusion while the actual observations do not support it. A scientific answer only becomes trustworthy when methods, measurements and interpretation form a connected chain.
Quick answer: Student lab reports fail when conclusions are decided before results, methods omit important details, raw observations become invented numbers, graphs lack units and evaluation is reduced to generic “human error.” Good reporting shows what was actually investigated and what the evidence can—and cannot—establish.
This guide explains how student science lab reports fail for primary and secondary learners, using Monash and Sheffield’s current science-writing resources and Singapore SEAB’s 2027 G3 Science experimental-skills framework. It distinguishes full reports from timed practical papers and uses fictional data scenarios without encouraging unsafe experiments.
Choose your reading route
- Understand the 2027 SEC context — what practical reasoning assesses
- Write a testable question — hypotheses and variables
- Report what happened — observations, measurements and units
- Analyse honestly — graphs, anomalous data and conclusions
- Make evaluation useful — limitations and justified improvements
- Use a report diagnostic — six checks
- Quick answers — Science FAQs
A correct conclusion can hide an experiment the student did not understand
Did you know a student can finish a science report with a textbook-correct conclusion and still be unable to explain how the experimental evidence supports it? The final sentence may sound scientific, but the measurements, methods and uncertainties tell a different story. A polished answer can become a substitute for inquiry instead of its result.
Science lab reports fail when students choose the expected answer first, then fill tables and discussion paragraphs to match it. A genuine report documents what was investigated, what was done, what was observed and what can reasonably be concluded. The aim is not a beautiful document that proves the student’s original prediction correct. It is a traceable argument in which evidence has authority over expectations.
A lab report is a communication system, not only a worksheet
Scientific work creates several kinds of information: a question, a proposed explanation, a method, observed data, calculations, analysis and a conclusion. A report connects these pieces so another reader can understand the process and evaluate the result. A missing unit, unexplained step or invented observation can break the chain even when the overall writing is fluent.
Monash University’s Student Academic Success resource describes a science lab report as a structured, accurate communication of research that enables others to understand and potentially replicate the experiment. That educational purpose is wider than memorising a template. The writer must show how the evidence emerged and how the interpretation follows, not merely repeat what was expected to happen.
The chain from question to evidence-based conclusion
A useful investigation starts by identifying a precise question and the relevant variables or conditions. The student plans an authorised method, records observations as they occur, organises data and analyses patterns. Then the student explains what the evidence supports, what remains uncertain and how the method could be improved. Feedback should strengthen future inquiry.
A report can fail at any transition. The question may not match the method; the results may omit units; the graph may hide a measurement error; or the conclusion may claim more than the data show. Reviewing each link helps identify the earliest problem instead of rewriting the last paragraph until it sounds impressive.
The 2027 SEC framework makes experimental reasoning explicit
Singapore’s Secondary Education Certificate begins in 2027 under Full Subject-Based Banding, with G1, G2 and G3 subject-level arrangements. The official SEAB G3 Science K326, K327 and K328 syllabus describes experimental skills including recording observations, interpreting and evaluating results, planning investigations and proposing improvements. These are not merely decorative skills appended to factual knowledge.
The syllabus is specific to named G3 combined-science subjects. Do not assume every primary or secondary assessment requires an identical full written laboratory report. The broader educational principle is still useful: credible scientific answers connect observed evidence, method and reasoning. Students should always check the actual course and assessment requirements rather than copy a generic university report structure into every SEC question.
A practical examination does not necessarily demand a full formal report
A Secondary student can confuse laboratory-report writing with the format of a timed practical test. The official 2027 G3 combined-science syllabus describes Paper 5 as an assessment of experimental skills and investigations, but it is organised into examination tasks rather than a guarantee that candidates must submit an entire journal-style research paper.
Teach the transferable capabilities without misrepresenting the examination. A brief table, labelled diagram, calculated result or improvement answer may be what a particular practical question requires. A longer school-based report can develop the same evidence habits in a different format. Accuracy about the actual assessment helps students prepare intelligently instead of over-learning irrelevant headings.
A precise research question prevents an empty experiment
A report titled “Plants and Light” describes a topic, not a testable question. The student may collect observations without knowing which relationship is being investigated. When the conclusion is due, almost any sentence can appear to answer the vague title.
Frame a question around something that can be investigated under authorised school conditions, such as whether a defined change in an illustrative setup affects a measured response. Identify what would count as relevant evidence before observing the result. A clear question gives the method direction and the conclusion boundaries. It also makes it easier to notice when the activity has drifted away from its original purpose.
A hypothesis is not an answer that must come true
Some pupils believe a good experiment always confirms the hypothesis. If the observations differ, they may erase measurements or rewrite the prediction after the fact so the report appears successful. That converts an authentic learning opportunity into a misleading record.
Treat a hypothesis as a testable proposed explanation or prediction, not a promise. A result that does not support it may be informative if the procedure and data are reliable. The conclusion should say what happened and how it relates to the initial idea. Changing a claim in response to evidence is part of science; pretending the original prediction was always right is not.
The independent variable is not just a familiar vocabulary word
A student may memorise the definition of an independent variable yet fail to identify what was deliberately changed in a particular investigation. The report then lists a quantity that merely varies by accident or confuses the outcome measured with the condition manipulated.
Use the actual question and method to identify the intended change and the responding measure. State these clearly and consistently through the report. A variable table is useful only when it describes real experimental decisions. If students cannot explain why a listed variable belongs in a category, they need to revisit the investigation rather than copy a teacher’s terminology mechanically.
Controlled variables require a reasoned explanation
A pupil may write “keep everything else the same” without specifying what matters or whether those conditions were truly controlled. This sounds like a scientific rule but offers little evidence that the experiment could isolate the intended relationship.
Select relevant conditions that could affect the measured response and explain how they were kept appropriate or monitored under the actual approved method. No experiment controls every possible influence perfectly. The objective is a defensible comparison, not an unrealistic claim of total certainty. A strong report explains important conditions instead of filling a generic list with every object in the room.
A comparison cannot be fair if the method changes halfway through
Students may use one measurement method for the first trial and another for the second without recording the change. They then treat the two results as directly comparable. Differences may reflect the procedure rather than the variable they intended to test.
Keep the relevant method consistent where feasible and document necessary deviations honestly. If a change affects interpretation, discuss it rather than silently correcting the data. A sound investigation treats procedural consistency as part of the evidence for comparing results. A beautiful table cannot recover information about a method that was never recorded.
Methods need enough detail to be understood
“We measured the samples” leaves a reader unable to tell what was measured, by which approved instrument, at what point or under what relevant conditions. Another student may follow a different procedure and obtain a different result without knowing whether the methods were comparable.
The University of Sheffield’s October 2026 lab-report guide explains that a method should give enough detail to permit replication. School reports should match their required format, but the principle is clear: describe relevant actions and measurement conditions precisely without drowning the reader in unnecessary classroom routine. Scientific writing is accurate when another person can understand what produced the numbers.
Do not copy a procedure that the class did not actually follow
A student may paste the worksheet’s planned method into the final report even when the real experiment included a change, delay or different observation. The report then describes an ideal procedure instead of the one producing the submitted results. An apparent discrepancy between method and data becomes impossible to investigate.
Record the actual authorised procedure and identify significant deviations as appropriate to the assignment. The plan and execution can be compared rather than silently made identical. Scientific integrity means allowing the record to show what happened, including practical imperfections, while respecting the school’s instructions on how much detail to include.
Raw observations and explanations are different things
A report might say “the substance reacted because energy was released” in a results table. This mixes observation with an interpretation that requires evidence. In other cases the student records only “reaction successful,” losing the visible or measured details on which a later deduction depends.
Separate direct observations or measurements from their interpretation. Describe what was visibly or quantitatively recorded, then explain what those facts may mean in the analysis section. A distinction between “what was observed” and “what is inferred” is fundamental to evidence literacy and is useful far beyond laboratory work.
Numbers without units do not fully describe measurements
A table containing 12, 15 and 18 may appear tidy, yet the reader cannot tell whether these are seconds, millimetres, degrees Celsius or something else. The values cannot be reliably compared with another result if the measured quantity and units are missing.
Label the quantity and appropriate unit in a clear header or according to the course’s conventions. The University of Sheffield’s lab-writing guidance emphasises correct units and suitable data presentation. A report should also preserve meaningful precision. Recording a number accurately includes recording what it measures, not merely copying digits from a display.
False precision can make a result look more trustworthy than it is
A student may measure with a simple classroom ruler and report values to many decimal places because a spreadsheet automatically formats them. The digits suggest precision that the instrument or technique could not support. The result looks impressive but misrepresents the measurement.
Match recorded precision to the equipment and the assigned task. Do not add invented decimal places after calculation. Where averaging or conversion creates a longer number, present it with a defensible degree of precision. Understanding measurement limitations is part of scientific reasoning, not an optional correction after the graphs are complete.
A blank table cell and a zero measurement are not the same
A pupil may leave a measurement blank because the instrument could not be read, then fill the spreadsheet with zero so a chart can be generated. The graph treats missing evidence as an actual numerical result. That small convenience can distort the apparent pattern.
Record missing, invalid or not-applicable data clearly according to the assessment instructions. Do not turn absence into a measured zero without justification. If the task requires an average, explain whether the missing value was excluded and why. Transparent data handling allows later readers to understand the evidence instead of being misled by a visually complete table.
An anomalous result deserves attention, not immediate deletion
A data point that differs from the others may reflect a measurement error, an uncontrolled condition or a real phenomenon. Students sometimes remove it simply because it spoils a smooth graph. The result is more attractive but less honest.
Investigate the conditions, instrument readings and procedure where an authorised repeat is appropriate. Keep raw data visible and explain any defensible exclusion in the manner the course requires. The objective is not to force a straight line through convenient points. Scientific interpretation gains credibility from acknowledging uncertainty and unexpected evidence.
Repeating a trial does not automatically make the method reliable
A group may repeat the same flawed procedure three times and obtain nearly identical results. That consistency can feel reassuring, but a systematic bias could affect every trial. Repetition is useful yet cannot compensate for an invalid measurement method.
Discuss what repeats show and what they cannot show. Separate random variability from systematic limitations where appropriate for the learner’s level. Students should not be encouraged to perform additional unsupervised experiments merely to increase a number in their report. Reliable evidence requires both suitable design and careful interpretation.
Averages hide information when the distribution matters
A student calculates the mean of several observations and reports only the result. The individual measurements may have varied widely, or a single extreme value may dominate the average. The final number appears precise while the reader cannot judge its stability.
Retain the relevant observations and summarise appropriately for the task. A mean can be useful, but it should not erase meaningful variation or anomalies. The writer should explain how many observations contributed and avoid using an average where the data are not comparable. Data processing is an interpretation step requiring judgement, not just calculator work.
A graph is not scientific simply because it uses software
A spreadsheet can produce a colourful chart from almost any columns. Students may choose a pie chart for continuous measurements, omit axis labels or use decorative styles that obscure the relationship. The result looks professional but communicates little.
Choose a graph suited to the actual question and data type. Label axes, include units where relevant and make the scale intelligible. Sheffield’s guidance says visual presentation should help the reader understand the data rather than exist for its own sake. A useful graph makes the pattern easier to inspect without changing what was observed.
The scale on a graph can exaggerate a small change
A plotted line may appear dramatically steep because the vertical axis covers a very narrow numerical range. The graph may be technically accurate within the chosen scale but misleading about the size of the effect. A student might draw a strong conclusion based on appearance alone.
Read the axis values and actual data before describing a trend. Explain the magnitude in suitable units and choose scales responsibly under the course requirements. A visually striking chart should not replace numerical reasoning. Good reporting gives the reader enough context to evaluate whether an apparent change is large, small or uncertain.
A trend line does not automatically establish causation
A graph may show two quantities changing together. Students sometimes conclude that one definitely caused the other even when the investigation cannot exclude another influence. A neat line through the points can make a causal claim sound inevitable.
Return to the design: which condition was changed, which other variables were managed and what alternative explanations remain? State the relationship supported by the data and avoid stronger causal language unless the method justifies it. An evidence-based conclusion acknowledges the reach of the experiment rather than borrowing certainty from a smooth graph.
A table and a paragraph should not contradict one another
A student may write “the measured value increased steadily” while the actual table shows a decrease in one trial or a plateau at the end. They may have copied a general explanation from a textbook without reading their own data. A report can become internally inconsistent even when every sentence sounds plausible alone.
Check the written description against the actual numbers and graph. If an exception exists, describe it rather than quietly omit it. Scientific prose should be constrained by the evidence shown on the page. A simple comparison between each major claim and its supporting observation catches more problems than polishing vocabulary without checking the table.
Results should not contain an invented perfect pattern
Pupils sometimes believe teachers expect smooth, ideal results and may alter observations to match an example. An experiment that produces variation can feel like failure, even when interpreting that variation is the real learning opportunity.
Do not invent readings, erase inconvenient trials or make up missing observations. If the investigation was unsuccessful or the data are incomplete, say so and explain the limitation. The 2027 SEC G3 Science syllabus explicitly values integrity and objectivity in handling and communicating scientific information. Accurate uncertainty is more valuable than an artificial pattern that can never be defended.
Discussion is not a repeated description of the table
Some students copy the results into sentences and call it analysis. The report says what the numbers are but never explains why the pattern matters, how it relates to the question or what might limit the conclusion.
Monash’s lab-report guidance distinguishes results as a presentation of observations from discussion as an interpretation linked to the original research question. A useful discussion identifies the main relationship, possible mechanisms where justified, limitations and what the evidence does not establish. It should move the reader from recorded facts toward reasoned understanding without turning guesses into certainties.
The conclusion should answer the original question
A student may end with a generic sentence that “the experiment was successful” even though the original task asked for a relationship between measured quantities. The report has an ending but no answer. Another student may conclude that a hypothesis was proven despite substantial uncertainty in the observations.
State what the data support in relation to the defined question, with appropriately limited language. If the result is inconclusive, that may be the defensible conclusion. Sheffield’s guidance asks that conclusions restate the main findings and discussion, not introduce a completely new unsupported claim. Good scientific writing values a precise answer more than a dramatic one.
A limitation is not simply “human error”
Students often fill the evaluation section with “human error occurred,” believing any mention of imperfection earns scientific credibility. The phrase tells the reader almost nothing about which step could affect the measurement or how the effect might change the result.
Identify the relevant source of uncertainty in the actual procedure and explain its possible effect. An improvement should respond to that source specifically. For example, if reaction timing depends on a person’s inconsistent starting point, a suitable controlled or more repeatable measurement procedure might reduce that issue under teacher guidance. The focus is reasoning about quality, not blaming humans in general.
An improvement must target the identified weakness
A report says “use better equipment” or “repeat more times” regardless of the experiment’s limitations. These phrases can be useful in specific contexts, but as generic answers they may not solve the real problem. Repeating a biased method can make a flawed result more consistent without making it valid.
Link each suggested improvement to a concrete issue and explain how the change could help. The 2027 G3 Science syllabus includes evaluation of methods and suggestions for improvement among its experimental objectives. Students should practise justified changes, not memorise a universal list of improvements detached from the evidence.
Evaluation should not turn into uncontrolled laboratory instructions
A student trying to improve a science report may propose using stronger chemicals, higher temperatures or unfamiliar biological samples without considering safety or school approval. An apparently sophisticated method can become inappropriate for the learning environment.
Practical work must follow teachers’ authorised procedures, laboratory safety rules and the specific syllabus. This guide discusses report quality, not how to carry out potentially hazardous experiments. Evaluating a procedure includes recognising safety, ethics and feasibility constraints. A method cannot be judged better solely because it might produce a larger measurable effect.
Ethics includes honest treatment of organisms and materials
Science investigations may involve biological material or environmental observations. A learner could assume that a compelling question justifies collecting any specimen or testing personal biological material. That is not an acceptable inference from the educational value of inquiry.
The official 2027 SEC G3 Science syllabus includes a special caution about school, authority and government restrictions on sampling bodily tissues and secretions. Students should not design or perform such procedures without the proper authorised framework. Ethical scientific reporting explains what was permitted and what was actually done, rather than treating ethical limits as obstacles to overcome informally.
A labelled diagram is not a decorative sketch
Some Biology tasks require students to show observed structures clearly. A drawing can be attractive yet inaccurate if proportions are invented, labels point ambiguously or magnification is absent where required. The artistic quality of shading does not substitute for faithful observation.
The 2027 G3 combined-science Biology practical guidance includes clear line drawings, labels and magnification among possible assessed skills. Follow the relevant assessment instructions rather than adding features that were not observed. A scientific diagram communicates evidence about the specimen, not the student’s ability to make the page visually impressive.
Raw data should remain traceable after calculations
A group produces a final average in a spreadsheet but forgets which original measurements were used. If an error is found later, nobody can reconstruct the calculation or determine whether a value was changed. The attractive summary has become disconnected from its source.
Keep original observations and a clear record of relevant transformations where appropriate to the assignment. Sheffield’s lab-report guide includes detailed data and calculations in appendices for some academic contexts; a school worksheet may use a simpler table. The principle is consistent: readers should be able to see how the reported number emerged rather than take a polished result on faith.
AI-generated reports can hide missing investigation
A student can ask a generative tool to produce an aim, method, data table and conclusion in fluent scientific language. The resulting document may look professional while containing fabricated measurements, steps never carried out or a causal explanation not supported by the activity.
Follow school rules on permitted assistance and disclose AI support where required. Use tools for legitimate revision of language or structure only when authorised, and verify every factual statement against actual observations and trusted teaching materials. AI fluency cannot replace the student’s duty to report what was really done. A scientifically credible report begins with evidence, not with the most convincing paragraph a model can produce.
Group work can conceal unequal understanding
During a practical activity one pupil may handle measurements, another types tables and a third writes the conclusion. The submitted group report appears complete, but some members cannot explain the method or interpret an unexpected value independently.
Give students opportunities to explain each stage in their own words. An individual question about a variable, graph or limitation can reveal what each learner understood. The report can remain collaborative where the task permits it, but shared production should not conceal individual learning gaps. The objective is competent scientific thinking from every participant, not just one polished team artifact.
Teacher feedback should repair the first unstable step
A marked report may contain comments about unclear graphs, imprecise vocabulary and weak conclusions. Students can become overwhelmed, copy every correction and submit another neat page without understanding which reasoning error matters most.
Identify the first significant problem in the evidence chain and provide a specific next action. If the raw data are unclear, address that before editing causal language. If the method is sound but the conclusion overstates the evidence, revise that claim and test a new example. Feedback works when it changes how the learner approaches the next investigation.
A fictional case: the perfect straight line
Illustrative case: three Secondary 3 students record several measurements and expect a direct relationship. One value falls away from the apparent trend. The group removes it to make the graph look more elegant, then writes that every observation confirms the prediction.
The better response is to preserve the original observation and investigate whether a justified methodological issue affected it, under teacher supervision. The case is fictional and does not report an actual assessment. It shows how aesthetic pressure can turn data handling into a loss of scientific integrity.
A fictional case: an impressive conclusion with no units
Illustrative case: Asha submits a report with a clear hypothesis, several tables and a confident conclusion. Her main table lists 4, 8 and 12 but no units. The graph then labels its axis “Time” without indicating whether those values are seconds or minutes. The narrative assumes the reader knows the missing context.
A simple evidence audit would repair the quantity and unit labels and check that all calculations and descriptions use the same convention. The case is fictional. It illustrates why precise scientific reporting depends on small, meaningful details that allow another reader to evaluate the data.
A fictional case: the experiment that did not confirm the hypothesis
Illustrative case: a primary science class predicts that changing one condition will produce a visible effect, but the supervised observations do not show a clear difference. Students worry that the activity has failed and want to replace their table with values from the textbook.
The useful learning is to report the actual observations, consider whether the method could detect the expected effect and explain the limits. A result that does not support the prediction can still be educational. The story is fictional and does not instruct unsupervised experimental activity.
A six-question lab-report quality diagnostic
What precise question was investigated? Does the method describe what actually happened? Are observations recorded without invention or missing units? Do tables and graphs represent the data accurately? Does the discussion distinguish evidence from interpretation? Does the conclusion answer the question within appropriate limitations?
These questions are an educational review tool, not a universal SEAB marking rubric. The required format depends on level, subject and school assessment. Use them to find the earliest broken link and correct the underlying scientific reasoning rather than merely make the report look more polished.
A practical before–during–after learning routine
Before a supervised investigation, clarify the question, expected observations and approved safety procedure. During it, record raw measurements and any relevant deviations honestly. Afterward, check units and plots, explain the evidence, describe legitimate limitations and answer the original question. A later independent task can test whether the student understands the method without copying the report.
The routine should be adapted to the actual lesson and teacher’s instructions. Some young learners use a simple observation sheet, while older students may prepare a structured report. The consistent principle is that scientific conclusions must remain traceable to what was observed under an appropriate method.
What parents can ask after a science practical lesson
A parent may see an attractive report and praise the correct conclusion. A more useful conversation is to ask what the child actually observed, which result was surprising and why the final statement follows from the measurements. This supports reasoning without requiring the parent to conduct a laboratory experiment at home.
Avoid pressuring a child to produce the expected result or perform unsupervised chemistry and biology activities. If a report seems weak, ask which evidence or instruction the pupil did not understand and seek appropriate teacher feedback. The best home support values curiosity and honesty alongside accuracy.
What teachers and tutors should model
Educators can model the difference between a planned procedure, a raw observation, a calculation and an inference. Show pupils how a conclusion becomes weaker when a key unit or condition is missing, and how a justified improvement differs from a generic “repeat more” comment.
A tutor can use safe fictional datasets and short written examples to practise data interpretation without conducting restricted experiments. The student should be challenged to explain a changed case independently. Good teaching does not reward inventing perfect results; it develops the confidence to report a messy but authentic investigation clearly and responsibly.
The final principle: evidence should control the story
A scientific report is strongest when a reader can follow the path from a meaningful question through an authorised method to honest data, clear analysis and a proportionate conclusion. It does not need to pretend every prediction was correct or every instrument perfect.
The real achievement is the ability to say what happened, why the evidence supports a particular claim and what remains uncertain. When a student can defend those connections without borrowing a textbook answer, laboratory work has become science rather than a performance of scientific vocabulary.
Frequently asked questions
What sections should a science laboratory report contain?
Many structured reports include a question or introduction, method, results, discussion and conclusion, but school and examination tasks may require a different format. Use the actual rubric and teacher instructions.
Is a correct conclusion enough for a good report?
No. The method, observations and analysis must support it. A textbook-correct statement that is not backed by the student’s evidence does not demonstrate scientific reasoning.
Should students remove anomalous measurements?
Not automatically. Preserve raw observations and investigate discrepancies. Any exclusion should be justified under the task’s instructions rather than made solely to improve the appearance of a graph.
What is the difference between results and discussion?
Results describe observed or measured evidence; discussion interprets what those results mean for the original question and their limitations.
Do 2027 SEC G3 Science students write a complete lab report in Paper 5?
Paper 5 assesses experimental skills through set practical tasks. Do not assume it always requires a full university-style report; follow the actual 2027 syllabus and examination question requirements.
Can AI write a lab report using invented data?
Inventing results misrepresents the investigation. Follow school policies on AI assistance and use actual authorised observations, checking all claims and references.
What is the best way to improve a weak evaluation section?
Identify one concrete method limitation, explain how it could affect results and propose an appropriate, safe and justified improvement rather than writing only “human error.”
Evidence and further reading
- Monash University (October 2026): Science Lab Report — question, methods, results and interpretation
- University of Sheffield (October 2026): How to Write Lab Reports — replicability, units, graphs, limitations and conclusions
- SEAB: Secondary Education Certificate — 2027 G1, G2 and G3 system
- SEAB (26 October 2026): 2027 G3 Syllabuses for School Candidates — subject-specific syllabus requirements
- SEAB: 2027 G3 Combined Science K326, K327 and K328 Syllabus — practical assessment objectives and scientific integrity
- How School Science Projects Fail | When Results Are Decided Before Investigation
- Primary 4 MOE/SEAB Science Examinations | Fair Tests, Variables, Tables and Graphs Explained
- How Singapore Education Works | IP Science, Practical Inquiry and Data
- How Study Groups Stall | When Discussion Replaces Independent Understanding
- Secondary 1 Mathematics Tutor Clementi | Small Groups Tutorials — unchanged editorial reference
Evidence and safety boundary: A lab report is not the same as the exact format of every Singapore practical examination. Students must follow their syllabus and the school’s assessment and laboratory safety requirements. Do not perform unapproved chemical, biological or electrical experiments, handle unknown specimens or invent results. All student and data examples are fictional.