
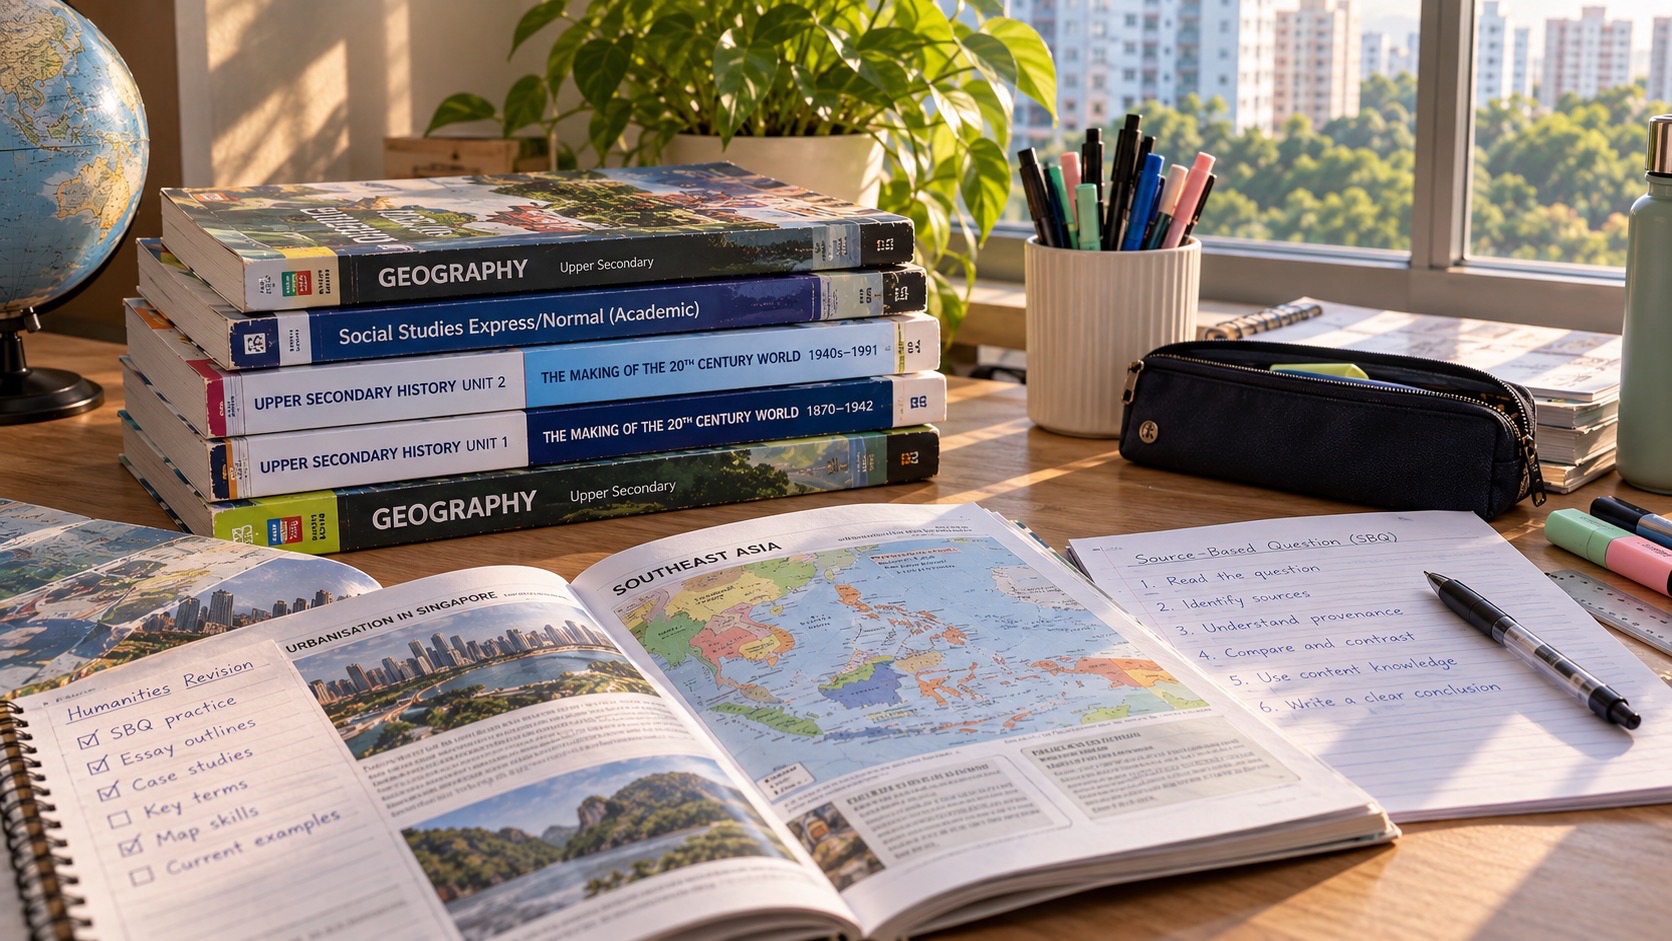
To survive G2 Humanities Geography Paper 2 for the 2027 Singapore-Cambridge Secondary Education Certificate, focus on a compulsory 25-mark question about Geography in Everyday Life and choose one 25-mark option about either Climate or Tectonics. This is combined Humanities K229 (Social Studies, Geography), not the standalone Geography syllabus K226. The paper lasts one hour 45 minutes, carries 50 marks and represents half the combined Humanities result. Question 1 covers Thinking Geographically, Sustainable Development and Geographical Methods. In Section B, Question 2 covers Climate, while Question 3 covers Tectonics. Answer Question 1 and only one of Questions 2 or 3.
A good G2 Geography answer is an evidence-based explanation, not a memorised list of places. When a map shows shops clustering near a transport node, describe the spatial pattern and explain what might influence it. When a graph shows rising temperature, read its units, time span and variability before making a broad claim. When considering hazard preparations, weigh the people affected, local resources and uncertainty. These skills are learnable, and an early disappointing school mark can help identify what needs teaching rather than limit a student’s future.
Geographical thinking supports interests in transport planning, environmental work, urban design, sustainability, logistics, geospatial technology, tourism and community development. Such careers require further qualifications and suitable course entry, not one G2 Geography mark alone. For the first SEC cohort, 2028 pathways depend on the student’s complete subject-level profile and actual programme requirements. The immediate goal is accurate reasoning about places and processes.
The exact K229 assessment: compulsory versus choice
The official SEAB K229 Paper 2 scheme assigns Section A Question 1 to Cluster 1 Geography in Everyday Life for 25 marks. In Section B, candidates choose either Question 2 Climate or Question 3 Tectonics, each 25 marks. Every structured question has no more than twelve subparts. The selected Section B question includes one six-mark AO3 judgement-and-decision-making item marked using generic levels descriptors, while other parts are point-marked. An approved calculator may be used.
This is not the same as standalone G2 Geography K226. Do not automatically import the standalone Tourism topics or its distinct compulsory paper structure into K229. Nor should students assume that every question on Tectonics will be compulsory: it is a Section B alternative. The student still needs the full Cluster 1 foundation, whichever option is eventually chosen.
The official assessment objectives for Geography contribute 20% Knowledge with Understanding, 20% Skills and Analysis and 10% Judgement and Decision-Making to the combined Humanities qualification. The breakdown helps explain why map reading, fieldwork, data interpretation and defensible recommendations matter alongside knowing definitions. It is not an exact forecast of where every mark will appear in a future paper.
A seven-step routine for any geography question
1. Confirm your school entry is K229 and locate the required Section A and optional Section B. Avoid adding unrelated facts simply to make an answer longer. A single well-supported geographical mechanism is more useful than several remembered examples without a clear connection to the question.
2. Read what must be found, described, explained, calculated or evaluated. Avoid adding unrelated facts simply to make an answer longer. A single well-supported geographical mechanism is more useful than several remembered examples without a clear connection to the question.
3. Identify the correct map layer, scale, data unit, geographical process or source clue. Avoid adding unrelated facts simply to make an answer longer. A single well-supported geographical mechanism is more useful than several remembered examples without a clear connection to the question.
4. Describe observable patterns before proposing a cause. Avoid adding unrelated facts simply to make an answer longer. A single well-supported geographical mechanism is more useful than several remembered examples without a clear connection to the question.
5. Explain the causal relationship with the relevant geographical concept and place conditions. Avoid adding unrelated facts simply to make an answer longer. A single well-supported geographical mechanism is more useful than several remembered examples without a clear connection to the question.
6. For a judgement, weigh criteria, opportunities, risks and limits before making a recommendation. Avoid adding unrelated facts simply to make an answer longer. A single well-supported geographical mechanism is more useful than several remembered examples without a clear connection to the question.
7. Revisit a corrected mistake through a new map, graph, place or dataset without looking at the model. Avoid adding unrelated facts simply to make an answer longer. A single well-supported geographical mechanism is more useful than several remembered examples without a clear connection to the question.
Cluster 1 Topic 1.1: Thinking Geographically
Geographers ask where things are, why patterns appear there, how places are connected and how people shape—and are shaped by—their environment. Key concepts include location, place, space, environment, scale, region, spatial patterns and associations. They help explain everyday experiences in Singapore rather than only distant physical landscapes.
A neighbourhood may have shops clustered around a transport interchange. Describing a cluster is an observation; suggesting that pedestrian access influences businesses is an explanation that requires suitable context or supporting evidence. A map alone cannot establish every shop owner’s motive. Good geographical answers distinguish distribution, association and causation.
Fictional study area: four bus stops and six food shops appear on a neighbourhood sketch map. Five shops are within a short walking distance of two stops, while one is farther away. The visible pattern suggests a possible association between transit access and shop locations. A student should not report the association as a proven commercial planning law based on six fictional observations.
Change the map by adding several shops far from the stops. The pattern becomes less concentrated. If the learner still states that every shop must cluster around transport, they have memorised a claim rather than interpreted the map. This is how changed-place practice teaches geographical reasoning.
Region, hierarchy and spatial scales in Singapore
The syllabus examines Singapore’s nested spaces: residential units can form precincts, precincts can form neighbourhoods, and neighbourhoods form towns. A town centre can serve as a commercial and social hub. A student’s everyday journey crosses several such scales. Use the correct scale when explaining whether a service is for a single building, local precinct or broader town.
An invented planning problem asks whether a new community garden should serve one housing block or several neighbourhoods. The target area changes how access, available land, maintenance and demand should be assessed. A narrow courtyard might suit local residents but not everybody across a town. Spatial scale shapes the validity of a recommendation.
Avoid treating place names as sufficient explanation. Saying ‘it is in Queenstown’ does not explain why a service is suitable. A useful answer might mention a distribution of residents, nearby facilities, transport access and land-use constraints if the question provides relevant data.
Cluster 1 Topic 1.2: Sustainable Development
Sustainable development involves considering environmental, social and economic dimensions while meeting present needs and protecting future opportunities. A proposal can be helpful in one dimension and costly in another. A greener-looking alternative may have a higher initial cost or different maintenance demand. Explain the trade-off rather than automatically describe every conservation measure as cost-free.
Original invented issue: a school can choose between a shaded outdoor reading deck and improving an existing indoor study room. Outdoor greenery may offer environmental and experiential benefits but require maintenance and rain protection. Indoor improvements may offer more predictable access but could increase air-conditioning demand. The best option depends on the stated goals, cost, use patterns and available evidence.
A six-mark style judgement should define a clear criterion and weigh competing effects. If the main goal is inclusive daily study space, accessibility and all-weather use may matter strongly. If the goal is environmental education and biodiversity, an outdoor site may have different advantages. Do not announce a universal winner without considering the purpose.
Cluster 1 Topic 1.3: Geographical Methods
Geographical enquiry involves an inquiry question, relevant data collection, analysis, evaluation and communication. Students undertake bite-sized fieldwork as part of their learning. A national written question can assess methods and their validity without sending candidates outdoors during the examination. Understanding how evidence was produced makes the answer stronger than memorising a definition of sampling.
Ask whether the question is measurable: ‘Do commuters prefer all transport choices?’ is too broad without defining a population and measure. A more workable school enquiry might compare observed pedestrian counts near two access routes over the same selected period. The sample and time of observation should be transparent. That still does not prove how everybody travels all year.
If a school survey uses volunteers’ friends only, the results may not represent the wider student population. If one footpath is counted during morning rush hour and another during a quiet afternoon, the observations are not directly comparable. Students should identify how timing and selection affect validity, then suggest a specific improvement.
A good suggestion might be repeating counts at comparable hours across several days or sampling respondents systematically at several sites. ‘Get more data’ is weaker when it fails to say which missing group, time or condition should be captured and why it matters.
Worked fieldwork exercise: comparing two pedestrian routes
All data here are fictional instructional numbers. Route A has observed pedestrian counts of 35, 40 and 45 in three equal observation periods; Route B has 20, 30 and 25. Route A’s mean is 40 per period; Route B’s mean is 25. The recorded difference is fifteen pedestrians per period under this constructed setup. This supports greater observed use on Route A during those periods, not necessarily higher use on every day of the year.
Before interpreting, check whether periods were equally long and held at comparable times. A 15-minute count cannot be compared directly with a 30-minute count without adjusting to a common unit. If Route A was monitored at school dismissal and B much later, the contrast could arise from timing rather than permanent route preference.
A stronger enquiry might measure both routes simultaneously over several comparable periods and record relevant weather or event circumstances. Do not invent a conclusion that Route A is safer, because counts alone do not establish accident risk, crossings or accessibility.
Reading geographical data: units before interpretations
A bar chart comparing rainfall at several stations and a time-series graph of monthly temperature answer different questions. Always read the title, geographical area, years, unit and vertical scale. A graph that begins at a non-zero temperature can make a small variation visually dramatic. Describe the measured amount and change before making claims about climate causes.
Fictional weather table: January, February and March have rainfall totals of 180 mm, 120 mm and 240 mm at one imaginary site. The mean is 180 mm per month across those three months. March has twice February’s total. The three-month record does not establish the station’s long-term climate or how annual rainfall will change. A valid answer recognises the limited observation period.
Change February to 200 mm. The mean becomes (180 + 200 + 240)/3 = about 207 mm, and March is no longer twice February. Students should recalculate rather than repeat an interpretation of the earlier table. This matters when Climate questions combine an unfamiliar graph with a familiar concept.
Section B option: Cluster 2 Climate
Climate has three topics: Weather and Climate, Climate Change, and Climate Action. The syllabus examines air temperature, precipitation and wind, including relevant geographical processes; evidence for climate variability and change; impacts on nature and society; and responses such as mitigation and adaptation. A student choosing Question 2 needs to connect physical processes with evidence and decisions, not simply repeat that the Earth is getting warmer.
Weather describes atmospheric conditions over a shorter time, while climate concerns longer-term patterns. One rainy afternoon does not establish a changing climate. An exam may present a weather observation, a multi-year trend or two places with different climates. Identify the time span and process. The word ‘climate’ does not automatically make every short-term phenomenon a climate-change effect.
A plausible practical question asks why a coastal site might experience different daily temperature changes from an inland site under comparable conditions. A useful explanation draws on relevant physical processes such as the thermal behaviour of surfaces and movement of air when those details are supplied, rather than simply say ‘the coast is cooler’.
Temperature, precipitation and wind: mechanisms matter
Solar energy, land and water heating, pressure and air movement influence atmospheric conditions. Convection, evaporation and condensation are concepts that can help explain formation of clouds and precipitation in the appropriate weather system. A strong response should link the question’s observations with the relevant process, not list every weather term without distinguishing its role.
A fictional diagram shows warm moist air rising, cooling and condensing. If the task asks how clouds form, explain cooling to the relevant condensation conditions, not a claim that water vapour is solid air. If the task asks what causes the air to rise, use the actual heating or convergence information supplied in the diagram.
Wind concerns air movement related to pressure differences, subject to broader atmospheric influences. A school diagram may simplify to the relevant process; the candidate should not import specialised advanced global circulation models unless the syllabus and question require them. Explain the named system rather than a memorised global slogan.
Climate change: evidence, drivers and impacts
Climate change questions may require recognising evidence from longer-term observations, explaining human influence through greenhouse-gas emissions and comparing possible environmental and human consequences. A graph of atmospheric carbon dioxide and temperature may show a relationship, but the actual task determines what mechanism or conclusion must be described. Do not treat correlation on one chart as sufficient proof of every local event’s cause.
Greenhouse gases influence the Earth’s energy balance through absorption and re-emission of thermal radiation. Emissions from energy use, land-use change and some industrial activities can contribute to anthropogenic warming. The precise cause-and-effect account should use the syllabus’s language and suitable scientific evidence rather than claim the ozone hole directly causes all global warming.
Climate impacts include hazards such as heat waves, droughts, floods, cyclones and wildfires, and indirect pressures on food production, disease regulation and cultural or ecosystem services. Impacts differ by location and exposure. A low-lying community and a dry farming area may face different risks; a successful geographical explanation specifies which process matters to the supplied place.
Worked Climate data question
Original fictional graph has annual average temperatures of 27.0°C, 27.2°C, 27.1°C and 27.5°C across four selected years at a hypothetical monitoring station. The first-to-last change is +0.5°C, but the intermediate values are not monotonic. A description should say temperatures generally rose across the sample while fluctuating, rather than declare that they increased every year.
The data alone do not prove that a particular cause produced the change, nor do four values constitute a full long-term climate assessment. If the question provides further evidence about emissions or heat islands, consider it explicitly. Distinguish describing the graph from evaluating a causal explanation.
Now change the final value to 26.9°C. The first-to-last change is −0.1°C and the original trend interpretation may no longer fit. This changed-question test prevents a student from copying a climate-change paragraph without reading the actual graph.
Climate Action: adaptation and mitigation
Mitigation aims to address greenhouse-gas emissions and the drivers of climate change, while adaptation focuses on reducing vulnerability and coping with its impacts. These strategies can complement each other but are not synonyms. An urban shade structure may help people cope with heat, whereas cleaner energy can reduce associated emissions when properly implemented.
An invented neighbourhood plan considers reflective roofing, tree planting, energy-efficiency improvements and shaded walking routes. Different measures affect costs, maintenance, energy use, thermal comfort and access. A strong judgement explains why one or more choices suit the proposed goal and why a limitation matters. The cheapest option is not automatically the most sustainable over time.
For the six-mark AO3 evaluation in Climate, weigh criteria such as benefits for vulnerable users, feasibility, maintenance and the timing of effects. An answer saying ‘plant trees because nature is good’ names an option but does not evaluate its suitability. An answer considering shade, space, watering and time before canopy develops is more useful.
Section B option: Cluster 3 Tectonics
Tectonics also has three topics: Plate Tectonics, Earthquakes and Volcanoes, and Disaster Risk Management. The syllabus covers Earth’s structure, plate movements, seafloor spreading, divergent and convergent boundaries and transform movement, earthquake and volcanic processes, benefits and risks, and how communities reduce disaster risk.
A key exam habit is to identify what kind of plate boundary is described before predicting a landform or hazard. Divergent movement separates plates and can produce new crust; convergent movement brings plates together and may involve subduction or uplift; transform movement involves plates sliding past each other and can generate earthquakes. The actual types of crust and conditions change the landforms.
It would be misleading to state that every convergent boundary forms the same volcano or that every earthquake produces an eruption. Apply the relevant boundary and rock processes rather than choose an option merely because the diagram has arrows pointing inward.
Plate Tectonics: cause, evidence and location
Earth has layers including crust, mantle and core. Tectonic plates move in relation to processes such as mantle convection and slab pull. Seafloor evidence, earthquake distributions and volcanic patterns contribute to understanding plate movement. Students need enough spatial reasoning to explain where activity is concentrated rather than memorise a world map without meaning.
An invented diagram shows two oceanic plates separating at a ridge with magma rising and new crust forming. The process is consistent with divergent movement and seafloor spreading. Another shows denser oceanic lithosphere descending beneath another plate; that suggests subduction and related hazards. The arrows and geological features support the interpretation.
A student should not claim the plates moved visibly several kilometres during one school excursion. Tectonic change takes place over geological timescales, though earthquakes can produce sudden movement along faults. Distinguish long-term process from a short-term hazard event.
Earthquakes: magnitude is not local exposure
Earthquake magnitude describes an event’s overall size on the specified scale, while the consequences for a community depend on distance, depth, local ground conditions, building vulnerability, population exposure and preparedness. Two locations affected by one event can experience very different damage. A candidate should not equate a large magnitude with identical consequences everywhere.
An invented hazard table compares two towns at different distances from a hypothetical earthquake epicentre. Town A is closer but has more resilient buildings; Town B is farther away but has poorly constructed structures in vulnerable ground conditions. A prediction of damage needs these contextual factors, not distance alone. Read the source details before judging.
The term hazard identifies a potentially harmful physical process; disaster risk also depends on exposure and vulnerability. This distinction is important for recommendations about education, planning, building design and emergency response.
Volcanoes: why people live near risk
Volcanic regions can face lava flows, ashfall and other hazards depending on the eruption and geography, but may also offer fertile soils, minerals, geothermal energy and tourism opportunities. A question asking why communities remain near volcanoes cannot be answered solely by saying residents are unaware of danger. Economic and cultural factors may matter.
If a fictional village farms on fertile volcanic soil but is exposed to ashfall, a responsible risk analysis weighs livelihoods and hazards. Possible actions might include monitoring, evacuation planning and communication systems as appropriate to the described capacity. Do not claim a warning system can prevent a volcanic eruption; it may help reduce harm by improving preparedness.
An exam judgement may require deciding which risk reduction action should be prioritised. The correct answer is supported by the hazard type, likely affected people, time available and relevant financial or institutional constraints, not a memorised one-size-fits-all recommendation.
Disaster Risk Management: preparedness is not prevention
Disaster risk management includes monitoring and understanding hazards, reducing vulnerability, planning responses and building community capacity. Building design can lessen damage in some earthquakes, while monitoring and evacuation routes can help reduce exposure to certain volcanic hazards. However, neither makes the underlying plate motion disappear.
A good six-mark judgement considers whom an action reaches, how practical it is under local conditions and what remains unresolved. A plan that relies on constant internet access may be inadequate where communication infrastructure is vulnerable. A high-cost engineering measure may still be justified for critical facilities in the right circumstances, but that needs evidence.
Human behaviour matters alongside physical processes. Residents need understandable information, reliable drills and routes that consider children, older adults and people with disabilities. A recommendation should include a causal explanation of how the action reduces exposure or vulnerability, not just a list of emergency words.
Worked six-mark AO3 comparison: two coastal community choices
Fictional decision case: a community exposed to a particular natural hazard can invest first in either a warning-and-evacuation system or reinforce a small number of public buildings. The problem states that evacuation routes are limited, several residents need mobility assistance, and the main school acts as a shelter. No real town is being described.
One defensible judgement might prioritise reliable warnings and accessible evacuation planning if they could reach most residents quickly, while acknowledging that weak shelters remain a vulnerability. Another might favour strengthening the school’s shelter where evacuation from the area cannot be completed safely in time. The choice depends on the hazard’s timing, exposure and available resources.
The candidate should present the criterion used and explain the effect of each option rather than merely declare one better. The six-mark answer rewards judgement backed by relevant reasoning. Source context changes whether a recommendation makes sense; there is no universally winning disaster strategy.
Choosing Climate or Tectonics under exam conditions
Students should read both Section B questions before committing. Climate might include a familiar temperature graph but a demanding six-mark evaluation; Tectonics might include a plate diagram the learner understands but an unfamiliar risk case. Choose the option whose data, processes and judgement can be addressed most accurately. Do not select only by the chapter name.
Because Question 1 is compulsory, reserving sufficient time for Geography in Everyday Life is essential. A candidate who studies only the favourite Section B cluster can still miss half the Geography marks. The official 105 minutes is for both portions, not 105 minutes for the selected Climate or Tectonics question alone.
A sample practice split might be roughly 50 minutes for Question 1, 50 minutes for the chosen Section B and five minutes to review, but it is not an official sectional limit. Adjust based on the actual number of subparts, graph complexity and the student’s response pace.
Maps, fieldwork and calculators: prevent avoidable errors
An approved calculator may be used in K229 Geography Paper 2. Use it for valid numerical work such as averages, percentages or rates when the paper supplies quantities, but first check units and denominators. A survey with 18 positive responses among 30 respondents has 60% positive responses; it does not follow that 60% of all residents agree.
When reading a map, use its scale, north direction, symbols and legend. A line drawn on a map can represent a road, river or boundary depending on the legend; interpretation without it is guesswork. Distinguish straight-line map distance from actual travel route distance. The latter may depend on accessible paths and barriers.
For fieldwork, identify which variable is being measured, how samples were selected, the time of measurement and sources of error. A larger number of observations may help, but not if all come from the same unrepresentative group. Propose an improvement that addresses the actual weakness.
The four-week K229 Geography plan
Week 1: map and neighbourhood methods
Analyse a new map, identify spatial distribution and association, and discuss scale and sustainable choices. Diagnose a weak sampling or data interpretation task and retest it on changed figures.
Practice one new map, survey, weather table or hazard source without displaying the earlier model. When the data changes, the conclusion may need to change. Short targeted sessions and sufficient rest can be more effective than repeating a full paper without useful feedback.
Week 2: compulsory Geography in Everyday Life
Practise Topic 1.1 Thinking Geographically, Topic 1.2 Sustainable Development and Topic 1.3 Geographical Methods through a realistic twenty-five-mark-style cluster of shorter questions.
Practice one new map, survey, weather table or hazard source without displaying the earlier model. When the data changes, the conclusion may need to change. Short targeted sessions and sufficient rest can be more effective than repeating a full paper without useful feedback.
Week 3: learn the option’s processes and judgement
Revise the Climate and Tectonics content in the school’s programme. Use unseen graphs or diagrams and practise a six-mark AO3 judgement with competing criteria and a defensible conclusion.
Practice one new map, survey, weather table or hazard source without displaying the earlier model. When the data changes, the conclusion may need to change. Short targeted sessions and sufficient rest can be more effective than repeating a full paper without useful feedback.
Week 4: actual Paper 2 rehearsal
Attempt Question 1 plus one of Questions 2 and 3 within 105 minutes using approved tools. Review interpretation, choice, completion and whether the judgement really used the supplied context.
Practice one new map, survey, weather table or hazard source without displaying the earlier model. When the data changes, the conclusion may need to change. Short targeted sessions and sufficient rest can be more effective than repeating a full paper without useful feedback.
What to expect across secondary school
Secondary 1 Geography establishes observation, spatial scale and simple relationships between people and places. Secondary 2 develops richer data interpretation and enquiry. Upper-secondary K229 connects sustainable choices with real geographical methods and Climate or Tectonics concepts. In Secondary 4, learn the official section choice and assessment conditions before national examinations.
The sequence is guidance, not a claim that every school follows exactly the same chapter dates. Subject combinations and levels are governed by school arrangements. A student who struggles with one map question should be helped to interpret its symbols and scale rather than labelled permanently poor at Geography.
Parents, tutors and further study
Ask a learner which map feature supports their description, what survey method could improve an inference and why an option would suit the particular place. A tutor should teach the missing process and give a changed question that the child completes independently. Small groups can support individual correction, but their size alone does not guarantee effective teaching.
Geography skills can lead toward interests in built environment, environmental sustainability, urban mobility, spatial data, climate resilience and community planning. Relevant later qualifications and actual 2028 admission rules still matter. G2 Geography is a foundation that can be improved with good teaching, not an automatic career pass or restriction.
Frequently asked questions about K229 Geography
What is the duration and weight of Paper 2?
One hour 45 minutes, fifty marks and 50% of combined Humanities K229.
Which question is compulsory?
Question 1 on Geography in Everyday Life, worth 25 marks.
How many Section B questions are answered?
Only one: Question 2 Climate or Question 3 Tectonics, worth 25 marks.
Is a six-mark judgement question included?
Yes. The selected Section B question has one six-mark AO3 judgement-and-decision-making question.
Can I use a calculator?
An approved calculator is permitted.
Is Tourism part of the K229 Geography paper?
Do not confuse K229 with standalone K226; K229 Paper 2 covers the specified Everyday Life, Climate or Tectonics clusters.
Must I study Geographical Methods?
Yes. It belongs to the compulsory Cluster 1.
Can a fieldwork answer be correct with a biased sample?
It may accurately describe the observed sample, but broader conclusions require evaluating how representative and valid the evidence is.
Is a larger earthquake always more destructive in every place?
No. Exposure, distance, local conditions, vulnerability and preparedness affect consequences.
Does climate change mean every single year is warmer?
No. Weather and year-to-year variation can occur within longer-term climate trends.
Will this subject guarantee a sustainability diploma?
No. Entry depends on the complete SEC profile and receiving programme requirements.
The K229 Paper 2 readiness checklist
- My registered G2 Humanities code is K229.
- I know Question 1 Geography in Everyday Life is compulsory and carries 25 marks.
- I can select one of Climate or Tectonics in Section B for the other 25 marks.
- I understand the six-mark AO3 judgement component and evaluate actual criteria.
- I can read maps, graphs, units and source contexts carefully.
- I can discuss fair fieldwork and specific improvements.
- I can explain a climate or tectonic process without repeating only its name.
- I have completed one changed 105-minute practice paper with an approved calculator and proper time allocation.
Related eduKateSG Geography and Humanities reading
G2 Social Studies Paper 1 source and digital-answer guide
Complete K229 Social Studies/Geography survival guide
Standalone G2 Geography K226 guide
G2 Humanities geography parent guide
G2 languages and Humanities 2027 directory
Maps, graphs and tables across SEC subjects
2028 eligibility and further-study pathways
Official syllabus and post-secondary information
SEAB 2027 Humanities K229 Social Studies/Geography official syllabus
SEAB 2027 SEC G2 syllabus directory
MOE 2028 post-secondary admissions announcements
The assessment structure and topic names follow the official 2027 G2 K229 syllabus reviewed in October 2026. Every survey, map, temperature table and hazard-choice scenario is invented teaching material, not a national examination question or a real local fieldwork finding. Confirm the registered school subject and current official course requirements.