
You have twenty tree-ring cores. Do you have evidence from twenty trees? That depends on where the cores came from. Two cores from one trunk can reveal different local growth details, but they still share that tree’s history. Counting columns without counting trees can overstate replication and give heavily sampled trees extra influence.
This lesson works from invented, already crossdated growth indices. You will calculate the difference between averaging cores and averaging trees, compare two ways to spend additional sampling effort, and explain why a chronology can change when its contributing trees change. The short examples are arithmetic models, not authentic chronologies or evidence for a particular past climate.
Read The Gold Standard of Dendrochronology for the wider discipline. This article continues the practical learning approach of The Gold Standard of Education within How X Works.
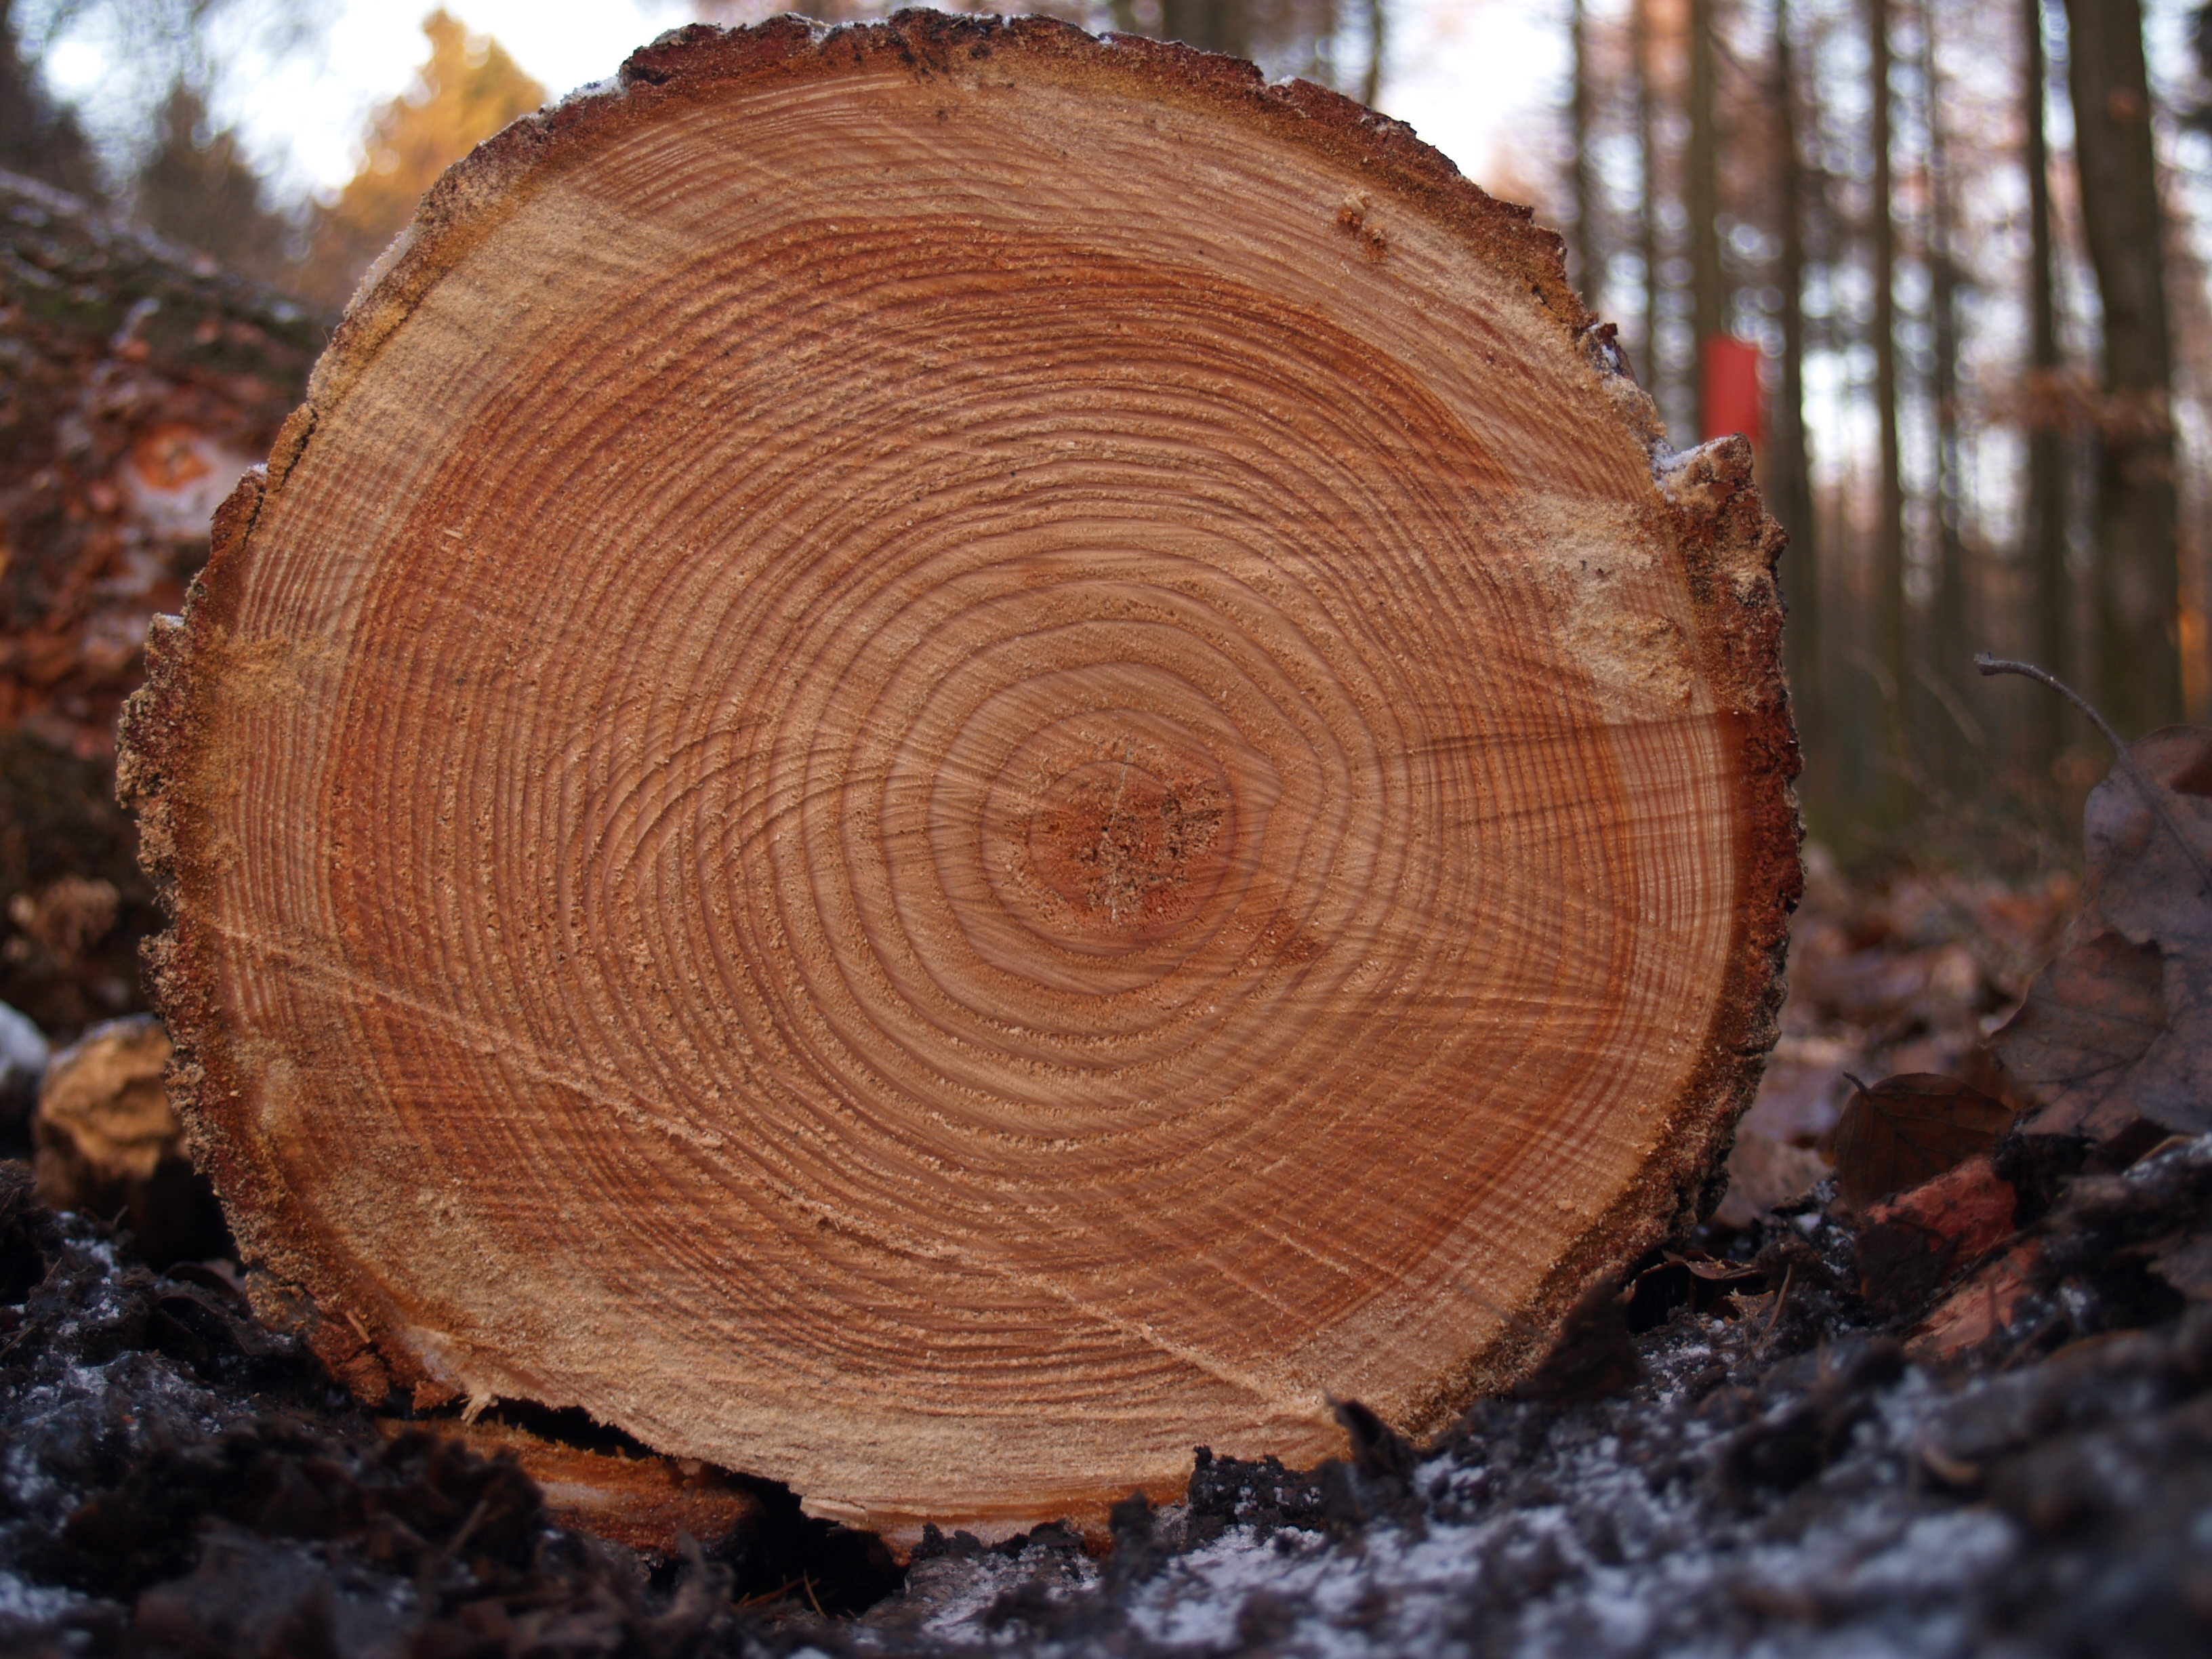
Header photograph: a real tree-trunk cross-section by Arnoldius, from Wikimedia Commons, licensed CC BY-SA 2.5. It illustrates tree rings; none of the numerical records below was measured from this photograph.

eduKateSG · The Gold Standard of Dendrochronology
Choose your reading route
Identify the sampling unit · Chapters 1–2. Build the quantities before using a formula.
Calculate weighting and dependence · Chapters 3–5. Follow original examples, assumptions and changed conditions.
Audit replication and transfer · Chapters 6–8. Test transfer, answer common questions and follow connected reading.
Full chapter index · Practice and evidence checks · Return to Dendrochronology
Chapter index
Identify the sampling unit · Chapters 1–2
Calculate weighting and dependence · Chapters 3–5
Audit replication and transfer · Chapters 6–8
CHAPTER 1 OF 8 · Identify the sampling unit
1. Identify what was independently sampled
A measurement can have several nested identities: a ring, a measured radius or core, a tree, a site and a region. A question about one tree’s growth can benefit from several radii. A question about a woodland requires evidence about the woodland’s trees, not merely more measurements from one unusually accessible trunk.
Two cores from the same tree share age, much of their genetic background, local growing conditions and many disturbances. Their values need not be identical. One radius can be affected by local injury or uneven growth. Their shared history nevertheless means they cannot automatically be treated as two independently selected trees.
Replication should be named at the level of the claim. Report the number of series or cores and the number of distinct trees. Where the claim spans sites, also report the sites and how they were selected. Twenty trees on one slope do not automatically represent twenty independent woodland environments.
This is the practical danger often described as pseudoreplication: treating observations that share an important source of dependence as if they supplied independent replication for the question being tested. The remedy is not to throw away extra cores. It is to use them at the appropriate level and carry their relationships into the analysis.
The sampling foundation connects sampling units with the population a result is intended to describe. Dendrochronology adds an especially visible hierarchy because several measured sequences may belong to the same living organism.
CHAPTER 2 OF 8 · Identify the sampling unit
2. Align and define the measurements before averaging
Crossdating comes before an average by calendar year. A mean of values assigned to the wrong years can look smooth while combining different growth seasons. The University of Arizona’s crossdating explanation describes comparison within trees and among trees as part of assigning the sequences to calendar time.
You must also decide what the values represent. Raw widths in millimetres, detrended indices and transformed series are not interchangeable. An older or slower-growing tree can have smaller raw widths for reasons unrelated to the environmental variation of interest. Standardisation choices influence which variation remains available to interpret.
For the calculations in this article, assume the values are dimensionless, crossdated growth indices prepared under an appropriate, documented procedure. We are isolating the effect of grouping and weighting, not prescribing a complete chronology-building method. No three-year example is enough to establish a reliable real-world crossdate.
Keep a table linking every series identifier to its tree and site. A naming convention is helpful only if it has been verified against field and laboratory records. Similar-looking labels can belong to different trees, while renamed samples can belong to one tree. A software grouping error can change the effective weights before any statistical model is fitted.
The dplR treeMean documentation provides a concrete implementation of averaging cores within a tree using a tree/core mapping. Our examples below define missing-data handling explicitly and do not rely on a software default.
CHAPTER 3 OF 8 · Calculate weighting and dependence
3. Calculate how unequal core counts change a mean
Suppose one calendar year has two cores from Tree A and one each from Trees B and C. Their invented indices are as follows.
| Tree | Available core indices | Within-tree mean | Weight in an equal-core mean |
|---|---|---|---|
| A | 1.4 and 1.6 | 1.5 | 2/4 = 50% |
| B | 0.5 | 0.5 | 1/4 = 25% |
| C | 0.5 | 0.5 | 1/4 = 25% |
The equal-core mean is (1.4 + 1.6 + 0.5 + 0.5)/4 = 1.0. The equal-tree mean first averages within A and then averages the three trees: (1.5 + 0.5 + 0.5)/3 = 0.8333…, approximately 0.833.
Neither calculation has an arithmetic error. They answer differently weighted questions. The first gives every measured core the same weight. The second gives each included tree the same total weight. If the intended summary is an equally weighted mean of these three trees, collecting an extra core from A should not silently double A’s representation in the woodland summary.
Now add a third core from A with index 1.5. The core mean becomes (1.4 + 1.6 + 1.5 + 0.5 + 0.5)/5 = 1.1. The tree mean stays (1.5 + 0.5 + 0.5)/3 ≈ 0.833. No tree has changed its stipulated mean. The first result rose because the high-index tree acquired a larger sampling weight.
Equal-tree weighting is a transparent option, not a universal professional requirement. Robust means, explicit precision weighting and other methods can be appropriate for particular purposes. Their weights and estimand—the quantity the method is intended to estimate—should be stated. A weight chosen through a documented model is different from an accidental weight created by the number of available files.
CHAPTER 4 OF 8 · Calculate weighting and dependence
4. Compare another core with another tree
A small statistical model makes the value of extra cores clearer. For one year, write each core’s index as a shared mean plus a tree-specific deviation plus a local core error. Assume the tree deviations have variance Vtree, the core errors have variance Vcore, and the relevant deviations and errors are independent under this model.
For m cores per tree, the within-tree average has variance Vtree + Vcore/m. Averaging n independently sampled trees gives variance (Vtree + Vcore/m)/n. Additional cores reduce the local-error term. They do not divide away the tree-specific term. These are stipulated model assumptions, not measured variance components for a real forest.
Take Vtree = 0.09 and Vcore = 0.01 in squared-index units. Compare three balanced designs with simple equal-tree means.
| Design | Variance of the estimated mean | Standard error |
|---|---|---|
| 10 trees, 1 core each | (0.09 + 0.01)/10 = 0.0100 | 0.1000 |
| 10 trees, 2 cores each | (0.09 + 0.01/2)/10 = 0.0095 | About 0.0975 |
| 20 trees, 1 core each | (0.09 + 0.01)/20 = 0.0050 | About 0.0707 |
Both expanded designs use twenty cores. Under these assumptions, sampling more trees improves precision much more because between-tree variation dominates. The second core remains useful: it can improve a tree’s measurement and support crossdating or anomaly checks. Its value is not fully described by one standard-error calculation.
Change the context. If Vtree = 0.01 and Vcore = 0.09, the ten-tree, two-core design has variance (0.01 + 0.09/2)/10 = 0.0055 and standard error about 0.0742. Extra cores now help substantially because local error is larger. This prevents the opposite misconception that repeated cores are always wasteful.
Real series also have time dependence, unequal lengths, spatial relationships and method-specific transformations. The model is a reasoning aid for one year’s mean, not a formula for every chronology confidence interval or a rule for how many cores to collect.
CHAPTER 5 OF 8 · Calculate weighting and dependence
5. Watch the trees entering and leaving the chronology
The number of contributors can change from year to year. Imagine Trees A, B and C retain constant within-tree indices of 1.5, 0.5 and 0.5 across a short invented interval. When all three are present, their equal-tree mean is approximately 0.833.
In the final year, suppose only A has usable measurements. Under a rule that averages the available trees, the reported mean becomes 1.5. The increase of about 0.667 is entirely due to the changing contributor set in this example. It is not evidence that any tree grew more strongly in the final year.
Report year-specific series depth and tree depth. A chronology with twelve cores from three trees differs from one with twelve cores from twelve trees. Also inspect which trees contribute, not just how many: replacing one set with another can alter composition while leaving the count unchanged.
Missing values require a stated rule. If one of A’s two cores is unavailable, do you retain A’s other valid core for that year, require overlap, or use a different model? Each choice changes the evidence being averaged. Missing measurement is not a growth index of zero, and filling it with zero would create an artificial narrow-growth signal.
A common-period analysis, contributor plot or sensitivity analysis can help expose these effects. None automatically removes sampling bias. Trees lost through damage, survival or selection may differ systematically from those retained. The tree-ring and past-climate guide connects these processed chronologies to the separate task of environmental calibration.
CHAPTER 6 OF 8 · Audit replication and transfer
6. Use checks that respect the grouping
Start with the identity map. Check that every core belongs to the intended tree and site, that duplicate measurements are labelled, and that all included years have been crossdated appropriately. Record the transformation used to produce an index and the rule for unavailable values.
Compare the intended weighting with the actual computation. A useful diagnostic is to add a duplicate copy of one core in a test dataset. If the analysis is intended to give each tree equal weight, investigate any unintended change in that tree’s total influence. This test does not create evidence; it checks whether the code follows the stated grouping rule.
When evaluating prediction to unseen trees, keep all cores from a tree together in training or evaluation groups. Otherwise a held-out core can share tree-specific information with a training core, making the test easier than prediction for an independent tree. If the intended claim is about new sites, a split by tree alone may still be too permissive.
Transfer task one: a study increases its archive from 30 to 60 cores, all by taking a second core from the same 30 trees. Has independent tree replication doubled? No. The archive has more within-tree information, while the number of sampled trees remains 30.
Transfer task two: an equal-core mean rises after researchers add cores from the widest-index trees. Must the regional signal have increased? No. Recalculate with the declared weighting and inspect contributor changes before interpreting a physical trend.
Transfer task three: a sample has strong agreement between two cores, but both come from the same tree. Does that alone establish a regional drought year? No. The agreement is useful within-tree evidence. A regional interpretation needs suitable additional trees, site context and independent environmental support.
Use existing open data or clearly labelled synthetic records for these learning exercises. Field sampling of living trees or heritage timber requires suitable expertise, permission and care; the arithmetic does not justify collecting a new core.
CHAPTER 7 OF 8 · Audit replication and transfer
7. Frequently asked questions about replication
Are two cores from the same tree redundant?
Not necessarily. They can help identify local growth irregularities, improve measurement and support crossdating. Their shared origin simply needs to be represented correctly in claims about replication.
Should every chronology average cores within trees first?
Not as an automatic rule. The appropriate processing order and weighting depend on the scientific aim and method. The essential requirement is to understand and justify how cores, trees and sites contribute to the reported quantity.
Does a large number of trees guarantee a representative sample?
No. A large sample from one age class, slope or surviving group can still miss the target population. Selection and dependence matter alongside count.
Can I treat each year from one tree as a new independent tree?
No. Repeated years describe temporal observations from that organism. Their dependence and the question being tested must be modelled appropriately. Longer records and more independently sampled trees provide different kinds of information.
CHAPTER 8 OF 8 · Audit replication and transfer
8. Continue from ring measurements to defensible conclusions
Tree-ring foundations
- Dendrochronology subject root connects crossdating, growth and historical inference.
- Teaching Dendrochronology develops classroom explanations and crossdating exercises.
- Tree rings and past-climate evidence explains calibration and environmental interpretation.
- Sapwood bounds and felling-date ranges separates preserved outer wood from historical-event claims.
Sampling and broader interpretation
- How Sampling Works connects selection, weighting and the intended population.
- Palaeoclimatology places tree-ring evidence among other climate proxies.
Authoritative method references
- University of Arizona Laboratory of Tree-Ring Research: crossdating explains the calendar-alignment principle.
- dplR: means across cores within trees documents a tree/core grouping implementation.
Before saying that a chronology has more evidence, name what increased: measured radii, distinct trees, sites, years or genuinely independent validation. That simple sentence protects the meaning of the whole result.