
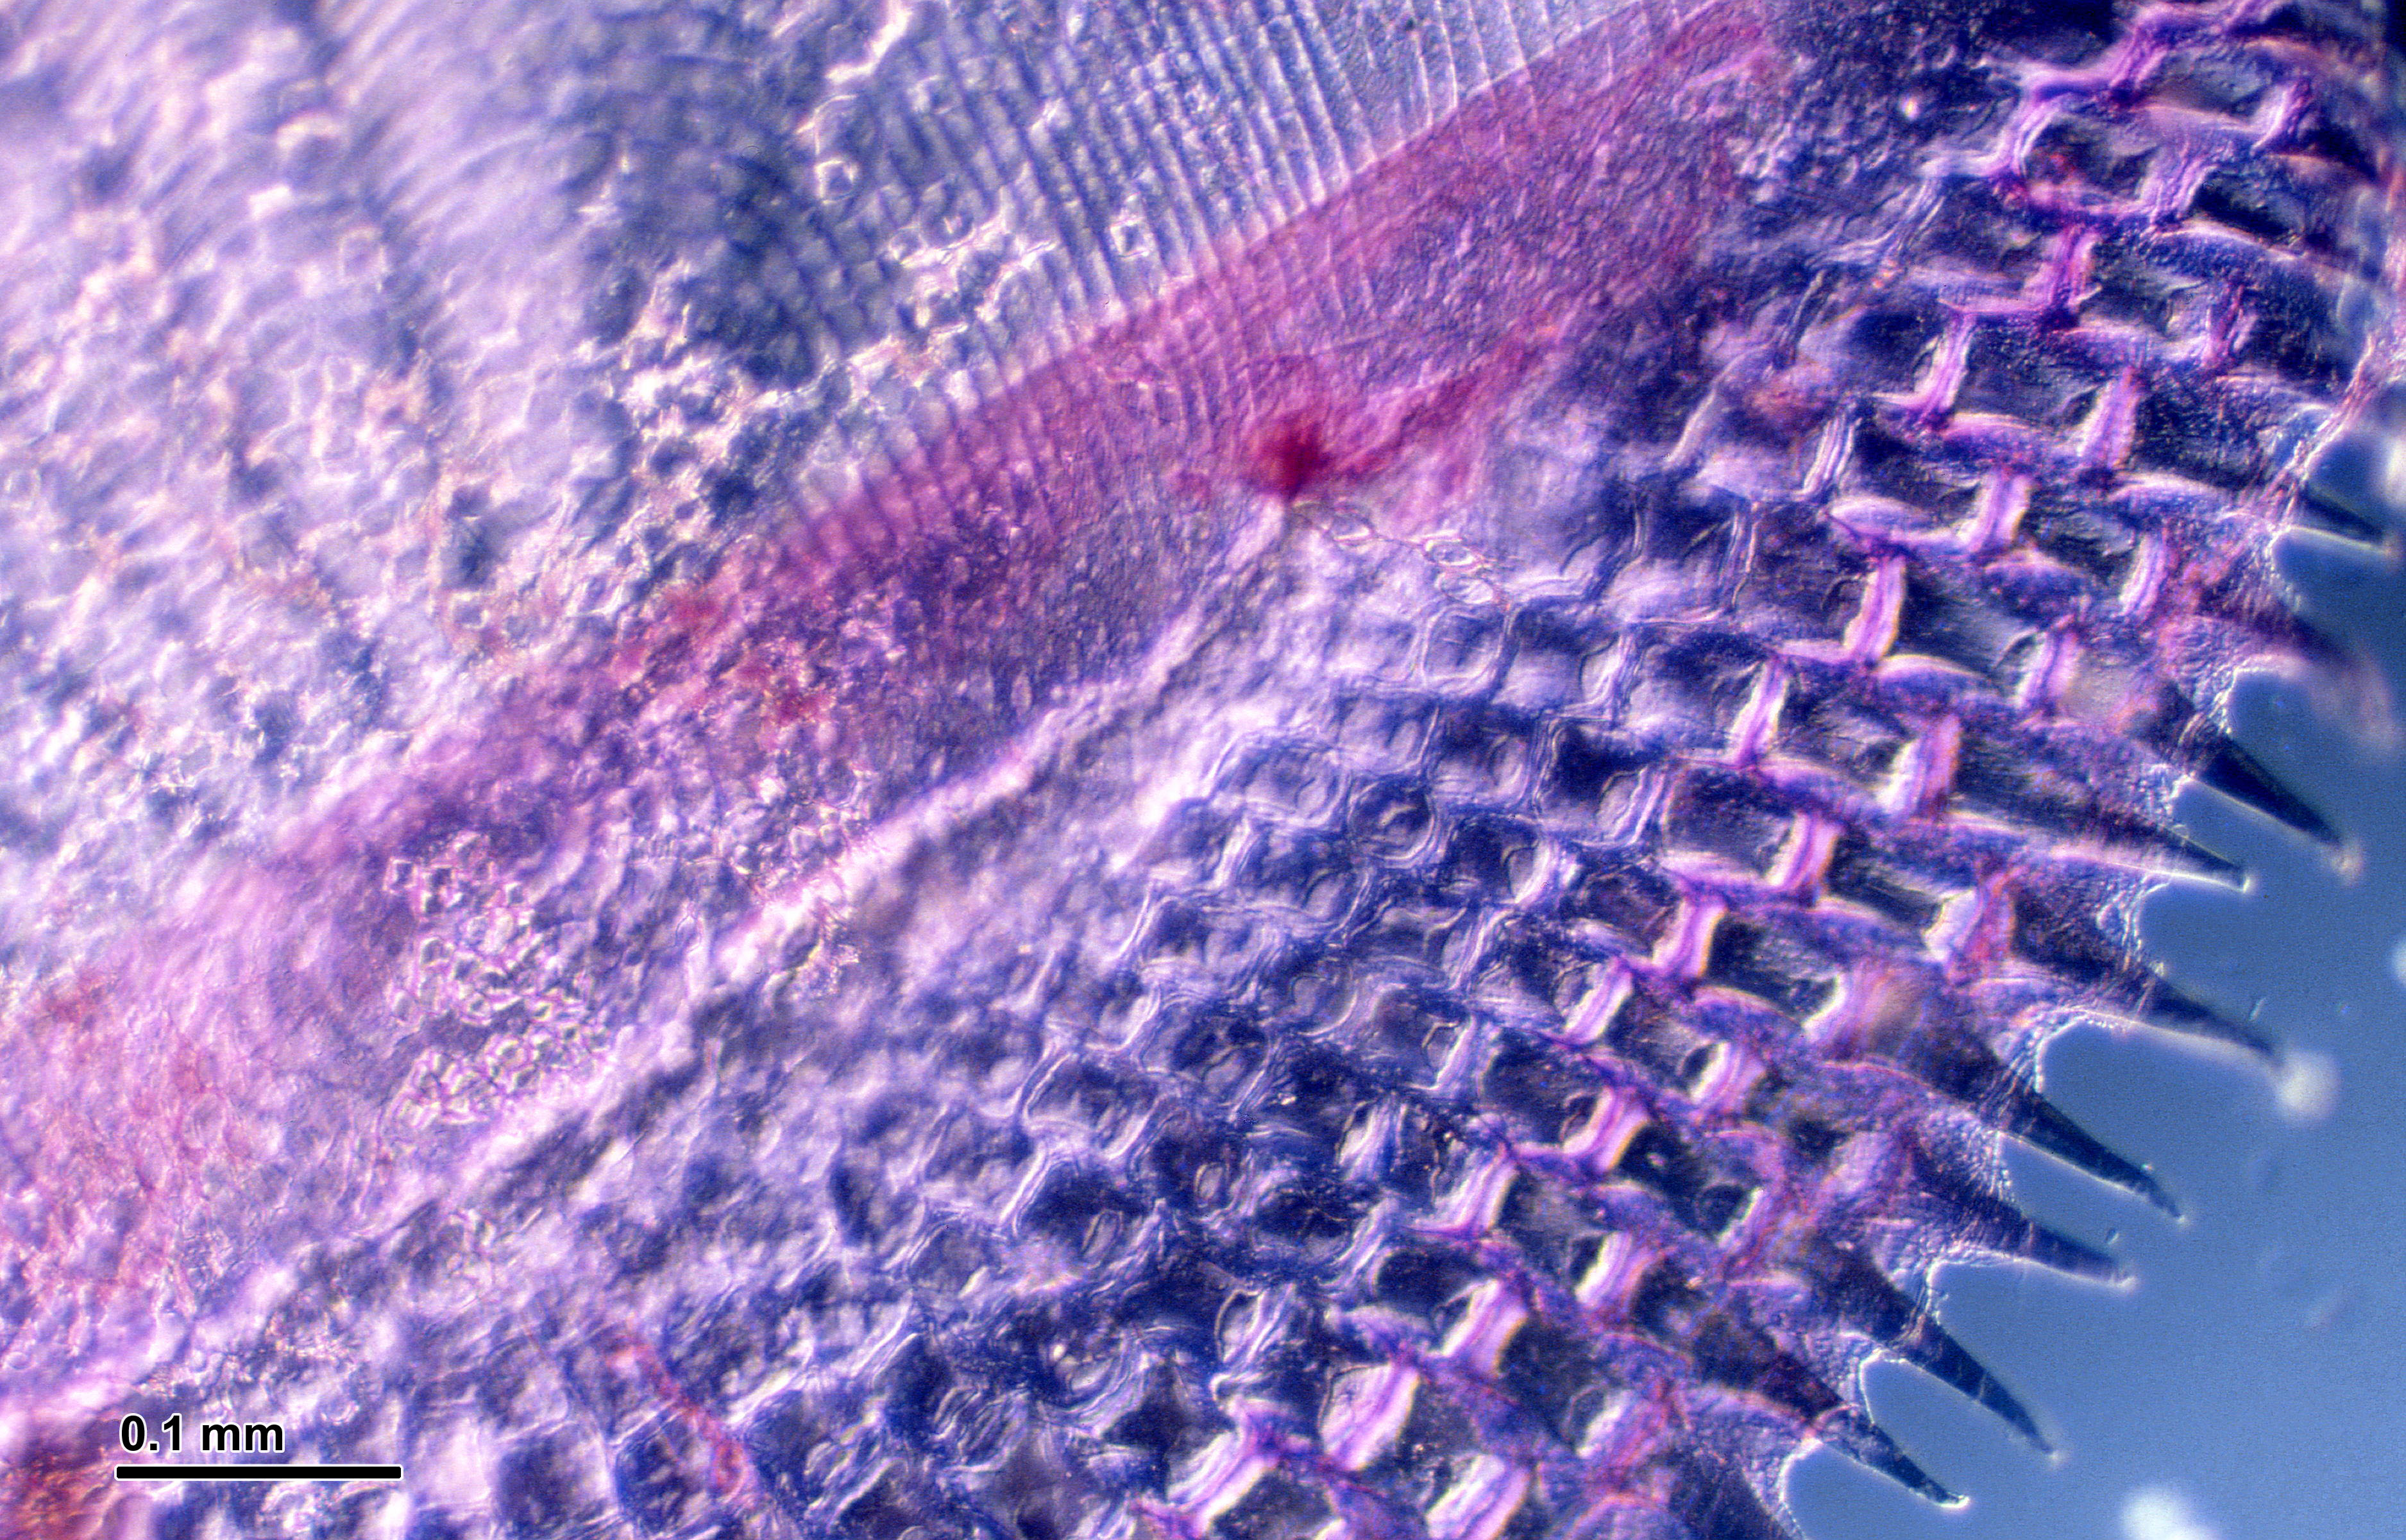
Fish scales can preserve microscopic evidence of growth, species-related morphology, sedimentary transport and human interaction with fish. Ctenoid and cycloid structures provide useful reference characters, but a scale is not an individual fish and visible growth ridges are not automatically annual age markers. This guide teaches how to identify what was found, calculate defensible sediment measures and recognise the preservation and regeneration limits that make many attractive fish-history claims uncertain.
The original Riverbend Lake worked example is fictional, with invented counts and sample masses. The featured ctenoid scale photograph is an authentic modern microscope preparation by Josef Reischig, not a fossil from Riverbend or an excavation. The chapters below move from scale anatomy to growth zones, laboratory recovery, archaeological source history and independent corroboration.
Begin with NOAA’s fish-ageing guidance and research on scale preservation in sediment archives.


1. The direct evidence is a scale, not a historic catch
Fish scales can survive in sediments, occupation layers and residues on stone tools. Their microscopic surface structures may support identification and sometimes ageing of fishes. But an individual scale is not one fish, one fishing event or direct evidence that an ancient community ate a particular species. Fish shed scales, carcasses break down, sediments move and archaeological recovery selects what survives. The proper starting question is which feature on the scale is actually diagnostic and how that object reached the deposit.
Ask learners to distinguish three statements: a ctenoid fish-scale fragment was identified; a scaled fish contributed material to the archaeological layer; inhabitants caught a particular fish in one season. The first may be supported by observed microscopic morphology. The second requires site formation context. The third is a considerably stronger historical claim that needs independent indicators. Scientific teaching succeeds when learners keep these inference levels separate.
2. Understand why fishes have different scale types
Scales are protective elements with differing structures among fish lineages. Many teleosts possess cycloid or ctenoid scales, while other fishes have ganoid or placoid structures, and some lack ordinary overlapping scales entirely. A classroom diagram showing one round concentric plate should not be treated as a universal fish anatomy. Taxonomic and anatomical context matters before an unknown archaeological scale can be confidently assigned to a species or used in an age calculation.
Give students a reference tray containing labelled images of cycloid, ctenoid, ganoid and placoid structures. They should classify what the pictures genuinely show and flag which groups could not be identified from incomplete fragments. A useful introductory exercise shows how broad morphological categories differ from fine taxonomic identification. A ‘ctenoid’ label is a structural description, not proof of a named fish.
3. Recognise cycloid morphology precisely
Cycloid scales commonly have a smoother distal border and visible circuli around a focus, although details depend on species and scale location. They can be translucent and may preserve radii extending toward the outer margin. Old or broken specimens may lose the diagnostic edge entirely. Correct description should include margin, focus, circuli and any visible grooves, rather than rely on whether the fragment looks broadly round.
Ask students to annotate a cycloid reference micrograph with the focus, concentric ridges and any radiating grooves. They should record the scale bar and which edge was preserved. Where the distal margin is missing, a classification may be less secure. This builds the habit of describing features actually seen before importing a taxonomic interpretation.
4. Understand ctenoid spines and avoid misidentification
Ctenoid scales are distinguished in many taxa by comb-like ctenii along part of the posterior margin. The featured authentic microscope image shows such a ctenoid structure in a modern prepared teleost fish scale. However, spine appearance changes with taxon, developmental condition and damage. A fragment containing only a few pointed structures does not justify a confident fish species name, and a broken ctenoid scale may superficially resemble another type.
Students should compare complete reference images with one missing its spine-bearing margin. They decide what category remains justified and which features would be necessary for a narrower identification. A modern anatomical micrograph can teach how ctenii look, but it is not evidence that any particular ancient specimen had identical structure or was caught near the fictional lake introduced later.
5. Distinguish true circuli from annual annuli
Circuli are growth ridges that may be numerous within a single year; annuli are periodic growth-zone features that may correspond to annual cycles under validated conditions. Counting every visible circular line as one year is a common error. Seasonal slowing can bring ridges closer together, but irregular growth checks, damage and species-dependent patterns complicate the interpretation. An age reading is a calibrated inference from the pattern, not a simple line count.
Ask students to mark five narrow growth ridges and one broad annual boundary on a hypothetical image. Which objects are circuli and which represent a validated annulus? They should document the decision rule, not merely write an integer. The first-principles task is to distinguish a physical mark from the temporal interpretation a method assigns to it.
6. Identify the focus and radius before ageing
The focus is the early formation region of a scale, and growth patterns extend from it toward the margin. Interpreting annuli requires a consistent reading axis and knowledge of where age features tend to be clearest for the taxon. Scale growth can be asymmetric; the nearest outer edge is not automatically the correct path. Breakage or deformation may obscure the focus and invalidate the apparent count.
Have learners annotate a scale and mark several possible reading transects. They should justify the one that best preserves comparable growth information. If the focus is absent, they must state how the age estimate becomes uncertain or unusable. A reproducible marked image is stronger scientific evidence than a bare age label.
7. Learn the anatomical source of a scale
Scales from different regions of the same fish can vary in shape, size and readability. Species-specific fish ageing protocols often select a particular body region to reduce inconsistency. An isolated archaeological scale typically lacks that original anatomical location, making age reconstruction more difficult than controlled sampling from a modern live or freshly caught fish. A protocol validated for a shoulder scale cannot automatically be applied to any fragment in a midden.
Present students with two modern scales from different body regions of one fish, then one archaeological fragment with no known location. Ask which assumptions are defensible and which must remain unknown. The objective is to recognise that an ancient object can be morphologically informative while not suitable for a precise lifespan estimate.
8. Understand scale loss and regeneration
Many scaled fishes can lose scales and regenerate replacements. Regenerated scales may lack the normal early growth pattern, producing a deceptive focus and incomplete annulus record. NOAA Fisheries highlights regenerated scales as unsuitable for reliable age determination. Such scales can enter natural sediments through everyday shedding, not necessarily fish death or human processing.
Give learners an invented pair: a normally developed scale and a regenerated scale with disorganised central growth. They should identify the limitations of each before counting rings. This exercise is foundational because a beautiful concentric outer pattern can still omit a fish’s early life; microscope clarity alone is not evidence of complete age history.
9. Explain older-fish ageing bias
Even in taxa where scale annuli are useful for young fish, growth can slow with age and produce tightly packed marginal features that are difficult to read. In some long-lived species, scale-based ages underestimate true ages. A 2026 Fisheries Research study of asp described increasing underestimation in older fish, with sex-specific patterns, illustrating why a fixed correction is not universally transferable. The lesson should be an evaluation of method validity, not a new universal rule that scales never work.
Ask students to compare ageing results from scales and validated otoliths for hypothetical younger and older fish. They should explain why agreement in young fish does not prove the scale method is unbiased for old individuals. Where late annuli crowd or cease to be distinguishable, a confident maximum-age claim would be unsupported.
10. Compare scales with otoliths rather than treating them as synonyms
Otoliths are mineralised inner-ear structures, while scales are external body coverings with different growth and resorption characteristics. Both can show increments, but their reliability depends on species, preparation and age. Otoliths often provide more dependable old-age estimates, while scales are easier to collect without killing fish in many research contexts. The choice of structure should match the research question and the condition of the archaeological evidence.
In class, students receive separate imagery of an otolith and a ctenoid scale. They list which features support age or ecological analysis and where validation is necessary. The existing eduKate otolith teaching guide covers isotope and harvest-season questions; this chapter focuses instead on scale identification, regeneration, deposition and fragment-based archaeological analysis.
11. Use validation data rather than counting intuition
A convincing scale-age method can be validated with fish of known age, mark-recapture studies, marginal increment analyses or comparison with other adequately validated structures. The interpretation of an annulus can vary by species, growth regime and region. A method that performs well in one fishery may require modification or may fail in another. Apparent regularity on a photograph is not a substitute for independent evidence that one counted zone forms each year.
Ask a learner to design a validation study using a reference set of known-age fish and blind independent scale readers. They should report accuracy, reader agreement, systematic underestimation and unresolved features separately. Scientific confidence grows when the method’s actual errors are measured rather than assumed.
12. Document inter-reader precision
Age reading can involve judgement about false checks, closely packed annuli, broken edges and irregular circuli. Two analysts may obtain different estimates from the same scale even when both apply a plausible rule. Blind rereads and comparison with validated references help characterise repeatability. Forced agreement can conceal uncertainty rather than resolve it.
Create an imaginary ten-scale exercise in which two readers agree on six age estimates and disagree by one or two zones on four. The exact agreement is sixty percent, but this does not establish accuracy without known-age controls. Students must explain why agreement, precision and correctness are related but different qualities.
13. Keep archaeological recovery and screening visible
Archaeological scales may be small, translucent, easily broken and overlooked during coarse excavation. Recovery depends on mesh size, wet sorting, sediment mass, preservation and the experience of the analyst. A fish-rich archaeological site excavated by hand may yield few scales even if many originally entered the deposit. Counting only conspicuous scales can overrepresent robust forms or particular fish sizes.
Students compare a fine-sieved deposit and an older hand-collected deposit. Before declaring fishing declined between periods, they identify recovery-effort differences and request comparable sediment processing. The report must record what proportion of recovered material was diagnostic and how much sediment was examined.
14. Identify scales in residues on tools
Fish-scale fragments can remain attached to artefacts used in contact with fish, including stone tools. The 2016 Internet Archaeology experimental residue study provided images of cycloid scale morphology associated with reference tool surfaces, including radii and concentric circuli. Such evidence is powerful when contextualised, but a scale on a tool does not by itself prove one exact activity, because handling, contact, sediment movement and post-excavation contamination offer alternative pathways.
Ask students to compare microscopic scale residues on a reference flint with scales dispersed in surrounding soil. They should propose controls for sediment background, handling, and the artefact’s conservation history. A sound use-wear or residue claim requires an evidence chain, not merely a beautiful micrograph.
15. Separate local fish presence from transported scales
Fish scales can enter lake sediments through local shedding, carcass breakdown, predator feeding, floods, human fish processing and transport of fish products from elsewhere. Scales found in archaeological rubbish might have come from dried, smoked or traded fish rather than fish captured beside the settlement. The presence of a taxonomically identifiable scale establishes a source of material, but the geography of that source requires additional evidence.
Present a fictional inland household that consumed imported coastal fish. A marine scale occurs in a refuse pit. Students should not automatically reconstruct a marine shoreline at the settlement. They map processing, trade and natural transport possibilities, then identify which bones, chemistry or documentary evidence would help distinguish them.
16. Understand shedding and mortality signals
Living fishes may shed some scales during normal activity, predation attempts or contact with obstacles. Dead fish can release many scales as their bodies decay. Consequently, a change in recovered scales may reflect life activity, mortality, fish abundance or taphonomic events. A sediment core with many scales is not automatically a record of a massive fish die-off.
Ask learners to describe three processes that can deliver the same number of scales to sediment: many fish each losing a few, one disintegrating carcass and a current transporting old scales. Their task is to propose sedimentological and biological evidence that could separate the hypotheses. This is essential for converting count-based sediment archives into credible population reconstructions.
17. Recognise fragmentation and abrasion
Scale edges may wear, tear or fracture during transport, digestion, burial, excavation or slide preparation. Fragment counts can increase as intact scales disappear, creating false abundance changes if every piece is counted as a separate object. Diagnostic characters such as ctenii, focus and radii may be lost selectively. An honest fossil report therefore includes preservation classes alongside taxonomic identifications.
Give students a tray of one complete scale and five fragments from another. Ask how a fragment tally, an intact-scale tally and a confidence-qualified taxonomic tally would differ. They should preserve the raw observations and avoid a simplistic conversion to the number of original scales.
18. Teach sedimentary preservation as a separate process
Fish-scale survival depends on chemical and biological burial conditions. Degradation, microbial and fungal damage, sediment oxygen and mechanical disturbance can influence the preserved population. Research off Peru’s oxygen minimum zone developed multiple preservation indices, including scale wholeness and ratios of scales to other fish skeletal parts, because apparent scale flux may reflect selective loss as well as fish population change.
Ask students to review a hypothetical core in which more scales are broken and damaged in younger sediment. Does a lower intact count mean fewer fishes lived nearby? It could instead reflect preservation. A stronger inference compares preservation indices, sediment environment and independent fish remains before selecting a population explanation.
19. Use a clear whole-scale ratio
A useful descriptive preservation statistic is the proportion of intact identified scales among all classified whole and fragmentary scale objects under a consistent observation rule. This is not a universal correction for original fish numbers; its value is that the reader can see a change in preservation condition. The rule must state whether one fragment is counted individually, whether refitting was attempted and how small indeterminate debris was handled.
Introduce a fictional Riverbend Lake comparison: older A contains ninety-six intact and twenty-four fragmentary scale objects from four grams of sediment. Younger B contains fifty-four intact and fifty-four fragmentary objects from six grams. Students calculate both total objects per gram and intact share. The outcomes differ in informative ways, but neither automatically represents historical fishing intensity.
20. Worked Riverbend concentration arithmetic
Under the imagined common preparation, Riverbend A contains 96 + 24 = 120 classified objects from 4 g, or thirty objects per gram. B contains 54 + 54 = 108 objects from 6 g, or eighteen objects per gram. The younger deposit therefore has fewer counted scale objects per gram even though both have substantial recoveries. This result is an observation of processed sediment, not a calibrated relative biomass estimate.
To test denominator literacy, students must explain why dividing by sediment mass makes the raw data more comparable while still leaving differences in sedimentation, transport and preservation. They should use the terms classified scale objects per gram rather than fish per gram or catches per year.
Invented Riverbend Lake specimen record
| Interval | Intact scales | Fragmentary scale objects | Total objects | Dry sediment |
|---|---|---|---|---|
| Older A | 96 | 24 | 120 | 4 g |
| Younger B | 54 | 54 | 108 | 6 g |
21. Worked Riverbend preservation arithmetic
In Riverbend A, intact scales represent 96 of 120 classified objects, or eighty percent. In Riverbend B, intact scales represent 54 of 108, or fifty percent. The intact-scale rate is 24 per gram in A and nine per gram in B, while fragmentary object rates are six and nine per gram respectively. The direction of change depends on whether one plots intact remains, fragment objects or proportions.
Students should propose several possible sources of the difference: burial chemistry, transport energy, variable degradation, selection or real ecological change. The data by themselves cannot isolate which factor dominates. Their final report must present the underlying table so that another reader can evaluate all of the alternatives.
Invented Riverbend quantitative comparisons
| Measure | Older A | Younger B |
|---|---|---|
| All classified scale objects per gram | 30 | 18 |
| Intact scales per gram | 24 | 9 |
| Fragmentary objects per gram | 6 | 9 |
| Intact share of classified objects | 80% | 50% |
22. Consider fragment production when interpreting population
One scale may be broken into multiple fragments, so the number of preserved classified objects can vary without a corresponding change in the number of original scales. A site that produces more fragments could artificially inflate object counts relative to a more gently deposited layer. Conversely, extremely degraded fragments may be lost in processing, lowering observed totals. Neither a simple percentage nor a per-gram rate corrects this automatically.
Have students simulate a single original scale being broken into two, four and eight pieces. They should calculate how fragment counts change despite unchanged biological input and explain why a taxonomic diagnosis might become less reliable as pieces shrink. This makes taphonomic bias tangible.
23. Distinguish scale flux from sediment concentration
Concentration per gram describes the proportion of a processed sediment sample represented by scale objects, but a deposition flux per surface area and time additionally requires accumulation-rate estimates and appropriate units. Faster mineral sedimentation can dilute scales even if their arrival rate remains constant. Slow accumulation may concentrate them. A study of historical fish populations from lake or marine sediment should therefore evaluate sediment chronology and accumulation before translating concentration into abundance.
Present two invented periods with the same rate of incoming scales but unequal sediment supply. Students should predict how counts per gram could change even when source population has not. The learning outcome is to distinguish a sediment mixing ratio from a time-normalised flux. Those variables belong on different graph axes and support different claims.
24. Learn from marine pelagic fish-scale archives
Studies of laminated marine sediments off western North America and Peru have recovered fish scales as evidence relevant to changing pelagic stocks and productivity. Such research integrates scale accumulation, chronology and preservation, often in unusually favourable sediment settings. The approach offers instructive methods, but its biological and sedimentary context cannot be transplanted uncritically to a small inland pond or a domestic archaeological midden.
Ask students to list what changes when a method moves from a low-oxygen marine basin to an oxygenated freshwater lake: deposition mechanisms, preservation, species ecology and transport area. A sound adaptation must test those factors rather than assume the same scale count means the same fish biomass.
25. Recognise fish scale evidence in the Green River Formation
The Eocene Green River Formation preserves striking fish fossils across lacustrine environments. Published research on its depositional settings describes scattered bones and scales among different lake facies and notes that material can fall from decomposing floating carcasses. This provides a direct counterexample to the assumption that every scale came to rest exactly where its fish lived or died on the bottom.
Give learners a diagram of an ancient lake with a floating carcass and sinking loose scales. They should separate the living habitat, place of death, route of transport and final sedimentary position. Geological age does not remove the need for a formation history.
26. Keep species identification conservative
Some scale structures provide valuable taxonomic clues, but similar patterns recur across species and individual fishes can show morphological variation. An isolated fragment that lacks key diagnostic margins may justify only a broad group. Species claims require comparative collections and expert assessment, particularly when an archaeological interpretation depends on fish ecology, salinity or migration.
Ask students to compare several scale images from closely related taxa and identify which features genuinely discriminate them. If they cannot, the appropriate outcome is a higher taxonomic rank and a written uncertainty note. Scientific value does not depend on forcing every scale to the species level.
27. Consider depositional chronology and reworked scales
A scale found in a dated layer is associated with that sedimentary context, but it may have been shed earlier, stored in soil, or reworked by floodwater before burial. Sediment age-depth models also carry uncertainties, and some cores contain hiatuses or mixing. A sharp concentration peak cannot automatically be assigned to one historic fishing regulation or climate event.
Give students a fictional fishery closure date and a core whose relevant layer spans several decades. They should state the actual degree of chronological overlap and propose independent records that would help evaluate a causal relation. A responsible environmental historian does not turn broad dates into precise events simply because a graph has fine tick marks.
28. Use historical archaeology without inventing diet
Fish scales may enter settlements through processing, storage, trade, cleaning, bait preparation or refuse movement. A scale on an artefact can contribute to a use interpretation, yet positive evidence of food preparation may require bones, residues, tool wear, hearth context or historical records. Scale presence alone does not tell whether people cooked, ate or traded that fish.
Students reconstruct two equally plausible histories for scale-bearing debris in a market-area ditch. One involves local fish cleaning, another transport and disposal of imported fish. They then propose a targeted independent test, such as species-validated bone identification or recorded supply routes. The lesson rewards discrimination among alternatives, not unearned certainty.
29. Preserve heritage and collection ethics
Archaeological samples can be limited and protected. Scales removed from curated artefacts or rare sediment sections may be valuable evidence for future analysis. Teaching can use licensed reference photographs, modern approved collections and synthetic calculations without consuming irreplaceable material. Any destructive or solvent-based processing of protected objects needs trained oversight, proper permissions and a meaningful research justification.
Have learners write a sample stewardship note covering excavation record, tool condition, scale images, handling, remaining sample fractions and planned retention. They must explain what information another researcher would need to check the identification and counts. Proper archiving is part of credible science.
30. Write an honest fish-history conclusion
Riverbend’s invented data show thirty versus eighteen classified scale objects per gram, with intact shares of eighty and fifty percent. These are useful descriptive differences, not proof that ancient fish stocks fell, that residents overfished, or that a particular fishing technology appeared. The marked increase in fragmentary representation is itself a reason to investigate preservation before attributing the trend to biological abundance.
A high-quality report should offer a primary observation, multiple testable formation histories and a targeted plan for discriminating between them. It should also explain when scales are unsuitable for precise age estimates and when independent otolith or skeletal evidence would help. The gold standard is a reproducible argument that does not claim more than the recovered objects permit.
Twenty-eight focused archaeological and fisheries-method audits
The exercises are original fictional situations. Each targets a specific scale-identification, age-reading, recovery or historical-inference failure rather than representing excavated findings.
1. The circulus age mistake
A learner counts twenty-five individual fine ridges and announces a twenty-five-year-old fish. The class distinguishes circuli from validated annual boundaries and explains why species-specific reference images are needed.
2. The regenerated focus
A clean outer scale edge surrounds a disorganised regenerated centre. Students decide whether a lifespan estimate is defensible and why regenerating scales can omit earlier history despite clear new growth.
3. The old-fish bias
A young fish’s scale and otolith age agree, while older fish show crowded scale edges. Students discuss why young-reference success does not validate old ages and how systematic underestimation could distort a historical catch profile.
4. The smooth-versus-comb margin
Two fragments differ in posterior margin structure. Learners assess cycloid versus ctenoid identification while recording damage. A fragment without a preserved diagnostic edge may remain unclassified.
5. The ctenoid reference photograph
An authentic modern ctenoid scale image is labelled as an ancient Riverbend specimen. Students correct the figure caption and distinguish scientific reference from fictional data.
6. The fish species overclaim
A fragment has a few concentric lines but lacks enough features for species diagnosis. Reviewers require suitable comparators and explain why a broad teleost classification may be the strongest defensible result.
7. The reused sieve
One sediment series was processed with much coarser mesh than another. Fewer scales appear in one sample, and a draft claims the fish disappeared. Students document recovery differences and propose comparable methods.
8. The whole-scale denominator
Older Riverbend contains ninety-six intact scales and twenty-four fragments in four grams. Students calculate thirty total objects per gram and an eighty-percent intact share using explicit observation categories.
9. The younger denominator
Younger Riverbend contains fifty-four intact scales and fifty-four fragments in six grams. Learners calculate eighteen objects per gram and a fifty-percent intact share without equating those observations with ancient fish numbers.
10. The fragment multiplication
One original scale is broken into eight visible pieces. Students explain how object totals can rise without any extra fish or scales and demonstrate a consistent treatment of refitting and uncertain fragments.
11. The no-fish declaration
A sediment interval yields no fish scales, but it was poorly sorted and preservation is aggressive. Students state detection limits and consider other fish fossils before asserting historical absence.
12. The market trade alternative
A marine fish scale turns up in an inland household. Students distinguish imported fish products from local marine environmental conditions and propose independent trade or species evidence.
13. The used stone-tool residue
A fish scale appears on a stone flake. Learners consider fish processing, background sediment, handling contamination and use-wear before inferring one specific ancient activity.
14. The floating carcass
Scales settle in deep lake mud from a decomposing floating fish. Students explain why the findspot need not equal the habitat, death location or place of fishing.
15. The preservation index
A sample contains many broken scales with fungal damage. Learners evaluate preservation rather than treating its raw count as direct stock abundance. They describe indices that might help characterise the bias.
16. The fake annual fishery chart
An archaeological core with decades-wide age ranges is graphed as fish catch per year. Students correct the chronology and identify what a true deposition-rate model would need.
17. The marine-to-lake transfer
A method calibrated on laminated marine sediments is applied directly to a mixed freshwater pond deposit. Students list differences in fish species, preservation, source area and sedimentation.
18. The age reader disagreement
Two readers disagree on several annuli because one confuses stress checks with annual marks. Students retain both records, compare validated reference material and distinguish agreement from accuracy.
19. The missing scale source
An isolated scale lacks anatomical body-region information. A learner nonetheless applies a protocol validated for one standard sample site. Peers explain the uncertainty and identify alternative questions the scale can still answer.
20. The chemical damage case
A fossil scale has a pristine-looking focus but degraded margin. Students determine whether a species description, size measure or age estimate is still justified under the specific preservation.
21. The ctenoid fragment miscount
Three pieces of the spine-bearing edge from one scale are entered as three complete scales. Students separate diagnostic fragment observations from reconstructed intact objects.
22. The high sedimentation dilution
New mineral sediment accumulates rapidly while fish-scale supply remains steady. Students explain why objects per gram can fall even without a decline in fish populations.
23. The imported dried fish
Fish remains occur with pottery but no local fishing equipment. Learners compare trade, food processing and local capture hypotheses, using archaeological context instead of assuming a single activity.
24. The questionable growth ring
A large annulus-like check appears halfway along a scale, but no validated annual formation rule is available for this species. Students record the feature without inventing an age.
25. The species without scales
A dominant local fish taxon lacks ordinary protective scales. Students explain why a scale-based fish assemblage can underrepresent it and why species composition needs independent anatomical evidence.
26. The otolith comparison
An age study favours otoliths for one species but the archaeological collection contains only scales. Students decide which limited findings remain publishable and when precise lifespan claims should be withheld.
27. The map of fish scales
Several scales are concentrated near a river channel. Learners investigate flood transport, sediment sorting, human discard and predator activity before labelling the cluster a prehistoric fishery.
28. The editor’s final audit
A draft manuscript treats Riverbend’s scale-count decrease as proof of overfishing. Students preserve the calculations but add the fragment-preservation warning, age-model uncertainty and alternative formation histories with a targeted next test.
Specialist calibration and reproducibility clinics
1. Circuli and annulus clinic
Students annotate a real-scale image and explain which structures are merely ridges and which may be validated annual zones. Their assessment records uncertainty and source-specific reading criteria.
2. Anatomical location clinic
Present modern scales from different body positions and a location-unknown fossil. Students identify which ageing assumptions no longer transfer and how to document the missing source information.
3. Validation clinic
Learners construct a small known-age comparison with independent readers and scale-based age estimates. They report mean bias, exact agreement and errors separately instead of choosing one flattering score.
4. Preservation clinic
Provide classes of whole, broken and chemically altered scales. Students calculate preservation proportions and test whether excluding damaged material changes the inferred sediment trend.
5. Source-area clinic
Map a lake, river inflow, nearby fish market and disposal pit. Students trace plausible routes for scales, then identify which additional artefacts or sediment observations could narrow the history.
6. Chronology clinic
An object-rich layer overlaps a documented fishing regulation, but the age uncertainty is wide. Students state what temporal compatibility does and does not prove.
7. Sieve audit clinic
Two processing protocols retain different size fractions. Learners plan a comparable reference experiment and explain why published counts cannot be merged until recovery bias is assessed.
8. Sediment flux clinic
Using the same object concentration but different accumulation rates, students explain how calculated flux depends on an age and sediment model. The output must retain correct units and uncertainty.
9. Taxonomic rank clinic
A beautifully stained scale lacks diagnostic characters for species assignment. The class must choose a higher-rank identification and explain what would justify narrowing it.
10. Fish-age ethics clinic
Students compare nonlethal scale sampling of modern fish with archaeological destructive sampling and modern otolith extraction. They discuss when each method’s information gain is proportional to its costs and limitations.
11. Multi-proxy clinic
Scales, otoliths, vertebrae, fish bones and aquatic microfossils disagree across one core. Learners investigate survival, source area, chronology and different units before selecting a preferred biological story.
12. Publication handover clinic
A student gives a colleague only a smooth fish-history chart. The colleague asks for specimen photographs, intact/fragment definitions, sediment weights, age estimates and code. A good article should permit independent reconstruction.
Three-session scientific teaching pathway
- Session 1 — anatomy and identification: recognise cycloid, ctenoid, focus, circuli, radii, ctenii and the appearance of regenerated scales; annotate real reference micrographs.
- Session 2 — age and preservation: distinguish annuli from growth checks, compare with otolith methods, audit whole and broken scale counts and calculate fictional Riverbend concentrations.
- Session 3 — archaeological history: evaluate natural shedding, fish processing, transport, sedimentary flux, chronology, independent palaeoecological evidence and collection ethics.
- Student submission: scale-character record, sample provenance, processing and specimen categories, two correctly calculated denominator tables, alternative formation hypotheses and a referenced evidence-bounded conclusion.
Gold Standard assessment rubric
| Question | Adequate research evidence | Unsupported shortcut |
|---|---|---|
| What structure is it? | Diagnostic margin, circuli, focus, radii, completeness and taxonomic uncertainty | Every fragment assigned to a species |
| Is the age reliable? | Validation, regeneration, growth checks and reader precision evaluated | Each fine ridge counted as a year |
| Are samples comparable? | Sediment mass, mesh, sorting effort, intact and fragment categories stated | Raw totals called fish abundance |
| Could burial alter the signal? | Degradation, transport, sedimentation and reworking assessed | Lower intact count automatically means fewer fish |
| What does archaeological context allow? | Tool wear, food remains, natural transport and trade distinguished | One scale used as proof of cooking |
| Can results be reproduced? | Original observations, photographs, age-model limits and sources kept | Only a polished population graph supplied |
Frequently asked questions
Can an archaeological fish scale identify a species?
Sometimes, with adequate diagnostic structures and a reliable comparative reference. Many fragments support only broader taxonomic categories.
What is the difference between ctenoid and cycloid scales?
Ctenoid scales commonly have comb-like ctenii on an outer border, while cycloid scales typically have smoother edges.
Are scale circuli the same as annual age rings?
No. Circuli are growth ridges; annuli require species-specific validated periodic interpretation.
Why are regenerated scales problematic?
Replacement scales may not retain early growth history, making age estimates incomplete or misleading.
Are scales as reliable as otoliths for old fish?
Not universally. Many ageing studies find that scale annuli become crowded or incomplete in older individuals, so method choice must be validated by species and age.
Does one scale correspond to one fish?
No. A fish bears many scales, may shed or regenerate them, and a single scale can break into multiple fossil fragments.
Can fish scales in sediment show ancient fish population changes?
They can contribute in well-controlled cases, but preservation, sedimentation, transport and chronology must be assessed before quantitative interpretation.
Does a scale on a stone tool prove fish was cooked?
Not alone. Archaeological context, tool use-wear, background sediment and contamination controls matter.
Why report intact and broken scale counts separately?
Fragmentation can change recovered object totals and taxonomic readability independently of original fish abundance.
Are the Riverbend Lake numbers real observations?
No. Riverbend Lake is a fictional teaching case using invented intact and fragmentary scale counts and sediment masses.
Scientific references, microscope image credit and connected eduKate articles
- NOAA Fisheries: age and growth, scales and regeneration limitations
- NOAA Fisheries: techniques and equipment for fish ageing
- Canadian Department of Fisheries and Oceans: fish age validation
- American Fisheries Society: scales in fish age and growth
- 2026 study: scale age underestimation in long-lived asp
- Scale preservation in sediments off Peru
- Vancouver Island late Holocene pelagic fish scale record
- Fish deposits and scale taphonomy in Green River Formation
- Internet Archaeology: fish-scale residues on prehistoric reference tools
- Modern ctenoid fish-scale micrograph by Josef Reischig and license
- Teaching Archaeological Otolith Analysis
- Teaching Archaeological Cladoceran Analysis
- Teaching Zooarchaeology
- The Gold Standard of Palaeoecology
- The Gold Standard master hub
The gold standard of teaching archaeological fish scale analysis is a learner who can identify real diagnostic features, recognise when annuli are invalid or incomplete, explain how fragments and sediment processes shape the sample and give a precise but limited account of what scales reveal about the past.