
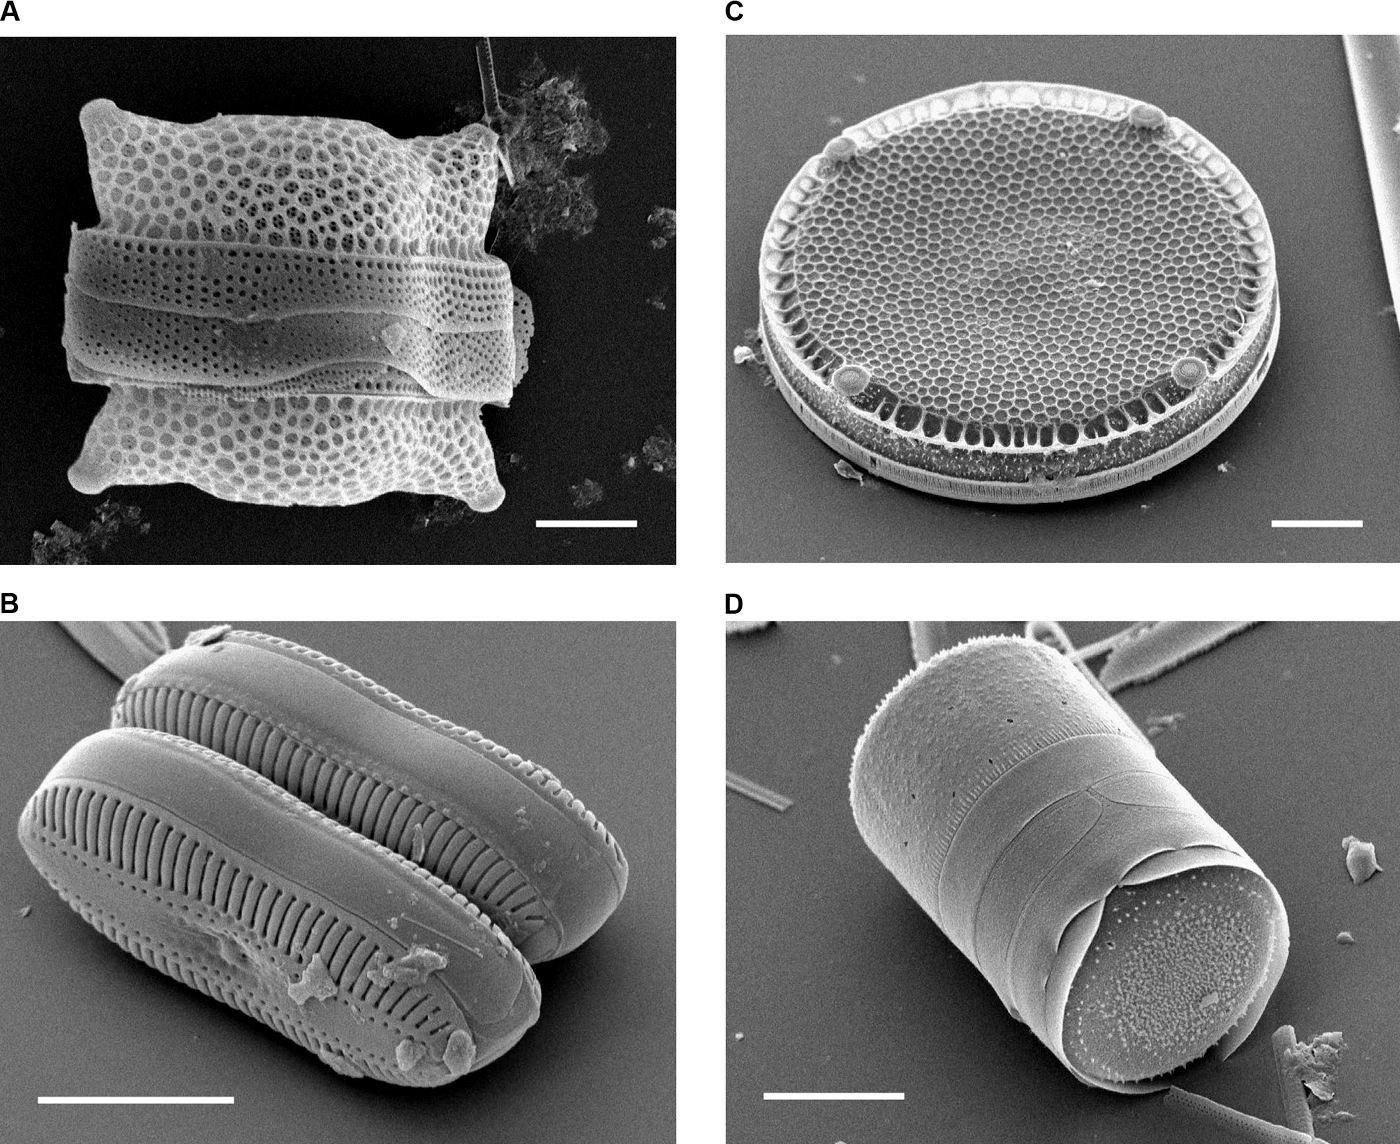
Phycology is the study of algae: their diversity, biology, relationships and roles in ecosystems. It connects microscopic cells and large seaweeds through questions about light, nutrients, reproduction, growth and environmental conditions. The organisms grouped under algae are diverse, so the name is a scientific starting point rather than one uniform biological design.
Imagine green water in a pond. Its colour is an observation. Rapid algal growth, high oxygen production and a harmful bloom are different possible claims. Each needs its own evidence. The gold standard identifies the organisms and the measured process before attaching an environmental explanation.
This root joins the existing diatom, freshwater and marine guides through a wider account of algal science. Its invented oxygen-budget exercise separates gross production, net oxygen change and community respiration; a second case explains why a cell count does not directly measure biomass.
Featured image: diatom micrographs courtesy Mary Ann Tiffany / Bradbury, PLOS Biology, via Wikimedia Commons, CC BY 2.5, unmodified. They illustrate one algal group and are unrelated to the invented pond records.

This guide connects with The Gold Standard of Education and How X Works: learn the mechanism, test an explanation and use the relationship in a changed setting. All numerical datasets here are invented teaching examples, not reported field measurements.
Find your next question
Choose a route, or read from the beginning. Teaching chapters stay open; the grouped index helps you return to a method or calculation.
Full chapter index · Practice and answers · Connected guides and sources
Chapter index
Meet algal diversity · Chapters 1–3
Follow light and oxygen · Chapters 4–6
Work the quantitative examples · Chapters 7–10
Interpret abundance and change · Chapters 11–13
Study and continue · Chapters 14–16
Algae include unicellular forms, colonies, filaments and large multicellular seaweeds. Their evolutionary relationships, cell structures and life cycles differ. Phycology studies that diversity rather than assuming all green aquatic growth belongs to one kind of organism.
Some algae live in water; others occur on moist surfaces, soils or other settings. Seaweeds are marine macroalgae, while phytoplankton describes a mode of life in the water column. These terms do not divide organisms into identical taxonomic ranks.
The Smithsonian algal collection illustrates the breadth of the subject. Begin by choosing which group and process the question concerns. A result from a small freshwater culture should not become a general law for every seaweed and planktonic assemblage.
CHAPTER 2 OF 16 · Meet algal diversity
2. Cyanobacteria and algae need a clear terminology boundary
Cyanobacteria are photosynthetic bacteria and are often called blue-green algae in older or applied terminology. They do not have the same cell organisation as eukaryotic algae. Both can appear in practical monitoring, but the distinction matters for identification and interpretation.
A field label may group several photosynthetic organisms together for a particular survey purpose. State that convention explicitly. It should not imply that the organisms share every cellular feature or environmental response.
The same care applies to common names. A seagrass is a flowering plant, whereas a seaweed is an alga. A green colour alone cannot identify either one. Useful terminology keeps the biological mechanism visible.
CHAPTER 3 OF 16 · Meet algal diversity
3. Identification begins with morphology and a suitable reference
Record habitat, sample method, cell or thallus structure and the features used for identification. Some groups require microscopic characters that an ordinary photograph cannot resolve. Others need additional specialist information before a confident species assignment is possible.
A reference database has a defined scope. The Natural History Museum’s AlgaeVision, for example, covers specified freshwater and terrestrial material from Britain and Ireland and does not include diatoms. No single image collection is a complete catalogue of all algae.
Keep unresolved categories rather than forcing a name from superficial resemblance. The level of identification should match the evidence. A reliable group-level observation can still support a useful ecological or physiological question.
CHAPTER 4 OF 16 · Follow light and oxygen
4. Photosynthesis fixes carbon while respiration releases usable energy
Photosynthetic algae use light energy in processes that build organic material from inorganic carbon. Oxygenic photosynthesis produces oxygen. Respiration consumes organic substrates to support cellular activity and, in aerobic respiration, uses oxygen.
Both processes can occur in illuminated algal material. The observed oxygen change in a light incubation is therefore a balance, rather than the full amount of oxygen produced by photosynthesis.
At night, photosynthetic oxygen production stops while respiration can continue. In a natural water body, atmospheric exchange, mixing, other organisms and chemical processes also affect dissolved oxygen. A single oxygen reading does not isolate algal activity.
CHAPTER 5 OF 16 · Follow light and oxygen
5. Light availability changes through water and through time
Water depth, suspended material, dissolved substances, self-shading and the surface light cycle influence the light experienced by algae. More sunlight at the surface does not mean every cell receives the same dose.
Photosynthetic responses depend on the organism and its acclimation. Low light can constrain production, while very high exposure can also reduce performance under some conditions. An experimental result should describe the light environment rather than merely label a treatment bright.
Compare like with like. If bottles are incubated at different depths or temperatures, an oxygen difference may reflect more than one changed condition. A clear experiment separates the variable being tested from the conditions intended to remain comparable.
CHAPTER 6 OF 16 · Follow light and oxygen
6. Define production and respiration before using a bottle method
A simplified light-and-dark bottle comparison starts with a common oxygen concentration. The light bottle records photosynthesis and respiration; the dark bottle excludes photosynthesis and records net oxygen consumption under the incubation conditions.
In mixed pond water, the dark-bottle oxygen loss can include respiration by organisms other than algae. The calculation is therefore commonly a community budget, not an isolated measure of algal respiration.
Estimating gross oxygen production from the difference between light and dark bottles assumes, among other things, comparable relevant respiration and no important unaccounted oxygen fluxes. These assumptions are part of the method. They should appear beside the calculation.
CHAPTER 7 OF 16 · Work the quantitative examples
7. Work a complete light-and-dark oxygen budget
In an invented four-hour incubation, starting dissolved oxygen is 8.0 mg/L. The light bottle ends at 9.2 mg/L and the dark bottle at 7.2 mg/L. Assume comparable initial water and bottle conditions, no gas exchange and equal relevant respiration between treatments.
Net light-bottle change is 9.2 − 8.0 = 1.2 mg/L, or 0.30 mg O₂/L/hour. Dark oxygen consumption is 8.0 − 7.2 = 0.8 mg/L, or 0.20 mg O₂/L/hour.
Estimated gross oxygen production is 1.2 + 0.8 = 2.0 mg/L over four hours, or 0.50 mg O₂/L/hour. Equivalently, compare the final light and dark values: 9.2 − 7.2 = 2.0 mg/L. This is an oxygen-based estimate under the stated assumptions.
| Invented measurement | Value | Interpretation |
|---|---|---|
| Initial oxygen | 8.0 mg/L | Common starting condition |
| Final light bottle | 9.2 mg/L | Net change +1.2 mg/L |
| Final dark bottle | 7.2 mg/L | Consumption 0.8 mg/L |
| Estimated gross oxygen rate | 0.50 mg O₂/L/hour | (9.2 − 7.2) ÷ 4 |
CHAPTER 8 OF 16 · Work the quantitative examples
8. State what the oxygen result does not measure
The estimated rate is per water volume and per incubation time. It is not automatically a daily rate for the whole lake. Scaling requires depth, light conditions, spatial coverage and the changing day–night cycle.
Nor is oxygen mass identical to carbon mass. Converting between oxygen production and carbon fixation needs an appropriate stoichiometric relationship and assumptions about the processes involved. Keep the original oxygen units unless that conversion is justified.
The bottle can alter conditions by enclosing organisms, changing light exposure or restricting movement and exchange. The method is useful, but the experimental result and the open-water ecosystem are different systems. Explain the connection rather than assuming it.
CHAPTER 9 OF 16 · Work the quantitative examples
9. Nutrients can limit growth, but limitation is an experimental question
Algal growth depends on resources as well as light and temperature. A nutrient can be limiting when additional availability increases growth under the tested conditions. The identity of the limiting resource can vary across sites, seasons and organisms.
A high nutrient concentration does not alone demonstrate rapid growth, and a low concentration can reflect rapid uptake. Concentration is one part of the evidence, not an automatic diagnosis of the process.
Use suitable comparisons to test a proposed constraint. An experiment should distinguish added nitrogen, added phosphorus, both together and a control where relevant. Replication and consistent starting material help separate treatment response from ordinary variability.
CHAPTER 10 OF 16 · Work the quantitative examples
10. Interpret an invented nutrient-addition experiment
Suppose replicated, comparable teaching treatments produce mean biomass increases of 2 units in the control, 3 with added nitrogen, 2 with added phosphorus and 8 with both additions. These are invented means, with no uncertainty information supplied.
The large combined response suggests an interaction or joint resource constraint worth investigating. It does not justify claiming that phosphorus never matters or that nitrogen alone explains the system.
Inspect replicate variation, starting conditions and the actual biomass measure before drawing a strong conclusion. Repeat across relevant conditions if the intended claim extends beyond this incubation. The next experiment should test the uncertainty rather than merely repeat the most attractive treatment.
CHAPTER 11 OF 16 · Interpret abundance and change
11. A cell count is not a biomass measurement
Cells differ greatly in size and form. Counting one hundred small cells and one hundred large cells gives equal abundance under a cell-count convention but can correspond to very different total biovolumes.
In an invented spherical approximation, radius doubling multiplies cell volume by eight because volume depends on the cube of radius. Thus, 100 cells of radius 4 micrometres have eight times the total modelled volume of 100 cells of radius 2 micrometres.
Real cells need appropriate geometrical models, and biovolume is not identical to carbon biomass without further information. Colonies, chains and preservation add complications. Define the counted unit and the quantity inferred before comparing communities.
CHAPTER 12 OF 16 · Interpret abundance and change
12. Bloom abundance and harmfulness are separate questions
A bloom describes substantial accumulation or increase under a specified context. Some blooms cause harm through toxins, oxygen depletion or other effects. Others do not produce the same impacts. Colour and visible density do not uniquely identify toxicity.
NOAA distinguishes harmful bloom impacts and the need for organism and toxin information. A scientific interpretation should therefore separate what was seen, which organisms were identified, what was measured and which effect was demonstrated.
Algal science is broader than bloom response. Algae support food webs and contribute to biogeochemical processes, while some are used in food and other products. Understanding their benefits and impacts requires the same discipline of identifying the organism and process.
CHAPTER 13 OF 16 · Interpret abundance and change
13. Modern algae connect with fossil and symbiotic records
Diatom structures can persist in sediments and support palaeoecological investigation when identification, preservation and calibration are suitable. The living organism and the preserved valve are connected evidence stages, rather than identical observations.
Some algae also occur as photosynthetic partners within lichens. The interaction changes the biological context in which the alga functions. An isolated algal culture and a lichen association need not have the same environmental response.
These connections make phycology useful across ecology, palaeoecology and symbiosis. Follow the mechanism that links the settings, then identify which assumptions must be checked before transferring an interpretation.
CHAPTER 14 OF 16 · Study and continue
14. Design a comparison another learner can explain
Specify the organism or assemblage, the response variable, experimental duration, light, temperature, starting material and replication. Decide whether the question concerns growth, oxygen change, composition or biomass before selecting a measurement.
Use records and supplied datasets for classroom reasoning. Culturing unidentified environmental material or handling suspected harmful blooms requires appropriate facilities and expertise; neither is needed to understand the examples here.
An effective explanation identifies a changed condition, predicts the expected response and names a competing cause. If the result differs from the prediction, examine the assumptions rather than forcing the data into the original story.
CHAPTER 15 OF 16 · Study and continue
15. Practice oxygen rates and cell-size reasoning
Work from the new invented values, keeping oxygen concentration, time and inferred production separate. Then check whether the assumptions needed for the inference have actually been supplied.
Finish with one sentence explaining what the calculation measures and one sentence explaining what would be needed to apply it to a natural ecosystem.
Try it independently
A two-hour incubation starts at 7.5 mg O₂/L, ends at 8.1 in light and 7.1 in dark. Calculate net light change rate, dark consumption rate and estimated gross oxygen-production rate.
Under the same spherical approximation, how does the volume of a cell with radius 6 micrometres compare with one of radius 2 micrometres?
Does green water or a high cell count establish a toxic bloom?
Show answers and reasoning
Net rate = (8.1 − 7.5)/2 = 0.30; consumption rate = (7.5 − 7.1)/2 = 0.20; estimated gross rate = (8.1 − 7.1)/2 = 0.50 mg O₂/L/hour, conditional on the method’s assumptions.
The radius ratio is 3, so the modelled volume ratio is 3³ = 27. Equal cell counts need not mean equal biovolume.
No. Identification and appropriate impact or toxin evidence are needed for that specific claim.
CHAPTER 16 OF 16 · Study and continue
16. Continue through the algal learning directory
Begin the microscopic route with Diatom Analysis Vocabulary and Archaeological Diatom Analysis. Connect systems through Limnology and Marine Biology.
Follow Biogeochemistry for material cycles, Micropalaeontology for preserved remains and Lichenology for symbiotic associations.
Primary references include the Smithsonian algal overview, NHM AlgaeVision, NOAA phytoplankton guidance and the Finger Lakes Institute light-and-dark bottle lesson. NOAA’s harmful-bloom science factsheet supports the distinction between abundance and harm. The numerical examples above are original.
Contents · Previous chapter · The Gold Standard master hub · Continue with How X Works