
Archaeological faecal biomarker analysis examines chemical traces associated with faecal material in soils, sediments and preserved deposits. Stanols and bile acids can help investigate human and animal activity where obvious dung no longer survives. Detecting a compound, measuring its concentration and identifying its source are three different achievements. A strong lesson teaches each separately before combining them into a historical interpretation.
This guide explains how chemical evidence is identified, checked and interpreted. It includes an original worked example, Willow Yard, covering blank correction, dry-mass concentration and the danger of correcting recovery twice. It also explains why a chemical ratio is not a population count and why modern source comparisons must fit the region and archaeological context.
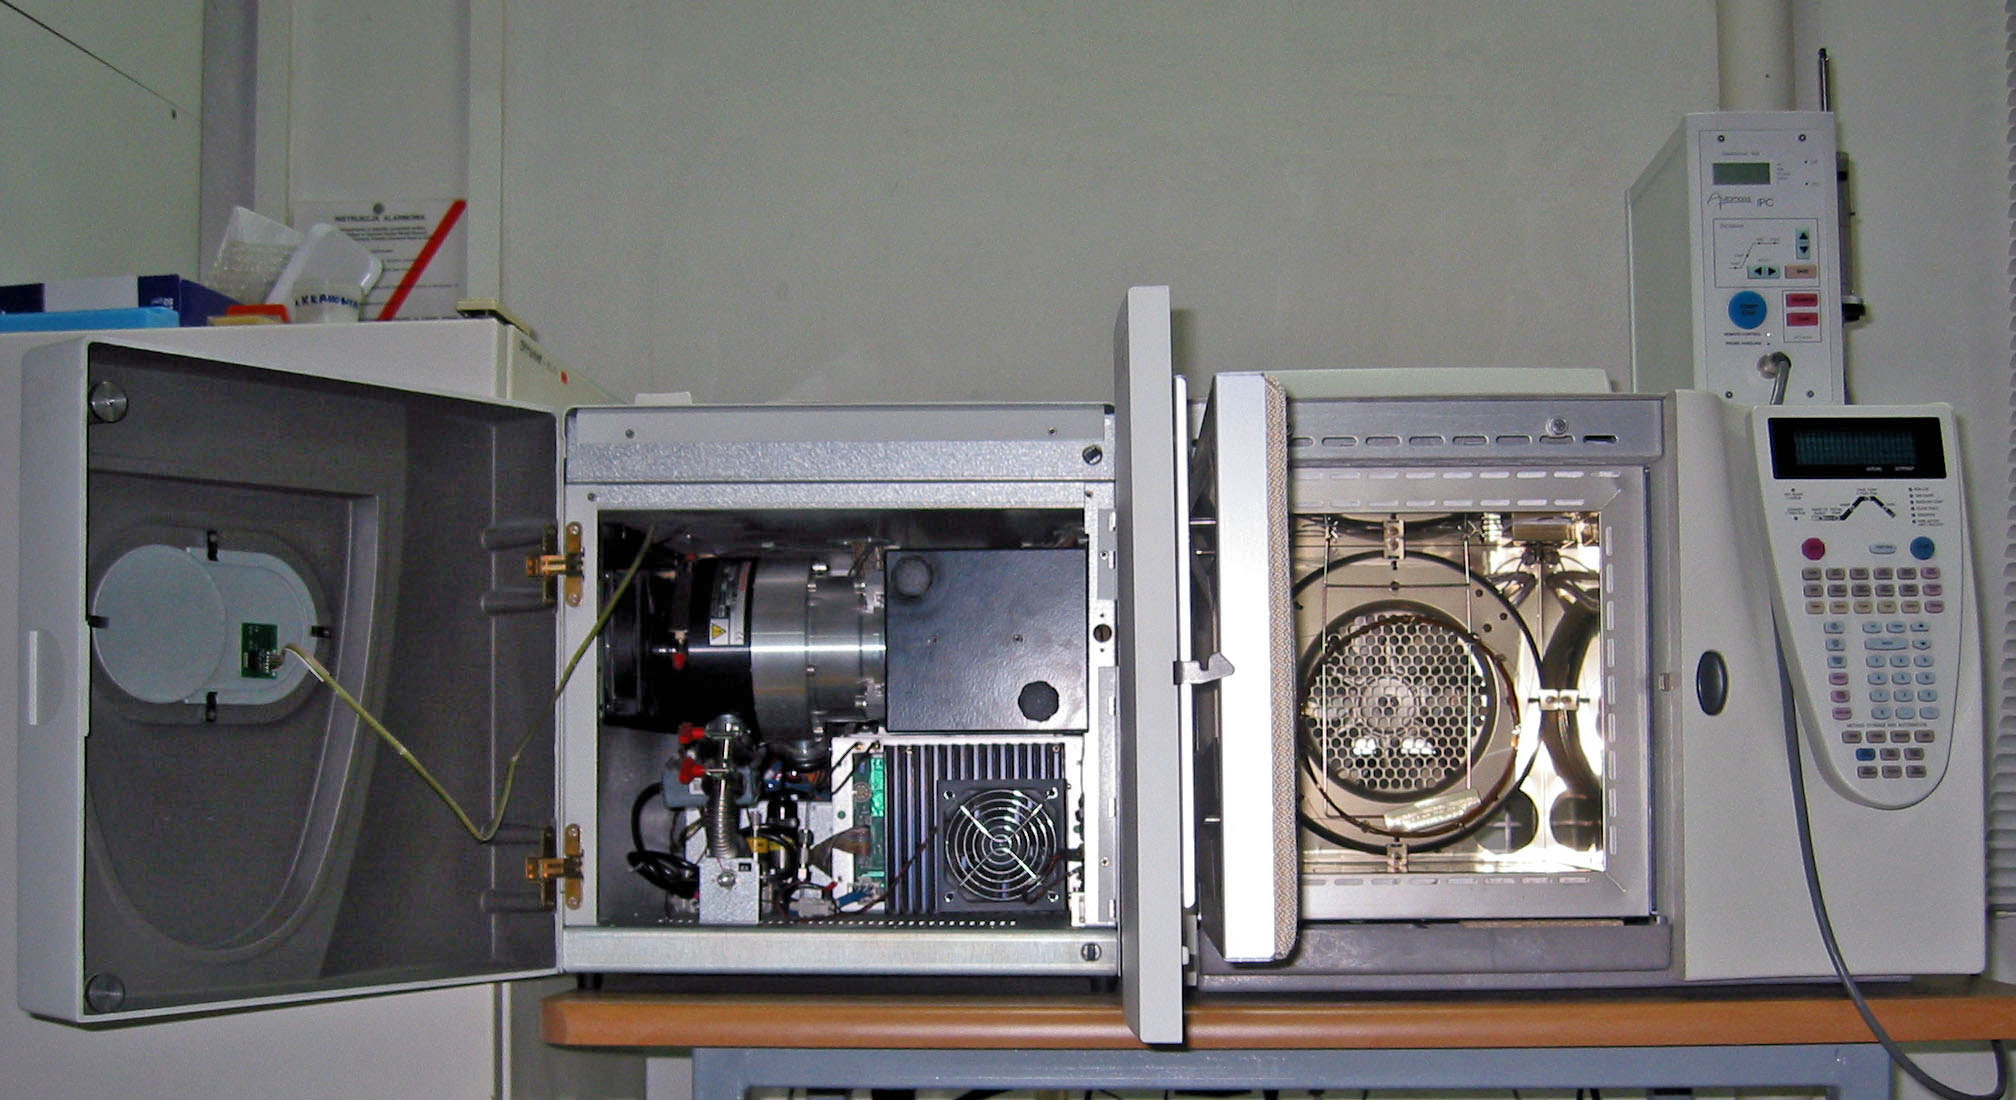
Willow Yard and every numerical result in its exercises are fictional. The featured photograph is a real analytical instrument, not evidence that the pictured laboratory tested these invented samples. Readers new to the wider method can begin with Teaching Organic Residue Analysis.


1. Separate chemical identity, quantity and historical meaning
Start with three questions. Which compound is present? How much was measured under a defined method? What source and depositional history could explain it? These questions require different evidence. A convincing molecular identification does not by itself demonstrate that the material came from one animal species or was deposited directly where it was excavated.
For the first classroom discussion, compare these statements: a sample contains a measured biomarker; the profile is consistent with a faecal contribution; the feature was a human latrine used by a fixed number of residents. Ask students what must be added between each statement. The last claim involves architecture, chronology, function and population assumptions not supplied by a chemical peak.
Make the distinction visible in every worksheet by using three separate columns: observation, analytical calculation and interpretation. A student can then improve a weak calculation without changing the original measurement, or revise an interpretation while preserving valid analytical results.
This is especially useful when a result is exciting. The discovery of a strong signal should trigger careful verification, not a shortcut past it. A reliable finding remains interesting after its uncertainty and alternatives have been made explicit.
2. Stanols and bile acids carry different biological information
Faecal steroid research examines several related chemical groups. Relevant 5β-stanols arise through biological transformations of sterols, while bile-acid profiles reflect compounds produced by vertebrates and modified through digestion and microbial activity. Their distributions can provide source information, but a profile is not a universal species label. The 2025 study by Gryczewska and colleagues explains the importance of comparing potential sources rather than assuming all archaeological faecal traces are human or domestic.
Students do not need to memorise a long compound list before understanding the method. Begin with the distinction between a molecule’s identity and the biological processes that can produce it. Then introduce named examples such as coprostanol or particular bile acids within a properly referenced source profile.
A good identification card states the chemical name, analytical evidence, relevant reference material and limits of source specificity. Avoid flashcards that say only “compound X equals humans” or “ratio Y equals sheep.” Those shortcuts remove the very conditions that make source interpretation defensible.
For an introductory comparison, use invented labels A and B rather than attaching an unverified diagnostic threshold to real compounds. Students can learn ratio arithmetic and mixture reasoning without accidentally learning a false archaeological rule.
3. A chromatographic peak needs an identification argument
Gas chromatography–mass spectrometry, or GC–MS, is used in faecal steroid analysis. Chromatographic separation and mass-spectral information help distinguish compounds; appropriate reference standards and calibration support identification and quantification. Harrault and colleagues describe these elements in their 2019 stanol investigation. Other studies use liquid-chromatography methods for suitable analytes, so the instrument should match the validated analytical approach.
Give students a simplified chromatogram containing two overlapping signals. Ask what would make one assignment convincing: consistent retention behaviour, diagnostic spectral evidence, comparison with an appropriate standard and an assessment of interfering material. A large peak is not automatically the intended molecule.
Keep peak area and chemical amount separate. An instrument response becomes an amount through a calibration and any necessary sample-volume accounting. A taller peak in one run cannot safely be interpreted as more material in the original sediment without considering those steps.
The class should learn to ask for the analytical record rather than an attractive screenshot alone. Preserve the original measurement, identification criteria, calibration, integration decisions and quality-control results. A later reviewer needs to know why a peak was included, excluded or re-integrated.
4. A reliable molecule in the wrong context answers the wrong question
Every specimen needs a unique identifier tied to its field location, stratigraphic unit, sampling date, storage and handling history. A chemical measurement can remain analytically valid even when its archaeological context is uncertain. What changes is the historical claim it can support.
Use a fictional example in which two sediment bags are swapped during cataloguing. The laboratory correctly identifies the compounds in each bag, but the resulting spatial map is wrong. No increase in instrumental precision repairs the missing chain of custody. The appropriate response is to investigate the records and restrict claims that depend on uncertain provenance.
Record the denominator used for concentrations. Wet sediment mass, dry sediment mass and organic-carbon-normalised quantities are different reference bases. Two reports with values expressed only as “concentration” may be describing non-comparable measurements.
Sampling should also preserve alternatives. A suspected activity area, neighbouring background sediment and relevant stratigraphic layers can answer different questions about distribution. Taking only the richest-looking deposit risks producing a persuasive result without a meaningful comparison.
For teaching, use approved datasets, safe reference demonstrations and published instrumental records. Handling faecal material or laboratory solvents belongs within authorised facilities and appropriate safety procedures, not an improvised classroom extraction.
5. Match the control to the uncertainty it can resolve
A procedural blank asks whether the analytical workflow introduced a signal. A recovery check examines how a defined addition behaves through specified stages. A local environmental comparison addresses background material and possible alternative sources. These are useful for different reasons; one cannot stand in for all the others.
Ask students to evaluate a claim that a clean laboratory blank proves every detected compound is ancient. The blank addresses contamination during the tested process, not the date of the molecule or its route into the sediment. Ancient context, modern intrusion and post-depositional movement remain archaeological questions.
Now give a second claim: a strong recovery result proves species identification. It does not. Recovering the target compounds efficiently strengthens a measurement, but source interpretation still depends on the reference profiles and competing explanations.
Published laboratory decisions are method-specific. In the 2025 cave-study workflow, the authors describe calibration, recovery checks, identification criteria and how weak or blank-related signals were handled. Its value for teaching is the explicit quality-control logic, not a licence to copy one threshold into every laboratory.
Before beginning calculations, have learners write what would make a result unusable, merely provisional or suitable for the stated comparison. Choosing those rules after seeing the preferred answer makes the analysis harder to trust.
6. Worked example: Willow Yard and the concentration denominator
Willow Yard and all measurements below are fictional. Assume a teaching protocol has already converted the instrument response to the equivalent amount in the complete extract, including any aliquot and dilution accounting. It reports 160 nanograms of compound A from 2.00 grams of dry sediment. A validated blank assessment authorises subtraction of a stable 20-nanogram procedural contribution on the same basis.
| Teaching input | Invented value | Meaning |
|---|---|---|
| Calibrated complete-extract amount | 160 ng | Before the stated blank correction |
| Comparable procedural contribution | 20 ng | Correction authorised by the toy protocol |
| Dry sediment processed | 2.00 g | Concentration denominator |
The blank-corrected amount is 160 − 20 = 140 ng. Dividing by dry mass gives 140 ÷ 2.00 = 70 ng/g. The result means seventy nanograms of the measured compound per gram of dry sediment under this defined calculation.
It does not mean seventy nanograms of original dung, seventy animals or seventy years of activity. Those are different quantities. The arithmetic provides a concentration of the analyte, not a conversion from chemistry to population or occupation duration.
Why specify complete-extract amount? Because an amount measured in one aliquot is not automatically the amount in the entire extract. If the laboratory has already accounted for aliquots and dilutions, repeating those multipliers would introduce another error. Students should trace the quantity at each stage rather than applying every familiar correction mechanically.
Why authorise blank subtraction explicitly? A real workflow must assess blank variability and decide how it affects reporting. This invented stable contribution is chosen to teach subtraction. It is not an instruction to subtract any single blank value from every real result regardless of uncertainty.
For a transfer question, change the reported extract amount to 24 ng while retaining the 20 ng contribution and 2 g sample. The arithmetic yields 2 ng/g. But arithmetic alone does not establish that the result exceeds the method’s reliable quantification limit. Ask for the validated reporting rule before publishing a precise concentration.
7. Correct recovery only when the method requires that correction
Continue with the fictional 70 ng/g result. Suppose the teaching protocol has separately demonstrated a relevant recovery of 70% and explicitly requires proportional correction because that loss has not already been accounted for. The illustrative corrected concentration is 70 ÷ 0.70 = 100 ng/g.
Now change the scenario. A laboratory reports 100 ng/g after a validated procedure that already corrects for the relevant recovery. Dividing that reported result by 0.70 again produces approximately 142.9 ng/g. That second division does not reveal extra archaeological material; it repeats a correction.
| Situation in the exercise | Appropriate calculation | Outcome |
|---|---|---|
| 70 ng/g is explicitly uncorrected for a validated 70% recovery | 70 ÷ 0.70 | 100 ng/g |
| 100 ng/g is already corrected for the relevant recovery | No second recovery division | 100 ng/g |
| Already-corrected result divided again | 100 ÷ 0.70 | 142.9 ng/g, an erroneous double correction |
The correct decision depends on the method, the standard used, when it was added and which stages it represents. A standard added late in a workflow cannot automatically describe material lost before it was added. Likewise, a useful recovery monitor is not necessarily a perfect substitute for every target compound.
Ask students to annotate the laboratory report with “already included,” “not included” or “unclear” beside each correction. Unclear documentation should prompt a question to the laboratory, not an invented adjustment. This exercise teaches a general scientific skill: determine what a reported number already means before transforming it.
A correction can change a central estimate without eliminating uncertainty. The reliability of the recovery measurement, blank assessment and calibration still matters. Reporting 100.000 ng/g would not make the underlying archaeological inference more exact.
8. A chemical ratio describes composition, not how many animals were present
Use two invented measured compounds, A and B, with no assigned species-specific meaning. Sample One contains 40 ng/g of A and 10 ng/g of B. Sample Two contains 4 ng/g of A and 1 ng/g of B. For both samples, A divided by A plus B equals 0.8.
The ratio is identical even though the total measured concentration differs tenfold. This follows directly from its definition: multiplying both components by the same factor leaves the ratio unchanged. A source-sensitive composition measure can therefore answer a different question from a concentration measure.
Nor does the higher total establish ten times as much original faecal deposition. Sediment dilution, preservation, transport and analytical comparability would need examination. Students should state the observation first: one sample has ten times the summed measured concentration of these two compounds under the stated method.
Ratios also become difficult to interpret when a denominator includes poorly quantified values. A spreadsheet will still divide very small numbers, but the resulting decimal may be unstable. Do not replace a non-detected compound with an arbitrary zero without documenting the consequences.
For a short assessment, ask learners to write one question answered by the ratio and one it cannot answer. The aim is to build comfort with useful limits rather than discourage quantitative work.
9. Test mixtures before assigning a single source
An archaeological deposit can receive material from more than one source. A chemical profile lying between reference profiles may reflect mixing, an unrepresented source, alteration or measurement uncertainty. It should not automatically receive the name of whichever reference average happens to be closest.
Harrault and colleagues examined eleven 5β-stanols across ten modern mammalian source categories and tested their approach using samples with known inputs. The study demonstrates the information available from richer profiles rather than relying on only a few compounds. Its results remain evidence about the investigated reference and test materials, not proof that every unknown mixture has a unique solution. Read the original research.
In a fictional mixing exercise, Source X supplies A = 8 and B = 2 arbitrary units, while Source Y supplies A = 2 and B = 8. Combining those measured contributions gives A = 10 and B = 10, so the ratio becomes 0.5. This is a third profile produced without introducing a third animal species.
Even this simple calculation assumes that contributions can be combined on a common analytical basis. Equal masses of two original source materials need not contribute equal total biomarker amounts. A 50:50 chemical contribution is not automatically a 50:50 mixture by original dung mass.
Ask students which additional compounds or independent evidence would distinguish the plausible histories. The task is to reduce ambiguity with new information, not to hide ambiguity inside a confident classification label.
10. Modern reference profiles need geographical context
A study published on 12 May 2026 by Mir-Makhamad and colleagues compared sheep bile-acid profiles across several regions and included related animal comparisons. It found substantial regional variation and no single bile acid or ratio that worked as a universal sheep marker. The authors recommend regionally grounded interpretation and multiple lines of evidence. Read the 2026 study.
This does not make species identification impossible. It changes the questions a responsible analyst must ask about the reference. Which animals were sampled? In which environment? How representative are their diets and conditions? Does the archaeological question involve sources that the comparison never included?
Give students two hypothetical reference libraries, one geographically convenient but ecologically unlike the study area, the other smaller but locally relevant. They should compare coverage and limitations rather than automatically choosing the library with more rows. A larger dataset can still be poorly matched to the intended prediction.
Reference scope also matters in caves. Gryczewska and colleagues developed profiles for fourteen modern wildlife species and tested a framework on cave samples, expanding the alternatives beyond humans and domestic livestock. Read the cave investigation. The classroom lesson is to include plausible sources before claiming that a method has excluded them.
11. Burning and preservation can change the profile
In controlled cattle-dung burning experiments published in 2025, Mir-Makhamad and colleagues found that heat affected bile-acid groups differently. Some compounds persisted at reduced concentrations while others were less stable, and conditions within a fire mattered. The study shows why a burnt archaeological profile should not be treated as an unchanged copy of a fresh reference. Read the experimental paper.
For a classroom interpretation task, provide a fictional fresh reference with three compounds and a heated sample missing one of them. Ask whether the missing compound proves a different source. It may, but differential preservation is another hypothesis requiring evaluation.
Do not turn the experiment into an unsupported universal temperature rule. A controlled heating study defines its material and conditions; an archaeological deposit may have a different duration, oxygen exposure, matrix and later burial history. Students should learn how experimental evidence constrains interpretation without pretending to recreate every past fire.
A negative result needs similar care. Failure to detect a target compound may reflect absence, poor preservation, inadequate recovery or an analytical limit. The report should distinguish these possibilities and explain what the available controls resolve.
12. Source identity does not establish the route or date of deposition
Even a well-supported faecal contribution can reach a deposit through different activities: direct deposition, transported waste, manuring, cleaning, redeposition or another site-specific pathway. Determining which occurred requires the spatial and stratigraphic evidence developed in Teaching Geoarchaeology.
Compare two fictional discoveries. One is a strong signal in a constructed pit with a coherent use history; the other is a similar signal in a field soil repeatedly disturbed over time. The chemical resemblance does not require identical functions. Ask students which additional observations would support a latrine interpretation, an agricultural interpretation or an unresolved mixed history.
Keep the date of the archaeological context separate from assumptions about every molecule it contains. Later material can enter older sediment, and old material can be redeposited into a newer feature. A precise compound identification is not a direct date.
The same restraint applies to population claims. A concentration map cannot become a census without a defensible relationship connecting people or animals, input rates, duration, movement, sedimentation and preservation. An impressive map may demonstrate patterned chemical evidence while leaving the number of contributors unknown.
Ask students to write a timeline with separate entries for source production, movement, deposition, later disturbance and modern sampling. The exercise often reveals that a historical conclusion depends on several untested links rather than one missing laboratory measurement.
13. Combine indicators that answer different questions
Chemical profiles can be compared with microscopic remains, sediment features, animal bones and spatial evidence. The purpose is not to assemble the longest possible list of proxies. It is to choose observations that test alternatives left unresolved by the chemical result.
For example, the reasoning in Teaching Faecal Spherulite Analysis helps separate a possible dung component from claims about livestock species or herd size. Teaching Soil Phosphate Mapping examines spatial chemistry and its alternative causes.
The related Coprophilous Fungal Spore guide provides another opportunity to ask whether the ecological and preservation assumptions are appropriate. Different methods can agree because they reflect the same process, but apparent agreement is weaker when they share an untested chronological or source assumption.
Build a comparison table with columns for direct observation, possible sources, preservation concerns and the specific alternative being tested. A study gains strength when new evidence reduces uncertainty about a real question, not when several techniques repeat the same unsupported story in different vocabularies.
14. Give each learner the next task they actually need
Repair the measurement foundations. A beginner should distinguish an instrument response, an extract amount and a dry-mass concentration. Use the first Willow Yard calculation and ask for the meaning of each unit. Introduce recovery only when the learner can explain what has already been calculated.
Stabilise the method. An intermediate learner may calculate well but apply corrections mechanically. Give reports with different combinations of included and excluded corrections. The learner must identify which transformations are still required and which would count the same adjustment twice.
Extend the interpretation. An advanced learner should assess mixtures, regional references and preservation. Provide two plausible source histories and a limited budget for follow-up. Ask which observation would best discriminate them, rather than allowing a general request for more analysis.
Progress should be visible in explanations. A student who can say “this number is already corrected, so I will not divide again” has gained more than arithmetic fluency. A student who can explain why a strong concentration does not identify a latrine has learned to connect laboratory evidence with archaeology.
15. A practical lesson from signal to defensible claim
Begin with a short retrieval exercise: label a compound identity, an analytical amount, a concentration and a source hypothesis. Ask students to explain why each belongs in a different part of the report. This exposes conceptual confusion before calculations begin.
Model one analytical decision aloud using a simplified chromatogram and its reference evidence. Then let students review an ambiguous example. The task is to decide what additional information would support identification, not merely to choose the tallest peak.
Next work through Willow Yard. Guide the blank-corrected amount, let students calculate concentration independently, and only then introduce the recovery decision. Change one assumption at a time so the teacher can identify exactly where reasoning becomes unstable.
For the source stage, use the invented A and B ratios and mixture. Students calculate correctly, then write what the ratios cannot establish. Introduce the regional-reference and burning studies as reasons to test transfer, not as reasons to abandon biomarker analysis.
Finish with an individual paragraph containing the measured evidence, the stated calculation, a qualified source interpretation and one targeted next test. In a later lesson, give the same profile in a different archaeological context. Students should discover that valid chemistry can support different historical questions without the laboratory result itself changing.
16. Assess the evidence trail, not the confidence of the headline
| Assessment area | A defensible result | A shortcut to correct |
|---|---|---|
| Compound identification | Appropriate reference and analytical criteria | The largest peak receives the desired name |
| Quantification | Units, calibration basis and corrections are explicit | Recovery or dilution is corrected twice |
| Quality control | Blanks, recovery and reporting limits have defined roles | A clean blank is treated as proof of ancient origin |
| Source comparison | Relevant references, mixtures and preservation evaluated | One ratio becomes a universal species label |
| Archaeological interpretation | Context, transport and chronology tested | Concentration becomes a population count |
| Reproducibility | Raw records, transformations and decisions archived | Only a final classification is retained |
For a final transfer task, present an already-corrected report with an excellent source match but uncertain field provenance. Ask which claim is still defensible. Students should retain the analytical finding while restricting spatial and chronological interpretation. The answer should not pretend that a strong match repairs missing excavation records.
A second task presents secure context but a profile close to two candidate sources. Ask whether averaging their names or selecting the nearest mean resolves the ambiguity. It does not. Learners should state the alternatives and identify evidence that would distinguish them.
Archive sample identifiers, dry masses, extraction and analytical records, standards, calibration, blanks, recovery decisions, reporting limits, raw chromatograms and interpreted profiles. Preserve any corrected integrations or revised source assignments with reasons. Another researcher should be able to see how the result was produced, not merely repeat its conclusion.
Frequently asked questions
Does finding coprostanol prove the deposit is a human latrine?
No. Compound identity, source attribution and feature function require different evidence. A robust interpretation considers the wider chemical profile, reference sources, preservation and archaeological context.
Should every concentration be divided by recovery?
No. First establish what the validated method and reported result already include. A second correction can inflate a result that has already been adjusted.
Can one bile-acid ratio identify sheep everywhere?
The 2026 regional comparison does not support a universal sheep marker based on one bile acid or ratio. Source interpretation should use appropriate regional references and corroborating evidence.
Does a negative result prove there was no dung?
No. Preservation, recovery and analytical sensitivity must be considered. Report what was not detected under the stated method before inferring why.
Are the Willow Yard values actual laboratory findings?
No. They are invented teaching values. Their purpose is to demonstrate units, correction logic and inference limits without attributing fabricated evidence to a real excavation.
Research and connected reading
Harrault and colleagues, 2019 examine multi-compound stanol source profiles. Gryczewska and colleagues, 2025 extend modern comparisons to wildlife and cave samples; consult the corrected supporting-information arrangement noted on the article page. Mir-Makhamad and colleagues, 2025 investigate burning effects, and their 2026 regional study tests the geographical limits of bile-acid source identification.
Continue with Teaching Organic Residue Analysis, Teaching Faecal Spherulite Analysis and Teaching Coprophilous Fungal Spore Analysis. The Archaeology root guide and Gold Standard master guide connect these methods to the wider series.
The gold standard is a learner who can identify a chemical signal, calculate what it represents, inspect the controls and explain exactly how far it supports a story about past people or animals. Good analysis produces a useful answer and makes the remaining question easier to investigate.