
Faecal spherulites offer a fascinating way to teach archaeological reasoning: an almost invisible mineral body can contribute to a story about animals, fuel and everyday living spaces. Yet a microscopic count is not a headcount of livestock. Good teaching combines identification, deposition history, laboratory controls and honest uncertainty.
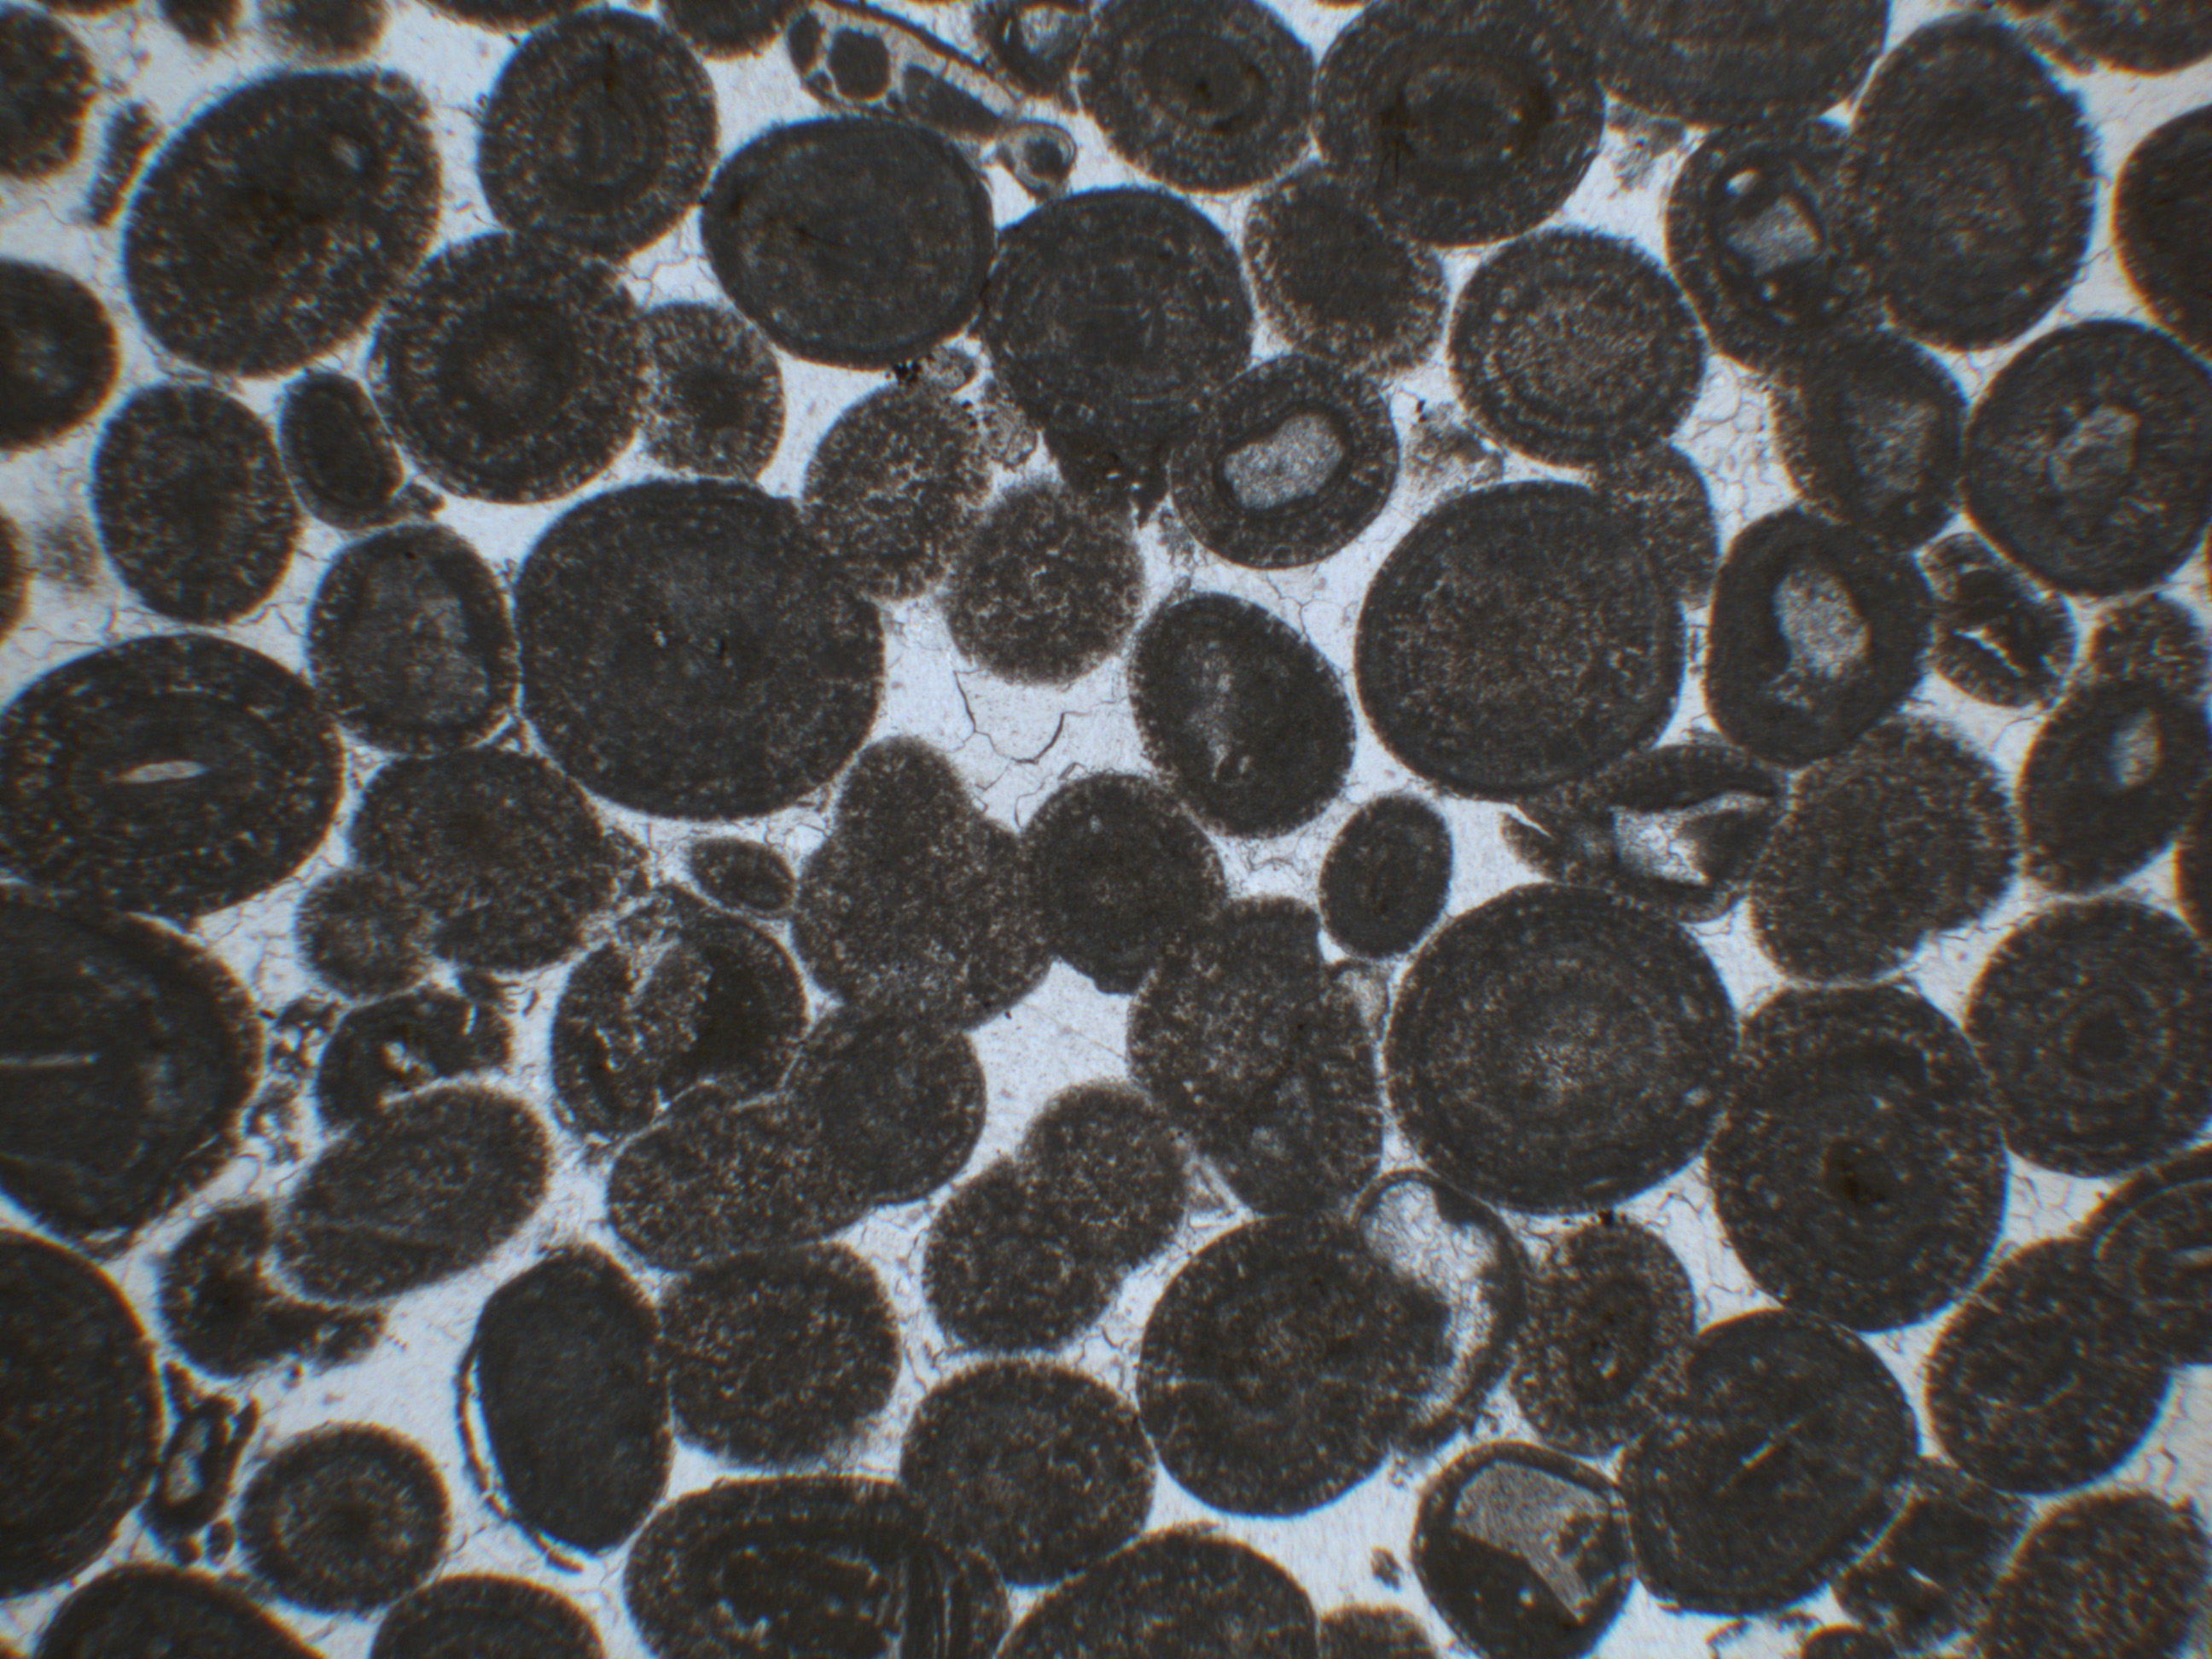
This guide uses an explicitly fictional Hearth Lane excavation for worked calculations. Its featured image is a genuine soil thin section, not the fictional sample. Begin with the method, follow each step, and let students discover why a modest, defensible finding is more valuable than a dramatic unsupported claim.
For the underlying method, read Canti and Brochier’s review and the connected Soil Micromorphology teaching guide.


1. Begin with a modest claim, not a reconstructed herd
Faecal spherulites are minute calcium-carbonate bodies formed in the digestive systems of many animals. In archaeological sediment they can contribute evidence for dung, penning, bedding, fuel and the processes that built a deposit. They are not tiny photographs of sheep. They do not directly reveal one animal species, how many animals lived nearby or whether people owned them. The practical teaching question is: how far can we move from a recognisable particle to a defensible account of activity?
Start a lesson with two transparent claims. Claim A: a sediment sample contains particles with diagnostic spherulite morphology. Claim B: a particular household kept thirty goats inside a room. The first might be tested with microscopy, controls and laboratory records. The second would need substantially more evidence. Students should learn why adding a persuasive story does not make a microscope more powerful.
2. Understand the biology before counting particles
Archaeological faecal spherulites commonly measure only a few micrometres across and consist largely of radially crystallised calcium carbonate. Formation varies between animals and environmental conditions; many ruminant herbivores can produce abundant spherulites, but production is not constant. A classroom diagram should connect digestive mineral conditions to dung deposition, burial, chemical alteration and eventual laboratory observation.
The same archaeological layer may have received animal dung, plant ash, sediment wash, trampling debris and later infiltrated particles. Its apparent concentration is a product of source, transport, preservation and sample preparation, not simply the original quantity of dung. Once students can draw that chain, interpreting a count becomes much safer.
3. Recognise the optical signature and its impostors
Viewed under cross-polarised light, typical faecal spherulites can show a characteristic extinction cross associated with their radial microcrystalline arrangement. Recognition requires the right magnification, focus, calibrated scale and familiarity with appropriate reference images. A bright cross on its own is not a species identification, and round mineral grains must not be labelled by resemblance alone.
Challenge learners with reference materials that may resemble spherulites, including plant-derived calcium oxalate bodies and other carbonate microstructures. Ask for the diagnostic features that support the identification, the features that are missing, and the follow-up test. A careful result can be ‘spherulite-like, identification unresolved’ when the optical evidence is not adequate.
4. Prepare thin sections without erasing their setting
Soil micromorphology preserves a small block of archaeological sediment and its internal arrangement. Properly documented orientation and stratigraphic position allow students to examine microfeatures alongside ash, plant tissue, pore structure and sediment fabrics. Removing loose particles for a slide may assist recognition, but it loses some relationships that an intact thin section can preserve.
Teach learners to record sample code, archaeological unit, sampling orientation, field notes, resin treatment, polished-section details and the microscope settings. They should distinguish particles concentrated in a compacted lens from similar particles washed into an open pore. A particle without context can be chemically impressive and archaeologically vague.
5. Design controls for actual contamination routes
Controls are not ceremonial blanks added at the end of a practical. Sediment from outside the suspected activity area gives one comparison; modern reference dung, equipment blanks and appropriate laboratory controls give others. Their roles differ. A blank addresses contamination introduced during preparation, while a nearby background sample addresses the pre-existing natural sediment signal.
If a brush has previously handled dung-rich sediment, a clean-looking workstation cannot make that brush a reliable control. Students should list every point at which particles could arrive: excavation, packing, storage, sectioning, sieving, mounting and microscopy. Contamination logs allow a conclusion to be revised rather than defended out of habit.
6. Understand why alkaline preservation changes the evidence
Calcium-carbonate spherulites can dissolve where the surrounding environment is chemically unfavourable, particularly under acidic conditions and substantial water movement. Consequently, two equal deposits of dung can yield unequal modern counts. No visible spherulites is not proof that no animals were present, and large numbers do not guarantee that more dung was originally deposited.
Students can compare a well-preserved dry or alkaline floor with a repeatedly waterlogged or chemically aggressive deposit. The exercise is not to guess a universal survival percentage; it is to identify which independent measurements of pH, sediment condition, mineral alteration and microstratigraphy would help evaluate the contrast.
7. Separate what dung means from how it arrived
Animal dung might accumulate through habitation, stalls, animal passage, bedding, fuel, manuring or redeposition of older deposits. Rain, trampling and cleaning can distribute it well beyond its original place. A high concentration near a hearth could reflect burning dung fuel, but could also be redeposited material unless heat effects, ash relationships and other traces agree.
Ask students to draw at least three plausible formation histories for one findspot. One includes animals living there; another includes dried dung brought in as fuel; a third uses sediment carried from an external pen. The correct teaching objective is to design observations capable of discriminating between these histories.
8. Count with honest denominators
A raw particle total is not a comparable measurement if different amounts of sediment or different microscopic areas were examined. Report the number observed, mass or volume processed, microscopy method, replicate count, recovery assumptions and detection threshold. A count per gram of processed sediment is more interpretable than ‘many’ in one slide and ‘few’ in another.
Counts can still be affected by extraction recovery, aggregates, uneven distribution and the decision to classify ambiguous particles. Students should calculate a rate, then explain why rates from different preparation protocols might remain incomparable. A strong report gives the raw numbers alongside the normalised figures.
9. Work the fictional Hearth Lane sample step by step
Consider three fictional laboratory samples from a courtyard floor. Lens A yields 240 confidently identified spherulites from 0.30 g of processed sediment; Lens B gives 45 from 0.15 g; a background control gives 12 from 0.30 g. The corresponding simple observed rates are 800, 300 and 40 identified particles per gram. These values are invented for teaching, not measurements from an excavation.
Lens A has a twentyfold observed rate relative to this particular background sample, and B has a 7.5-fold rate. That is a transparent descriptive comparison, not a twentyfold difference in animal numbers. Compare extraction recovery, sampling depth, replicate variation, mineral dissolution and sediment mixing before claiming enrichment. Ask whether the counts come from multiple slides or one accidentally rich field of view.
Worked calculation: raw count versus rate
| Specimen (fictional) | Identified particles | Processed mass | Simple observed rate |
|---|---|---|---|
| Lens A | 240 | 0.30 g | 800/g |
| Lens B | 45 | 0.15 g | 300/g |
| Background | 12 | 0.30 g | 40/g |
The denominators make the three samples comparable only at a basic descriptive level; actual analytical comparability still depends on sampling, recovery and preservation.
10. Give students an uncertainty audit
The arithmetic above seems tidy, but the uncertainty is not. There are only three samples, no independent replicate preparation, no precision estimate and no documented spatial coverage. The material may be heterogeneous; a single concentrated clump may dominate a slide. The minimum next step is a replicated, blind recount with recorded field areas and a broader background sample set.
Have each learner write two conclusions: one justified by the current evidence and one overclaim to remove. A defensible version is that confidently identified particles were more frequent in Lens A than in one stated control under the stated processing method. An overclaim would declare Lens A a sheep pen with a fixed stock size.
11. Link spherulites to plants, ash and microstratigraphy
Phytoliths may occur with dung because animals eat plants, but phytoliths can also arrive through vegetation, fuel, threshing or wind. Charcoal and ash indicate burning only when their microcontext and alteration support that interpretation. Pairing methods is useful because each has different routes to the archaeological deposit and different vulnerabilities.
Teach a matrix: spherulites suggest a possible dung component; grass phytoliths support plant tissue presence; burnt microstructures suggest heating; compacted floor fabrics may indicate trampling. None independently supplies ownership, precise herd size or a direct calendar date. When several independent indicators point in the same direction, a more specific working explanation becomes reasonable.
12. Distinguish laboratory evidence from chronology
The date of a wall, hearth or occupation layer is not automatically the date of each microscopic grain within it. Later animal activity, building repair, rooting and sediment movement can relocate material. Carbonate minerals can also pose specialist issues if someone proposes dating them without a validated method and clear sample history.
A lesson should make learners trace each element of the chronological argument: what was sampled, how it was associated with a securely dated feature and which disturbances might break that association. A clean stratigraphic section and a clear microscope image answer different questions; both are needed for credible interpretation.
13. Know when chemical or spatial follow-up matters
Where the stakes justify further work, test targeted chemical properties, micromorphological fabrics, mineral identifications and spatial distributions. Carefully paired control samples help separate mineral background from human or animal activity. A site-wide map can reveal structure, but interpolation across unsampled rooms can turn a few measured points into falsely smooth evidence.
Students should be able to specify the next measurement rather than simply ask for ‘more data’. For the Hearth Lane case, useful requests include replicated particle counts by mass, sediment pH, comparable depths in adjacent rooms, independently logged ash and plant microremains, and records of preparation blanks.
14. Teach recovery without sacrificing the archaeological archive
Sampling may consume irreplaceable sediment from a protected feature. The responsible approach starts with a research question, minimal necessary sampling, authorised access and retained documentation. A professional record includes the sample location, dimensions, sediment condition, processing history, microscopy images and observations about classification uncertainty.
Photomicrographs should show a scale and explain the illumination used. A figure caption must not turn a modern reference photograph into a photograph of ancient material. The featured image on this page is genuinely an archaeological soil thin section, but it illustrates microstratigraphic observation, not identified dung spherulites from the fictional worked case.
15. Transfer exercise: the same signal, three very different stories
Present a hypothetical cave entrance, a household floor and a field-edge scatter. All have similar observed spherulite counts. Ask learners to propose alternative routes: wild herbivores using a shelter, dung fuel or a cleaned-out enclosure, and deliberate manuring respectively. Have them design one field observation and one laboratory comparison for each context.
The lesson should end with three conditional statements, not three triumphant labels. The goal is to make evidence transferable: a learner who can reason about dung microremains should also be better equipped to reason about pollen, bone fragments, soils and other indirect traces of past behaviour.
16. Assessment rubric: reward restraint and reproducibility
Use four criteria: observation quality, source and preservation control, comparative reasoning, and calibrated conclusion. The highest-quality work identifies diagnostic microfeatures, specifies denominators, reports controls and replicates, considers plausible alternative origins, and names the next needed evidence. Elaborate historical storytelling earns no extra credit unless observations support it.
This approach changes how students view uncertainty. ‘Cannot yet distinguish penning from dung fuel’ can be an excellent scientific conclusion when the evidence really does not discriminate. Teaching succeeds when learners know what the microscope reveals, what the deposit may have endured and what a responsible claim must leave open.
Lesson sequence for a 75-minute university seminar
- 0–10 minutes: distinguish the presence of microremains from a livestock-management claim.
- 10–25 minutes: examine diagnostic and look-alike micrographs with scale and optical notes.
- 25–40 minutes: compare sampling and contamination-control pathways.
- 40–55 minutes: calculate rates from the three fictional samples and audit denominators.
- 55–65 minutes: design alternative formation histories for one rich sample.
- 65–75 minutes: write an evidence-limited conclusion and a follow-up sampling plan.
Field-to-lab evidence checklist
- Describe and photograph diagnostic particles with scale and illumination mode.
- Trace each specimen to its excavated unit and preparation record.
- Compare appropriate environmental and preparation controls.
- Report raw counts, normalised rates, replicates and uncertainty.
- Distinguish possible dung presence from species, husbandry or herd-size claims.
- State one alternative formation pathway and the evidence needed to test it.
Frequently asked questions
Are faecal spherulites always evidence of domesticated animals?
No. Various animals can produce them. Domestication, enclosure and herd management require contextual and often independent archaeological evidence.
Does a missing spherulite signal exclude ancient dung?
No. Production differs among animals and environments, and carbonate dissolution or incomplete recovery can erase an originally present signal.
Can a thin section identify sheep rather than goats?
Not reliably from spherulites alone. Specific species claims require different diagnostic evidence.
Why report particles per gram?
Because equal raw counts can come from unequal sample masses. Even normalised rates require comparable extraction, visibility and preservation.
Would an ash-rich sample prove dung fuel?
Not automatically. Heating, plant ash and dung can combine in multiple ways; spatial context and microstructure remain important.
Are the worked numbers real archaeological findings?
No. Hearth Lane is a fictional arithmetic and reasoning exercise, clearly separated from published research.
Research sources and connected disciplines
- Canti and Brochier, Faecal Spherulites (2017), archaeological micromorphology
- Canti, identification of faecal spherulites (1998)
- Canti, production and preservation of faecal spherulites (1999)
- Teaching Soil Micromorphology
- Teaching Archaeoparasitology
- Teaching Phytolith Analysis
- Teaching Anthracology
- The Gold Standard of Archaeology
- Gold Standard master hub
The gold standard of teaching faecal spherulite analysis is a learner who can identify a plausible mineral signal, explain its survival and alternative origins, reproduce the comparison, and decline to claim more than the sediment can support.