
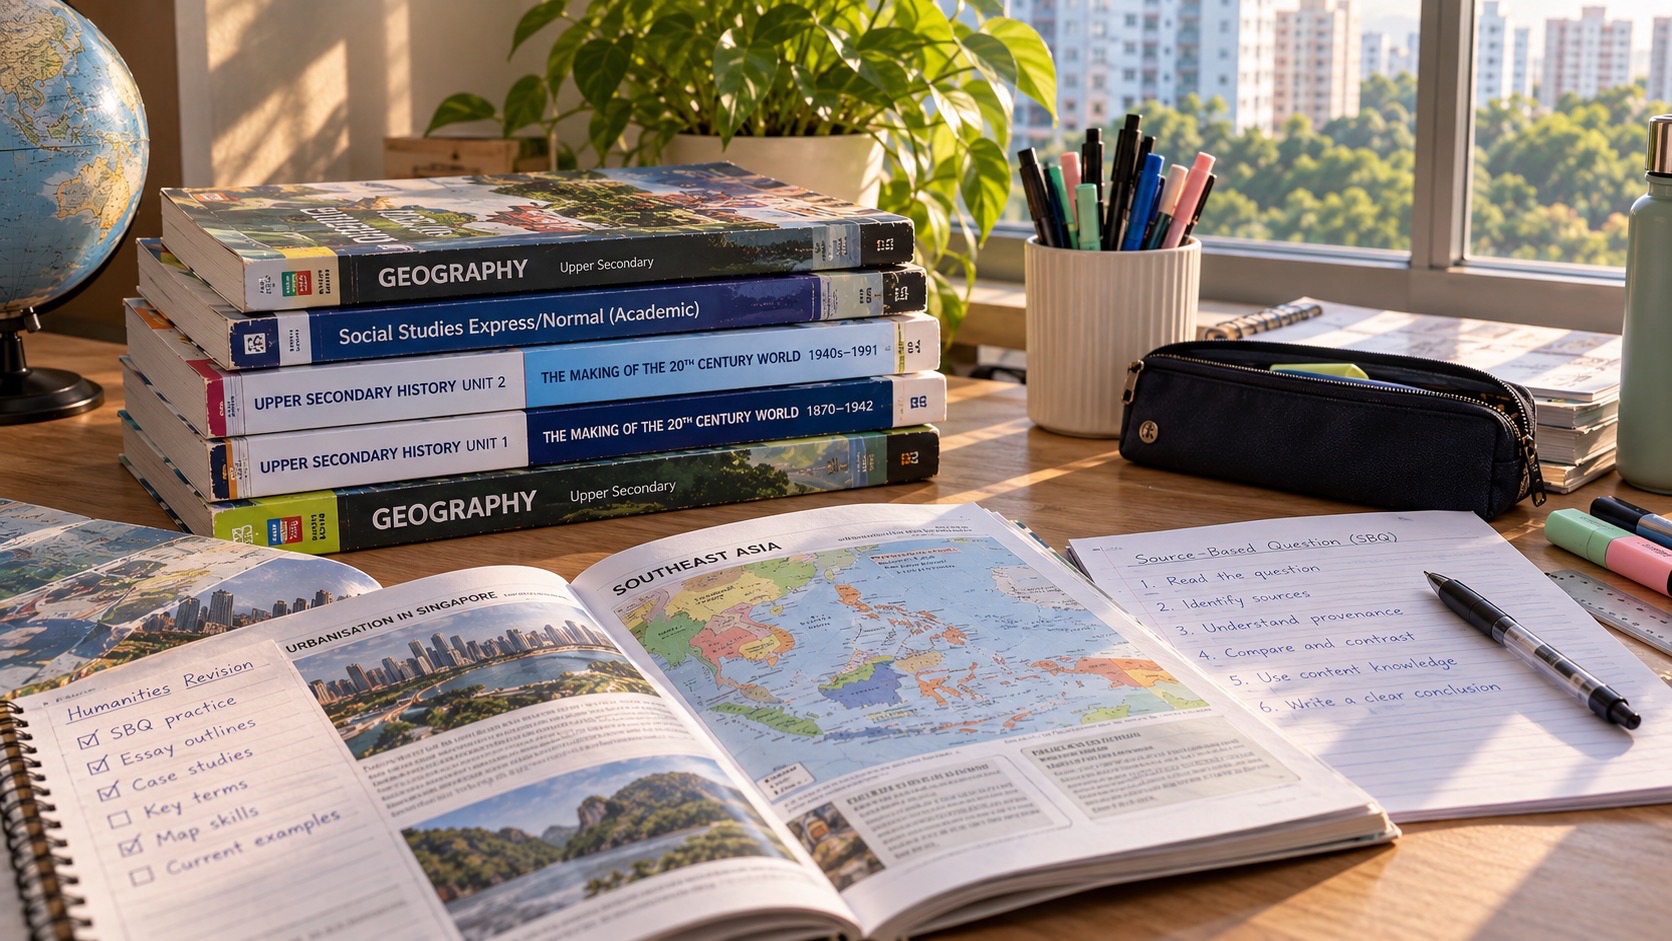
G2 Geography Question 1 is the compulsory 25-mark Everyday Geography question in the 2027 SEC K229 Humanities (Social Studies, Geography) paper. Candidates answer it in Section A, then choose either Question 2 on Climate or Question 3 on Tectonics for the remaining twenty-five Geography marks. An understanding of familiar places, maps, sustainable development and geographical methods therefore matters, even if the pupil strongly prefers the Climate or Tectonics topic.
A useful way to prepare is to start with a neighbourhood observation and ask how its location, time and evidence affect the conclusion. When a student loses marks on a map or graph, identify the first error: misread axis, wrong scale, unsupported cause or a fieldwork method that does not answer the research question. Do not assume that more memorised descriptions are the solution.
The official 2027 G2 K229 syllabus and SEAB subject register are the authority for the paper arrangement. All hypothetical places, visitor numbers and fieldwork activities in this article are teaching examples, not official specimen questions or actual surveys.
2027 K229 Geography: paper structure at a glance
| Part | Content | Marks |
|---|---|---|
| Paper 2 Geography | 1h 45m, 50% of K229 | 50 |
| Section A Question 1 | Compulsory Geography in Everyday Life | 25 |
| Section B | Either Question 2 Climate or Question 3 Tectonics | 25 |
| AO3 question | One level-marked judgement item in chosen Section B question | 6 within its 25 marks |
1. The compulsory 25 marks and where they sit
The G2 SEC 2027 Humanities (Social Studies, Geography) syllabus is K229. Social Studies is Paper 1 and Geography is Paper 2, each worth fifty per cent of the combined subject. The Geography paper lasts one hour forty-five minutes and carries fifty raw marks. Section A is compulsory Question 1 on Geography in Everyday Life, worth twenty-five marks. In Section B students answer either Question 2 on Climate or Question 3 on Tectonics, also worth twenty-five marks. Attempting both Section B questions is not the intended examination route.
This is why Question 1 should not be neglected by a learner who prefers volcanoes or climate change. It is half the Geography paper regardless of the student’s elective topic preference. The K229 syllabus also says each structured question has no more than twelve subparts, and the six-mark judgement item testing AO3 appears in the Section B option. Students should confirm their school-taught route and the current examination-year syllabus before practising a timed paper.
Make a paper map with Question 1 on the left and the Climate-or-Tectonics choice on the right. Ask the student to explain which part is compulsory, what is optional and what concept skills belong in each. Then examine a marked school answer from the Everyday Life cluster. If the pupil knows climate concepts but misses maps or data in Question 1, the intervention should target that skill directly.
2. Everyday Geography begins by asking a geographical question
The Everyday Life cluster is organised around thinking geographically, sustainable development and geographical methods. Its purpose is to investigate familiar places using concepts about people, nature, services and spatial relationships. Geography is more than remembering names of places. Students should be able to notice a pattern, ask why it might exist, select an appropriate scale and decide what evidence could test an explanation.
Imagine observing many people waiting beside a bus stop on one afternoon. An observation is that a crowd was present at a given location and time. It is not yet established that the entire neighbourhood suffers from inadequate bus service. The crowd might reflect a service disruption, a school dismissal period or an unusual local event. A geographical question could be ‘How does pedestrian use of this stop vary across time?’ rather than ‘Why is the town badly planned?’
Practise converting a complaint into a testable question. State place, time and the phenomenon to be investigated. Then identify what quantitative or qualitative information would help. In class, compare a carefully focused question with an ambitious assertion that has no clear measurement. The first is much more useful for fieldwork and data interpretation.
3. Thinking across spatial scales
The size of the area being considered shapes what can be concluded. A single corridor, a neighbourhood park, a town centre and the whole island of Singapore are different spatial scales. Evidence collected at one point cannot automatically represent the wider area. Students should pay attention to map extent, units, boundaries and whether a source shows a site, route, district or national pattern.
Suppose a fictional observation finds that a sheltered walkway near one school is busy at 7:30 in the morning. That does not establish the busiest route in all of Singapore, nor does it prove the entire town is crowded throughout the day. The same place might have very different use at noon. The observed pattern is tied to its scale and timing.
Take an approved map from a Geography textbook. Ask what area it covers, how the legend classifies features and whether the main claim concerns a location or a broader region. Give the learner two possible conclusions and ask which is supported at the displayed scale. This can prevent overgeneralisation before calculations begin.
4. Sense of place and why people experience one place differently
The syllabus considers how people attach meaning, memories and identity to familiar locations. A plaza may feel like a meeting place to one family, a stressful interchange to a commuter and a workplace to a shop employee. These experiences may be genuine without being identical. Students should distinguish physical features from personal associations and think about how age, routine and experience can affect perceptions.
Imagine an invented park beside an apartment block. One interviewee recalls childhood games; another values the shade after lunch; a third avoids it when it feels crowded. A survey of ten people might reveal these different meanings, but ten responses cannot prove what every resident thinks. A geographical answer should identify whose sense of place is being described and how evidence was obtained.
Use an ordinary familiar place and ask the student for two factual features and two meanings people may attach to it. Then discuss what kind of evidence would verify those claimed experiences. Separate a person’s testimony from the student’s speculation about that person. The method encourages empathy with methodological care.
5. People and nature: mutual relationships and real constraints
The Geography in Everyday Life syllabus examines how local communities interact with nearby nature areas and how environmental conditions influence human use. Trees can provide shade and spaces for recreation, while heavy visitor use may affect vegetation, soil and wildlife. Students should not frame every interaction as entirely beneficial or harmful. They need to explain a process and consider relevant environmental, social and practical constraints.
Consider a fictional park path with shade trees and benches. Residents may gain a pleasant walking route, but a badly placed shortcut across grass could contribute to erosion and damaged vegetation. A proposal for a new paved route may protect the ground in one area while altering drainage or access elsewhere. The correct judgement depends on the actual evidence and the needs of different users.
Draw an interaction diagram with arrows from environmental feature to human effect, and from human action to environmental effect. Label every arrow with a plausible mechanism. Ask which effects the provided data genuinely show and which would need a separate observation or study. This is stronger than memorising a sentence about protecting nature.
6. Spatial patterns: recognising clusters and routes
Geographers use spatial patterns to describe how features are arranged: clustered, dispersed, linear or concentrated along routes. The pattern is an observation that can suggest a relationship, not automatic proof of why it occurred. Students should identify what is mapped, where it occurs and what comparison makes the pattern meaningful. The legend, map scale and distribution of features matter.
Imagine a fictional map showing food shops clustered beside a transport interchange and fewer shops in residential side streets. A candidate can observe a concentration near the interchange. They may suggest that pedestrian demand contributes, but the map alone cannot establish that demand is the sole reason. Land-use rules, rental costs and historical location choices could also matter.
Using a teacher-provided map, describe the pattern without using the word because. Then add one plausible explanation and state what further data would help test it. This two-stage task stops pupils from confusing description with causation. It is also a useful way to improve short-answer precision.
7. Spatial association does not by itself establish causation
A spatial association occurs when different features tend to be located near one another. For example, services may appear near routes used by commuters. Seeing two features together can support a hypothesis about their relationship, but it does not prove that one caused the other. The student should avoid making a sweeping inference from co-location alone.
Suppose a fictional neighbourhood map shows several cafés near bus stops. It might be reasonable to hypothesise that passing foot traffic matters. Yet both bus stops and cafés could be concentrated in the same town centre because of broader planning. Without information about dates, customers and site selection, neither causal direction is established. Good reasoning keeps such alternatives open.
Ask the learner to write three lines: observed association, possible mechanism and another plausible explanation. Then suggest one piece of additional information, such as observed pedestrian movement or interviews with shop operators. If an answer simply states that buses caused every café to open, return to the distinction between correlation and cause.
8. Spatial accessibility involves the whole journey
Access is more than straight-line distance. The route, barrier-free connections, operating times and different users’ needs can affect whether a service is practical. A location shown close to homes on a map may still be difficult to reach if people must cross a busy road or climb a flight of stairs. Students should explain which measure of accessibility the source actually supports.
Imagine a fictional library only 250 metres from a block as the crow flies. The actual walk may be longer because residents need to reach a safe crossing, and some users may depend on a lift or ramp. A candidate who simply says the library is accessible because it is nearby may overlook those conditions. A well-scoped conclusion considers the relevant journey rather than a single distance.
Sketch a route from a school to a familiar community facility, using known public map features or a teacher-provided plan. Identify three factors that might affect access and explain which could be verified. Avoid collecting private personal information. Ask whether a statement about convenience applies to the people named in the question.
9. Sustainable development requires several criteria
The cluster includes sustainable development, where environmental quality, people’s well-being and the continued use of resources may influence decisions. Not every initiative labelled green automatically benefits every resident or addresses every environmental concern. A useful geographical judgement identifies a proposed action, the desired outcome, constraints and the scale or time frame over which success is assessed.
Imagine a fictional proposal to add shade structures along a walking route. They could improve comfort for some pedestrians but require materials, installation, maintenance and careful placement. A response that says the project is sustainable because it uses trees is incomplete. The student should explain the actual environmental and social consequences that the available evidence supports.
Ask the learner to make a decision table with benefit, limitation, affected group and evidence needed. Compare two proposals against the same criteria. When a question asks for a judgement, state what makes one option preferable in that case. If important data are missing, qualify the decision rather than invent numbers.
10. Geographical methods start with an answerable question
Fieldwork is not merely travelling to an outdoor place. It begins with a clear question and a method capable of collecting relevant data. A tally may estimate use at a particular moment; a questionnaire may explore views; an observation record may note physical features. Each method has strengths and limits. The official syllabus includes bite-sized fieldwork to complement classroom learning, but a written examination can also assess how well students understand methodological decisions.
Consider the fictional question ‘Does use of the park walkway change between morning and afternoon?’ A short tally at clearly defined times can help. Asking three friends whether they like the park would collect opinions about something related but not answer the movement question directly. The mismatch is a validity problem: the method does not measure what the investigation claims.
Have the student design an investigation on paper, stating the variable or feature, location, observation times, recording method and possible limitations. Use teacher-approved and safe activities for any real fieldwork. Emphasise that observation and inference must be separated; a confident conclusion cannot repair irrelevant data.
11. Ecosystem services are distinct functions
The K229 syllabus uses provisioning, regulating, cultural and supporting ecosystem-service categories. Provisioning concerns material goods, regulating may involve cooling and flood moderation, cultural relates to recreation or aesthetic experiences, and supporting includes processes such as pollination or soil formation. One natural feature can deliver more than one service, but these functions should not be treated as interchangeable just because they come from the same park.
Original geographical example
Consider a fictional pond with plants and a walking route. A student who describes the space offering a peaceful place to walk has identified a cultural service. Plants assisting local microclimate regulation illustrate a different category. Insects involved in pollination illustrate supporting processes. The answer must specify the actual benefit or ecological function, rather than apply a label to a place without explanation.
Try this and diagnose the error
Use four cards labelled by service type and six original descriptions of benefits. Ask the learner to match each and explain why. When they classify every human benefit as cultural, challenge the exact mechanism. If a category seems abstract, find a teacher-approved urban example showing its process in context.
12. Everyday urban hazards can be explained without exaggeration
Fire, air pollution and traffic hazards appear under sustainable urban neighbourhoods. The syllabus expects students to recognise causes and consequences and understand preparedness or mitigation in appropriate contexts. A hazard in an illustrative question should not become an unsupported accusation against a real block or street. Strong explanations specify what creates risk, who or what is exposed, and why an action could reduce a negative outcome.
Original geographical example
Imagine a fictional crossing with heavy vehicle movements and students travelling nearby. The relevant traffic issue may be exposure at a busy crossing, not proof that a particular driver has broken a law. A sensible recommendation requires explaining how a changed crossing design or traffic-management measure could reduce interactions that create risk. Saying ‘traffic is dangerous’ is too broad.
Try this and diagnose the error
Write a four-step chain: hazard, exposure, possible consequence and risk-reducing measure. Repeat with a safe paper-based scenario about smoke or fire risk. If the pupil proposes a solution but cannot explain how it addresses the named hazard, teach the mechanism before writing more recommendations.
13. Disaster risk and community resilience are different ideas
Disaster risk management includes reducing exposure and vulnerability, improving preparedness and developing capacity to respond. Resilience relates to communities’ ability to resist, adapt and recover. A neighbourhood can have physical measures and still face uneven challenges among residents. The candidate should explain which aspect a proposed response improves rather than use every hazard-related term as an interchangeable synonym.
Original geographical example
Consider two invented communities experiencing similar periods of heavy rain. One has clearer warnings, accessible information and well-understood response procedures; the other does not. The hazard itself may be similar while the consequences and response capacity differ. That does not prove every outcome in advance, but it identifies how preparedness and vulnerability can affect risk.
Try this and diagnose the error
Ask the learner to separate measures that reduce a hazard, reduce exposure, lower vulnerability or improve response. Give a plausible limitation for each. If an answer says a warning system removes floods, correct the claim: warning can improve response, but does not physically prevent rainfall.
14. Fieldwork needs a safety and privacy plan
School fieldwork is not an invitation to enter unsafe areas or collect unnecessary personal details. The syllabus explicitly considers limitations, resources and measures to avoid harm to students, other people and nature. Ethical data collection should follow school supervision and consent rules. The ability to identify risks is part of research design, not an optional statement to add after collecting the data.
Original geographical example
Imagine pupils proposing a survey at a crowded road crossing where they might obstruct pedestrians, or recording identifiable information about children who have not consented. Both methods are problematic. A teacher-supervised alternative might use an appropriately safe observation location, a fictional sample in a classroom exercise or a privacy-preserving questionnaire approved by the school.
Try this and diagnose the error
Make a risk table for a paper-only proposed study: hazard, who may be affected, prevention and remaining limitation. If the student writes only ‘be careful’, ask exactly what the procedure changes. Do not use home practice as a reason to investigate strangers or conduct unsupervised experiments.
15. Choosing a sampling method makes a difference
The K229 syllabus distinguishes convenience and quota sampling from simple random and stratified random sampling. A convenient group may be fast to reach but may not represent the target population, while a probability design demands a suitable way to select participants. A method should match the geographical question, resources and ethical conditions. Naming a method without discussing who is included or excluded does not establish reliability.
An original learning example
Imagine a fictional survey of park use carried out only among pupils leaving a sports hall. Those responses might tell us something about that group but cannot automatically represent all local residents. A stratified design could consider relevant groups if a safe and appropriate sampling frame exists; it still needs good implementation. The point is not that one sampling technique is universally superior, but that the researcher can explain its limits.
Practise the method and diagnose the weakness
Compare three invented sampling plans and write what each can reasonably claim. If a learner calls a sample random simply because respondents were unfamiliar, ask whether every eligible person truly had a known selection chance. Correct the concept, then test it on a different neighbourhood scenario.
16. Closed-ended questionnaires need neutral wording
Closed-ended survey items offer predefined answer choices and help produce comparable counts or ratings. The official K229 methods section includes scales such as Likert, frequency and ranking. The content and response categories should serve a clearly stated research aim, not lead respondents to a preferred conclusion. A well-designed scale is understandable, non-overlapping where required and explicit about its time or context.
An original learning example
Imagine asking ‘How excellent is our newly improved neighbourhood park?’ That wording presumes a favourable evaluation. A more neutral question could ask respondents to rate cleanliness on a defined scale. A separate question could ask how often they visit during a stated period. These variables may be related but they are not substitutes for each other.
Practise the method and diagnose the weakness
Draft three short questions linked to one invented enquiry and check whether the options cover reasonable responses without overlap. For school practice, use fictional participant data rather than collecting identifying information. If the pupil can calculate percentages but the question measures the wrong concept, repair validity before statistical technique.
17. Quantitative and qualitative methods answer different questions
Visitor counts, percentages and ratings are quantitative data. Semi-structured interviews and descriptions of memorable routes can provide qualitative context. The syllabus includes approaches where one type of evidence guides collection of the other, such as interviewing people after noticing a numerical pattern. Combining approaches can clarify an issue, but a few anecdotes do not automatically validate a city-wide statistical conclusion.
An original learning example
Suppose a fictional tally shows more visitors entering one gate than another. A short interview might reveal that some people prefer a shaded route, offering a possible explanation. That is useful, yet both samples have boundaries: the count belongs to its chosen time, and the interview describes those people who were asked. Further observations could test whether the preference is widespread or persistent.
Practise the method and diagnose the weakness
Make two columns: what the numbers establish and what the interviews may explain. Ask which information would be needed to connect them more confidently. If the student treats an interview as proof of a numerical trend, return to evidence type and scope. Distinguish a plausible explanation from a verified generalisation.
18. Mean, median and mode: original visitor-time example
Geographical methods include interpreting frequencies, percentages, the mean, the median and the mode. These summary measures differ in what they show. A mean uses every numeric observation and can be influenced by very high values. A median identifies the middle value when observations are ordered. A mode identifies the most frequent value. Students should select a statistic that suits the question and explain its limits, not simply calculate without units.
An original learning example
Use the invented five visitor durations 10, 12, 12, 14 and 52 minutes. Their total is 100 minutes, making the mean 20 minutes. The ordered middle observation is 12 minutes, and the most frequent value is also 12 minutes. The single 52-minute visit raises the mean above most individual observations. Reporting 20 minutes as everybody’s typical visit would hide this skew.
Practise the method and diagnose the weakness
Ask the learner to recalculate after replacing 52 with 22, then compare the measures. The new total is 70, mean 14, median 12 and mode 12 minutes. If the student calls a rating category’s arbitrary code an interval measurement, discuss whether a mean is meaningful for that variable. Check denominator, units and interpretation separately.
19. Scatter plots show association, not proof of cause
The official methods content includes positive and negative correlations and best-fit lines. A scatter plot can make a relationship between two variables visible, but association alone does not prove that one causes the other. A third factor can influence both, and small samples can create misleading patterns. Strong written responses describe direction and strength where supported, then distinguish possible mechanisms from observed information.
An original learning example
Imagine invented data showing that stall openings and park visitors both rise on weekends. The two trends may be positively associated, but scheduled events, weather or school holidays may explain both. The graph does not establish that more stalls caused every additional visitor. A negative relationship would likewise need interpretation of the actual axes and context.
Practise the method and diagnose the weakness
Give the pupil three teacher-approved diagrams: rising, falling and no obvious linear association. Ask for an accurate observation with units, a plausible explanation and one limitation. If a student writes ’causes’ automatically from a trend line, request a controlled investigation or additional evidence before accepting the claim.
20. Mental maps reveal experience rather than exact distance
A mental map is a personal representation of familiar places, landmarks, routes or perceived importance. Unlike a scale map it may enlarge emotionally significant locations or omit routes the person rarely uses. The syllabus connects mental maps with semi-structured interviews and analysis of how people represent their lived environment. A good student response avoids treating every drawing difference as an error in measurement.
An original learning example
Picture two fictional residents sketching the same walking route. One emphasises a sheltered market entrance because of daily errands, while another draws a playground larger because of childhood memories. Their maps reveal different place attachments rather than necessarily different physical geography. A researcher could ask what made a feature memorable without assuming the answer.
Practise the method and diagnose the weakness
On a fictional mental map, circle exaggerated or missing features and propose two neutral interview questions. Explain how the drawing could offer insight about perception but should not be used as an exact navigation map. Protect people’s actual residential details when using classroom examples.
21. Good maps need legends, scales and sources
The syllabus names essential map elements including title, date, orientation, scale, legend, author and sources, and representation through dots, lines and polygons. A beautiful drawing can be hard to interpret when symbols are unexplained or distances are unavailable. Maps are arguments about spatial information; they need enough context that another reader can tell what each feature means and which area is covered.
An original learning example
Imagine a fictional map showing park entrances with blue dots but no legend, and a bus route with a green line but no scale. The reader cannot know what the dots represent or estimate distance confidently. A map with accurate symbols and a stated study area would be more useful, even if it is visually simpler.
Practise the method and diagnose the weakness
Check a pupil’s school map against title, date, orientation, scale, legend and data source. Ask why a point, line or area was chosen for each feature. If the child infers walking time from an unscaled sketch, explain why the claim needs route and speed information.
22. Use graph types for the data’s purpose
Bar charts can compare categories; pie charts show appropriately defined parts of a whole; line graphs can show changes over an ordered series such as time. Geography learners should select a display that makes a valid comparison possible. Incorrect axes, missing units, overlapping categories or misleading scales can distort the apparent pattern. The chosen graph must answer the underlying research question.
An original learning example
Consider fictional visitor totals by day. A line graph can show sequence and a bar chart may compare days clearly. If visitors can enter by more than one gate on the same visit, separate gate-use counts might overlap and would not automatically form exclusive parts for a pie chart. The data definition matters before choosing an attractive display.
Practise the method and diagnose the weakness
Present three small datasets and ask the student to choose a chart and justify it. Then show a misleading version of one graph and identify the source of confusion. If every set of percentages becomes a pie chart, check whether the categories truly partition a single whole.
23. Photographs support observations within limits
A photograph captures a visible condition from a particular viewpoint and moment. It cannot automatically establish an annual pattern, a hidden cause or the opinions of people outside the frame. Satellite and aerial images offer wider spatial perspectives but still depend on date, resolution and context. Students should read such resources as evidence with strengths and boundaries, not invent a story from one snapshot.
An original learning example
An imagined photo shows an almost empty playground on a weekday afternoon. The observation is that few people appear in that image. It does not prove that nobody ever uses the playground. Weather, timing or a different entrance could affect what is visible. Another observation period or additional fieldwork might test a wider claim.
Practise the method and diagnose the weakness
Ask the learner for two direct observations and one qualified inference. Note what detail is missing before making a larger conclusion. If an answer assumes that an empty playground proves poor design, request evidence about repeated use and access before accepting that explanation.
24. Full original calculation: two park entrances
The following figures are invented for learning. A hypothetical count records 240 visitors at Entrance East and 180 at Entrance West during one observation window, giving 420 observations in total. East has sixty more, equivalent to one-third more than West when West is used as the comparison base. As shares of the combined observations, East accounts for about 57.1 per cent and West for about 42.9 per cent. A calculation without its base can mislead.
An original learning example
The data permit a comparison for that window only. They do not prove East is always more popular or that its facilities are better. Several factors might influence the route, including transport connections, a one-off event or observer placement. The result could also include repeat visits rather than unique visitors, depending on the counting procedure. A careful investigator would state these limits.
Practise the method and diagnose the weakness
Ask the student to show 240 minus 180 equals 60, then calculate 60 divided by 180 as 33.3 per cent for the relative difference, and 240 divided by 420 as 57.1 per cent for East’s share. If a pupil writes ‘East is 60 per cent busier’, focus on the incorrect denominator. Then design a safer follow-up observation.
25. The designated AO3 six-mark judgement is not Question 1
One easily confused detail deserves separate emphasis. The official K229 Geography paper reserves a six-mark AO3 judgement item inside the candidate’s chosen Question 2 on Climate or Question 3 on Tectonics. Those items are assessed using generic level descriptors, while the other Geography paper questions are point-marked. Question 1 remains a twenty-five-mark compulsory Everyday Geography task, which can still require careful observation, analysis and explanations.
An original learning example
Suppose a learner practises a six-mark evaluation about coastal adaptation and calls it ‘the six marks in Everyday Geography’. The skill may be useful, but the location in the paper is wrong. Accurate revision should track the compulsory twenty-five marks and the chosen option’s twenty-five marks independently, including the particular judgement demand in Section B.
Practise the method and diagnose the weakness
Draw the paper route as Q1 followed by Q2 or Q3. Ask the learner to identify where a decision-making judgement appears and to state which elective topic their school teaches. Verify using the official PDF rather than guessing from a commercial workbook.
26. Geography skills connect to future courses, not guaranteed jobs
Reading maps, investigating questions, understanding environmental systems and communicating uncertainty can support interests in sustainability, urban planning, logistics, geography, data-related work, tourism and community research. These are directions to explore through actual programmes and the whole SEC subject combination. One G2 question, or even one G2 Geography result, is not an automatic professional qualification or fixed educational destination.
An original learning example
Imagine a student who enjoys studying transport access. Mathematics, digital tools and written communication may complement that interest later. Another learner enjoys conservation and may want to compare related science courses. These are possibilities rather than promises. Before deciding on a post-secondary application, check the institution’s current criteria and speak with school counsellors.
Practise the method and diagnose the weakness
After a good Geography task, ask which part the student genuinely enjoyed—mapping, analysis, investigation or judgement. Keep a shortlist of course areas to research later. A grounded optimistic plan uses evidence of interest and development rather than prestige labels.
Eight-week revision route for compulsory Everyday Geography
Week 1
Check K229, the compulsory 25-mark Question 1 and the selected 25-mark Climate or Tectonics question; review teacher feedback. This is a flexible teaching model, not a mandated SEAB calendar. End with one brief correction and a new task testing whether the skill transfers. Leave sufficient time for homework, CCA, other SEC subjects and rest.
Week 2
Interpret one unfamiliar map, including spatial patterns, hierarchy, legend and scale. This is a flexible teaching model, not a mandated SEAB calendar. End with one brief correction and a new task testing whether the skill transfers. Leave sufficient time for homework, CCA, other SEC subjects and rest.
Week 3
Explain one nature–people relationship and one sustainable-development trade-off, supported by stated evidence. This is a flexible teaching model, not a mandated SEAB calendar. End with one brief correction and a new task testing whether the skill transfers. Leave sufficient time for homework, CCA, other SEC subjects and rest.
Week 4
Design a measurable fieldwork question and choose a sampling plan with a clear limitation. This is a flexible teaching model, not a mandated SEAB calendar. End with one brief correction and a new task testing whether the skill transfers. Leave sufficient time for homework, CCA, other SEC subjects and rest.
Week 5
Interpret a mental map or short questionnaire and explain what the data can and cannot represent. This is a flexible teaching model, not a mandated SEAB calendar. End with one brief correction and a new task testing whether the skill transfers. Leave sufficient time for homework, CCA, other SEC subjects and rest.
Week 6
Calculate means, medians and percentages from fresh fictional data, using correct units and bases. This is a flexible teaching model, not a mandated SEAB calendar. End with one brief correction and a new task testing whether the skill transfers. Leave sufficient time for homework, CCA, other SEC subjects and rest.
Week 7
Read a scatter plot and a second graph, separating an observed association from a causal hypothesis. This is a flexible teaching model, not a mandated SEAB calendar. End with one brief correction and a new task testing whether the skill transfers. Leave sufficient time for homework, CCA, other SEC subjects and rest.
Week 8
Complete a mixed Question 1 practice on unseen material and correct one error independently; retain time for Q2/Q3 and Social Studies. This is a flexible teaching model, not a mandated SEAB calendar. End with one brief correction and a new task testing whether the skill transfers. Leave sufficient time for homework, CCA, other SEC subjects and rest.
Questions families ask about G2 Geography Question 1
Is Question 1 compulsory?
Yes. It assesses Cluster 1 Geography in Everyday Life for 25 marks in the 2027 K229 Geography component.
Look at one teacher-marked example and identify the earliest step the learner misunderstood. A fresh independent response is better evidence of progress than copying an answer key.
Can the candidate answer both Climate and Tectonics?
The published scheme requires one of Question 2 or 3. The school’s taught route and actual examination instructions guide preparation.
Look at one teacher-marked example and identify the earliest step the learner misunderstood. A fresh independent response is better evidence of progress than copying an answer key.
Where is the designated six-mark AO3 question?
Within the selected Section B Question 2 or 3, not as a designated item in Question 1.
Look at one teacher-marked example and identify the earliest step the learner misunderstood. A fresh independent response is better evidence of progress than copying an answer key.
Does this Geography subject include fieldwork?
Yes. K229 includes bite-sized fieldwork and methods involving sampling, surveys, mental maps and data presentation.
Look at one teacher-marked example and identify the earliest step the learner misunderstood. A fresh independent response is better evidence of progress than copying an answer key.
Is a calculator allowed?
The official 2027 K229 Geography scheme says an approved calculator may be used.
Look at one teacher-marked example and identify the earliest step the learner misunderstood. A fresh independent response is better evidence of progress than copying an answer key.
Do we need to measure people in our neighbourhood for home practice?
No. Fictional datasets and school-approved materials can teach methodology safely; real fieldwork requires appropriate supervision and privacy safeguards.
Look at one teacher-marked example and identify the earliest step the learner misunderstood. A fresh independent response is better evidence of progress than copying an answer key.
Is K229 the same as standalone G2 Geography K226?
No. K229 is combined Humanities with Social Studies, and has its own Geography papers and choices; standalone K226 differs.
Look at one teacher-marked example and identify the earliest step the learner misunderstood. A fresh independent response is better evidence of progress than copying an answer key.
What might Geography lead to after SEC?
It can develop interests and transferable reasoning, but admission depends on the entire subject-level record and the official criteria applying when students apply.
Look at one teacher-marked example and identify the earliest step the learner misunderstood. A fresh independent response is better evidence of progress than copying an answer key.
Check the exact syllabus and continue to the next learning task
Question 1 in the K229 Geography elective paper assesses compulsory Everyday Geography. Do not confuse this with K226 standalone Geography, which has different paper and fieldwork arrangements.
- Complete G2 syllabus directory
- K229 complete G2 Humanities (Social Studies, Geography) syllabus
- G2 Social Studies Question 5: how multiple sources support a judgement
- Standalone G2 Geography K226: different assessment arrangement
Official sources and connected eduKate guides
Source: SEAB 2027 G2 K229 syllabus and the G2 school-candidate register. Explore combined G2 Humanities Geography, standalone G2 Geography K226, Social Studies Question 5, the complete SEC directory and Clementi’s foundation-first teaching model.
Editorial source distinction: Examination code, structure, geographical methods and the locations of question choices are drawn from SEAB K229 for 2027. The original datasets, discussions and exercises are fictional and independently written. They are not actual neighbourhood measurements, official specimen questions or admissions guarantees. Reviewed October 2026.