
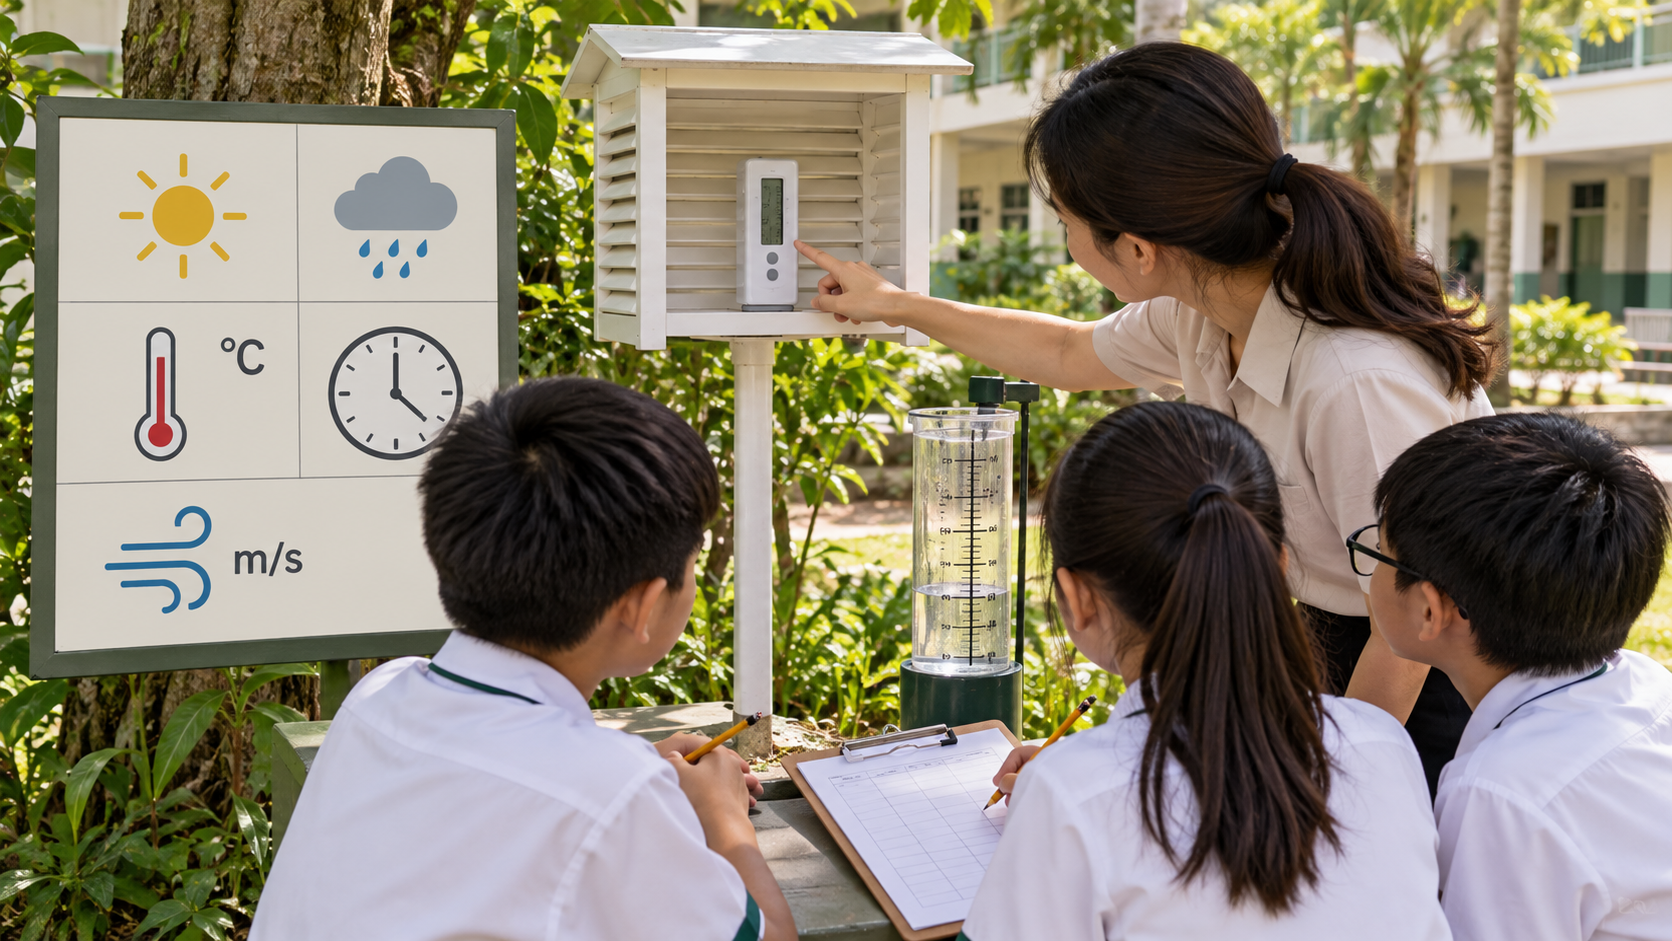
Quick answer: A weather-observation and climate-service civilisation connects weather stations, satellites, ocean data, trained meteorologists, forecasting systems, long-term climate records and accountable public communication to help people make decisions. Weather is the condition of the atmosphere over particular hours or days; climate describes patterns over longer periods. An observation is not a forecast, a forecast is not a guarantee, and a warning only becomes useful when people can understand and act on current authoritative information.
Did you know? The weather forecast on a phone may incorporate observations gathered from thousands of kilometres away. WMO’s global network of weather stations, ocean sensors and satellite data helps meteorological institutions monitor the atmosphere and estimate possible future conditions. But the temperature forecast for an afternoon cannot be equated with climate trends over decades, or with an official warning about an immediate hazard.
Our classroom society Skyhaven is entirely fictional. Its instruments, numbers, notices, failures and families are paper examples, not evidence about actual weather. Wintour checks who can understand and use the information; Rainbolt changes an assumption and requires a transparent correction. The characters are educational roles, not staff of WMO or a national meteorological service.
This field guide extends the Types of a Civilisation series and complements Resilient and Disaster-Adaptive Systems and Measurement Standards, Metrology and Quality Infrastructure. This chapter has its own focus: the human institutions that turn atmospheric observation into forecast and climate knowledge.
This is an educational discussion, not a live forecast, current warning, emergency procedure, equipment calibration or professional weather service. In any real hazard, consult the applicable national meteorological and emergency-management authorities, not Skyhaven’s classroom values.
Quick routes through this guide
- For parents: the quick answer, Missions 01, 02, 09, 10 and 16.
- For Primary students: compare fictional weather records, climate averages and public notices.
- For Secondary learners: compute simple averages, anomalies, rates, denominators and forecast errors.
- For tutors: use two missions per week and rotate observer, arithmetic checker and public-access reviewer.
- For advanced readers: use WMO’s 2025 climate report (published March 2026), GBON and WIS2, plus the 2025 UNDRR early-warning report.
Six institutions necessary for reliable weather information
- Professional measurement and maintenance with known locations, times, units and exposure.
- Global cooperation to exchange compatible atmospheric, marine and satellite data.
- Qualified prediction models evaluated against observations and uncertainty.
- Separate short-term weather forecasts from long-term climate evidence.
- Authorised and inclusive hazard warning and dissemination services.
- Permanent archives, training and public corrections that survive staff and technology changes.
What WMO and UNDRR actually report
Evidence file 1: WMO — Weather and climate definitions
WMO explains weather as the atmospheric state at a particular time, while climate concerns longer-term patterns; climate normals commonly use 30-year periods. Neither a daily high temperature nor a single storm defines a climate trend.
Read the originating institution’s publication. Note the date of publication, dates of observation, geographical coverage and method. A 2025 global climate statistic and a 2026 regional forecast cannot be swapped. A report that a country has an early-warning system does not prove every resident receives warnings or is protected from danger.
The tutor can ask for three evidence statements: one the source supports, one needing additional geographic or temporal detail, and one that is clearly beyond its scope. The class should explicitly label an observation, a model prediction, a climate trend and a policy goal rather than treating all four as measurements.
Evidence file 2: WMO — State of the Global Climate 2025 (published March 2026)
The March 2026 report found 2015–2025 were the eleven hottest years in the instrumental record and estimated 2025 global temperature about 1.43 °C above the 1850–1900 average, with stated uncertainty and methods. This is a global annual finding, not a local daily forecast.
Read the originating institution’s publication. Note the date of publication, dates of observation, geographical coverage and method. A 2025 global climate statistic and a 2026 regional forecast cannot be swapped. A report that a country has an early-warning system does not prove every resident receives warnings or is protected from danger.
The tutor can ask for three evidence statements: one the source supports, one needing additional geographic or temporal detail, and one that is clearly beyond its scope. The class should explicitly label an observation, a model prediction, a climate trend and a policy goal rather than treating all four as measurements.
Evidence file 3: WMO — Global Basic Observing Network
GBON supports improved availability and global exchange of vital surface observations, especially where weather-monitoring capacity has gaps.
Read the originating institution’s publication. Note the date of publication, dates of observation, geographical coverage and method. A 2025 global climate statistic and a 2026 regional forecast cannot be swapped. A report that a country has an early-warning system does not prove every resident receives warnings or is protected from danger.
The tutor can ask for three evidence statements: one the source supports, one needing additional geographic or temporal detail, and one that is clearly beyond its scope. The class should explicitly label an observation, a model prediction, a climate trend and a policy goal rather than treating all four as measurements.
Evidence file 4: WMO — WMO Information System and WIS2
WMO coordinates exchange of observations from stations, ships, buoys and satellites. WIS2 became operational in January 2025, enabling wider exchange through defined technical standards.
Read the originating institution’s publication. Note the date of publication, dates of observation, geographical coverage and method. A 2025 global climate statistic and a 2026 regional forecast cannot be swapped. A report that a country has an early-warning system does not prove every resident receives warnings or is protected from danger.
The tutor can ask for three evidence statements: one the source supports, one needing additional geographic or temporal detail, and one that is clearly beyond its scope. The class should explicitly label an observation, a model prediction, a climate trend and a policy goal rather than treating all four as measurements.
Evidence file 5: WMO — Updated global observing guidance, May 2026
The 26 May 2026 update describes evolving observing needs across atmosphere, ocean and cryosphere, and notes the large and international volume of data underpinning forecasts.
Read the originating institution’s publication. Note the date of publication, dates of observation, geographical coverage and method. A 2025 global climate statistic and a 2026 regional forecast cannot be swapped. A report that a country has an early-warning system does not prove every resident receives warnings or is protected from danger.
The tutor can ask for three evidence statements: one the source supports, one needing additional geographic or temporal detail, and one that is clearly beyond its scope. The class should explicitly label an observation, a model prediction, a climate trend and a policy goal rather than treating all four as measurements.
Evidence file 6: UNDRR — Global Status of Multi-Hazard Early Warning Systems 2025
In the 2025 assessment, 119 countries reported a multi-hazard early-warning system. A system’s reported existence does not mean every household received, understood or could use a warning.
Read the originating institution’s publication. Note the date of publication, dates of observation, geographical coverage and method. A 2025 global climate statistic and a 2026 regional forecast cannot be swapped. A report that a country has an early-warning system does not prove every resident receives warnings or is protected from danger.
The tutor can ask for three evidence statements: one the source supports, one needing additional geographic or temporal detail, and one that is clearly beyond its scope. The class should explicitly label an observation, a model prediction, a climate trend and a policy goal rather than treating all four as measurements.
Evidence file 7: UNDRR — Early warning systems progress announcement
The November 2025 announcement distinguishes hazard knowledge, observation and forecasting, warning communication and early action; progress varies among regions and populations.
Read the originating institution’s publication. Note the date of publication, dates of observation, geographical coverage and method. A 2025 global climate statistic and a 2026 regional forecast cannot be swapped. A report that a country has an early-warning system does not prove every resident receives warnings or is protected from danger.
The tutor can ask for three evidence statements: one the source supports, one needing additional geographic or temporal detail, and one that is clearly beyond its scope. The class should explicitly label an observation, a model prediction, a climate trend and a policy goal rather than treating all four as measurements.
Evidence file 8: WMO — State of the Global Climate series
The historical series helps readers identify a climate report’s observation year and publication year instead of treating older reports as the latest evidence.
Read the originating institution’s publication. Note the date of publication, dates of observation, geographical coverage and method. A 2025 global climate statistic and a 2026 regional forecast cannot be swapped. A report that a country has an early-warning system does not prove every resident receives warnings or is protected from danger.
The tutor can ask for three evidence statements: one the source supports, one needing additional geographic or temporal detail, and one that is clearly beyond its scope. The class should explicitly label an observation, a model prediction, a climate trend and a policy goal rather than treating all four as measurements.
Evidence file 9: UNDRR — Sendai Framework for Disaster Risk Reduction
The Sendai Framework aims to reduce risk through understanding hazards, governance, investment and preparedness. Weather-service institutions contribute information but do not replace emergency response agencies.
Read the originating institution’s publication. Note the date of publication, dates of observation, geographical coverage and method. A 2025 global climate statistic and a 2026 regional forecast cannot be swapped. A report that a country has an early-warning system does not prove every resident receives warnings or is protected from danger.
The tutor can ask for three evidence statements: one the source supports, one needing additional geographic or temporal detail, and one that is clearly beyond its scope. The class should explicitly label an observation, a model prediction, a climate trend and a policy goal rather than treating all four as measurements.
Evidence file 10: WMO — World Weather Watch
This international cooperation underpins global observing, telecommunication and weather forecasting across national boundaries, with each meteorological service responsible for its role.
Read the originating institution’s publication. Note the date of publication, dates of observation, geographical coverage and method. A 2025 global climate statistic and a 2026 regional forecast cannot be swapped. A report that a country has an early-warning system does not prove every resident receives warnings or is protected from danger.
The tutor can ask for three evidence statements: one the source supports, one needing additional geographic or temporal detail, and one that is clearly beyond its scope. The class should explicitly label an observation, a model prediction, a climate trend and a policy goal rather than treating all four as measurements.
Evidence file 11: eduKateSG — Resilient and Disaster-Adaptive Systems
The companion studies broader societal resilience; the present guide examines the specialised weather measurement and information chain.
Read the originating institution’s publication. Note the date of publication, dates of observation, geographical coverage and method. A 2025 global climate statistic and a 2026 regional forecast cannot be swapped. A report that a country has an early-warning system does not prove every resident receives warnings or is protected from danger.
The tutor can ask for three evidence statements: one the source supports, one needing additional geographic or temporal detail, and one that is clearly beyond its scope. The class should explicitly label an observation, a model prediction, a climate trend and a policy goal rather than treating all four as measurements.
Evidence file 12: eduKateSG — Measurement Standards, Metrology and Quality Infrastructure
The companion explains measurements and uncertainty broadly; here those ideas are applied to weather and climate information.
Read the originating institution’s publication. Note the date of publication, dates of observation, geographical coverage and method. A 2025 global climate statistic and a 2026 regional forecast cannot be swapped. A report that a country has an early-warning system does not prove every resident receives warnings or is protected from danger.
The tutor can ask for three evidence statements: one the source supports, one needing additional geographic or temporal detail, and one that is clearly beyond its scope. The class should explicitly label an observation, a model prediction, a climate trend and a policy goal rather than treating all four as measurements.
Sixteen Skyhaven missions
- 01. Weather and climate are different timescales
- 02. Observation, forecast and warning are separate information products
- 03. Surface stations and the meaning of measurement context
- 04. Rain gauges, rainfall totals and accumulation windows
- 05. Pressure, wind, humidity and different atmospheric quantities
- 06. Satellites and ground observations have complementary roles
- 07. International data exchange and the WMO system
- 08. Numerical forecasts and why they contain uncertainty
- 09. Probability forecasts and the common 70% mistake
- 10. Heat alerts, rainfall warnings and official public authority
- 11. Early warning means more than sensors and sirens
- 12. Climate normals, anomalies and reference periods
- 13. Ocean, polar and remote observations
- 14. Forecast communication, accessibility and trust
- 15. Weather data quality, verification and versioned records
- 16. Meteorological institutions that can outlive their founders
Mission 01 — Weather and climate are different timescales
Skyhaven opens the lesson: Skyhaven’s school newsletter describes one very rainy afternoon as proof its region’s climate has permanently changed.
The short, accurate explanation
Weather describes conditions at a particular time, including temperature, precipitation, wind and pressure. Climate concerns statistical patterns over longer periods, commonly described with thirty-year normals. A one-day anomaly is not a complete trend or a denial of longer-term change.
Start with the observable variable and the user’s actual question. Does the person want to know what happened at a station, what might happen tomorrow, how conditions differ from a climatological baseline, or what an authorised warning says? Those aims need different evidence, language and responsible institutions. A visually impressive weather dashboard is not enough.
The crucial distinction for weather and climate are different timescales is: Weather describes conditions at a particular time, including temperature, precipitation, wind and pressure. Climate concerns statistical patterns over longer periods, commonly described with thirty-year normals. A one-day anomaly is not a complete trend or a denial of longer-term change. Ask the learner to define which claim belongs to an observed fact, which is a model or interpretation, and which would need a legally authorised public warning. Misidentifying that role makes the communication unreliable even if the calculation appears neat.
Who observes, checks, forecasts and communicates?
A useful explanation traces the information chain: observation location, instrument or data stream, quality checks, international exchange when relevant, prediction or statistical analysis, and public communication. Each stage can fail independently. Record the original source and timestamp rather than pretending that a current phone display and an archived report are the same product.
International cooperation is a distinct civilisational capability. A local forecaster can benefit from marine buoys, satellite observations or upstream atmospheric data made available internationally. WMO’s GBON and WIS2 demonstrate institutional data exchange, not merely a collection of machines. The student should be able to identify a shared source’s limitations.
In the fictional case, Skyhaven’s school newsletter describes one very rainy afternoon as proof its region’s climate has permanently changed. Map what the original observation can directly show and the later stages needed for public use. Where the source is a weather report, show its location and time. Where the source is climate research, show its baseline, aggregation method and source publication date. Avoid treating a sketch of a data flow as an actual operational network.
Evidence and how to avoid making a false claim
Source context matters for both evidence and ethics. WMO’s annual climate reports and observations are public scientific work; national warning agencies have specific legal responsibilities; an invented story is merely a teaching case. The child should know the difference and never imply a classroom forecast is official.
For this mission, one might consult WMO on weather and climate are different timescales. A WMO document defining weather and climate can explain general concepts, while WMO’s Global Basic Observing Network describes observational cooperation and the UNDRR report analyses multi-hazard warning systems. Each gives a different type of authoritative support. The pupil should cite the exact publication rather than the organisation’s name alone.
A conditional mathematics example
A fictional station measures 12 mm of rain on Monday and 0 mm Tuesday. The two-day total is 12 mm; neither result alone establishes a regional climate shift.
Weather and climate science uses physical quantities in defined units. A rainfall depth needs its accumulation window, temperature has place and observation conditions, a wind vector needs speed and direction, and forecast probability needs a clearly defined event and valid period. Mathematical literacy begins with the question the number is supposed to answer.
A statistic may be arithmetically correct yet socially misleading. Forecast errors from one day cannot define skill, a global surface-temperature anomaly is not a local reading, and a percentage of formatted warnings is not the share of people successfully protected. State numerator, denominator, location, time and the relevant outcome.
Now change exactly one paper assumption and compute again, stating the same relevant unit and period. The revised result can show how the model responds, but not a validated risk forecast, a climatological trend, or real forecast skill. If a hazard might be involved in real life, authorised current advice takes priority over the classroom calculation.
Rainbolt finds the assumption that fails
Rainbolt adds twenty years of observations, forcing the first headline to specify its timescale.
Rainbolt introduces a changed condition: a station location changes, an observation is wrongly labelled, a model lead time shifts, data are duplicated, or a notice expires. The learner keeps the original claim in a version history and writes why the corrected statement is narrower or different. Corrections should be part of public trust.
The learner keeps both versions and labels the change: new observation, different reference, expired notice or revised model condition. A corrected public explanation should make the uncertain part visible and mention the proper authorised institution if a real decision would follow. A useful article does not merely replace one dramatic headline with another.
Wintour checks that a person can actually use the information
Wintour asks how clear language can inform students without exaggerating a local event.
Wintour asks who could be excluded or harmed by the communication. A child walking to school, an older resident, a worker outdoors, a person with a disability, or someone with limited Internet access may face different information needs. A forecast is not meaningfully accessible if the intended user cannot obtain or understand it.
Recognise the boundary between learning and real operations. Children may draw weather charts and evaluate hypothetical messages but should not attempt to issue emergency alerts, calibrate professional instruments or make field predictions from the paper scenarios. Actual safety decisions belong to authorised meteorological and emergency professionals.
In a society, meteorological science supports work, schooling, transport, water services and general safety. Useful access depends on more than scientific accuracy: messages must match the question, arrive at a meaningful time and be understandable to the recipients. This does not authorise the class to tell real residents how to respond to hazards.
Family activity and a small-group tutorial
Sort paper cards into current weather, seasonal pattern, climate normal and unsupported inference.
A three-learner tutorial can assign a source historian, maths interpreter and user-access reviewer. Rotate roles after introducing a changed weather condition or observation error. Each student should restate another’s important concern accurately before the group publishes a revised classroom explanation.
End with a successor-ready record: purpose, station or geographic area, observation and publication times, unit, method, forecast horizon if present, uncertainty, institutional source, vulnerable user needs and versioned corrections. A new learner should be able to reconstruct the conclusion without the original teacher present.
Four case-study cards
The misleading weather or climate headline
The claim begins: Skyhaven’s school newsletter describes one very rainy afternoon as proof its region’s climate has permanently changed. Write a more accurate title identifying the observed or predicted quantity, reference period, place and authority. Name a fact that remains unknown.
A strong answer returns to the mission mechanism: Weather describes conditions at a particular time, including temperature, precipitation, wind and pressure. Climate concerns statistical patterns over longer periods, commonly described with thirty-year normals. A one-day anomaly is not a complete trend or a denial of longer-term change. It should not inflate the fictional result into a real public warning. Instead it names the exact type of evidence, the limitations of the observation, and whether someone with another user need might interpret the same information differently.
For weather and climate are different timescales, rotate three readers: the first checks WMO or UNDRR provenance and times, the second computes and interprets the numeric example, and the third examines accessible communication. Each child must paraphrase a peer’s objection and then write a succinct correction the next pupil could use without the teacher’s help.
What does the number actually measure?
Use this invented calculation: A fictional station measures 12 mm of rain on Monday and 0 mm Tuesday. The two-day total is 12 mm; neither result alone establishes a regional climate shift. Check the unit, denominator or accumulation period. Change an input and show what the new arithmetic does not establish.
A strong answer returns to the mission mechanism: Weather describes conditions at a particular time, including temperature, precipitation, wind and pressure. Climate concerns statistical patterns over longer periods, commonly described with thirty-year normals. A one-day anomaly is not a complete trend or a denial of longer-term change. It should not inflate the fictional result into a real public warning. Instead it names the exact type of evidence, the limitations of the observation, and whether someone with another user need might interpret the same information differently.
For weather and climate are different timescales, rotate three readers: the first checks WMO or UNDRR provenance and times, the second computes and interprets the numeric example, and the third examines accessible communication. Each child must paraphrase a peer’s objection and then write a succinct correction the next pupil could use without the teacher’s help.
The original evidence changes
Rainbolt adds: Rainbolt adds twenty years of observations, forcing the first headline to specify its timescale. Identify the first point in the observation or forecast chain where the old inference fails. Write a versioned correction and explain the correct source for a real public query.
A strong answer returns to the mission mechanism: Weather describes conditions at a particular time, including temperature, precipitation, wind and pressure. Climate concerns statistical patterns over longer periods, commonly described with thirty-year normals. A one-day anomaly is not a complete trend or a denial of longer-term change. It should not inflate the fictional result into a real public warning. Instead it names the exact type of evidence, the limitations of the observation, and whether someone with another user need might interpret the same information differently.
For weather and climate are different timescales, rotate three readers: the first checks WMO or UNDRR provenance and times, the second computes and interprets the numeric example, and the third examines accessible communication. Each child must paraphrase a peer’s objection and then write a succinct correction the next pupil could use without the teacher’s help.
The user left out of the forecast
Wintour asks: Wintour asks how clear language can inform students without exaggerating a local event. State a plausible accessibility or fairness concern and describe the type of authorised information that could improve the person’s understanding without issuing actual emergency instructions.
A strong answer returns to the mission mechanism: Weather describes conditions at a particular time, including temperature, precipitation, wind and pressure. Climate concerns statistical patterns over longer periods, commonly described with thirty-year normals. A one-day anomaly is not a complete trend or a denial of longer-term change. It should not inflate the fictional result into a real public warning. Instead it names the exact type of evidence, the limitations of the observation, and whether someone with another user need might interpret the same information differently.
For weather and climate are different timescales, rotate three readers: the first checks WMO or UNDRR provenance and times, the second computes and interprets the numeric example, and the third examines accessible communication. Each child must paraphrase a peer’s objection and then write a succinct correction the next pupil could use without the teacher’s help.
Long-term transfer: A new learner understands weather and climate are different timescales when they can identify the question, observation or modelling stage, source date, uncertainty, affected user and why the initial public claim was too broad.
Mission 02 — Observation, forecast and warning are separate information products
Skyhaven opens the lesson: A fictional radio channel announces that because an instrument read 32 °C at noon, temperatures are guaranteed to remain that value all week.
The short, accurate explanation
An observation describes something measured at a time and location; a forecast estimates future conditions under a model and lead time; a warning communicates potential hazards under an authoritative system. Their evidence, units and responsibilities differ.
Start with the observable variable and the user’s actual question. Does the person want to know what happened at a station, what might happen tomorrow, how conditions differ from a climatological baseline, or what an authorised warning says? Those aims need different evidence, language and responsible institutions. A visually impressive weather dashboard is not enough.
The crucial distinction for observation, forecast and warning are separate information products is: An observation describes something measured at a time and location; a forecast estimates future conditions under a model and lead time; a warning communicates potential hazards under an authoritative system. Their evidence, units and responsibilities differ. Ask the learner to define which claim belongs to an observed fact, which is a model or interpretation, and which would need a legally authorised public warning. Misidentifying that role makes the communication unreliable even if the calculation appears neat.
Who observes, checks, forecasts and communicates?
A useful explanation traces the information chain: observation location, instrument or data stream, quality checks, international exchange when relevant, prediction or statistical analysis, and public communication. Each stage can fail independently. Record the original source and timestamp rather than pretending that a current phone display and an archived report are the same product.
International cooperation is a distinct civilisational capability. A local forecaster can benefit from marine buoys, satellite observations or upstream atmospheric data made available internationally. WMO’s GBON and WIS2 demonstrate institutional data exchange, not merely a collection of machines. The student should be able to identify a shared source’s limitations.
In the fictional case, A fictional radio channel announces that because an instrument read 32 °C at noon, temperatures are guaranteed to remain that value all week. Map what the original observation can directly show and the later stages needed for public use. Where the source is a weather report, show its location and time. Where the source is climate research, show its baseline, aggregation method and source publication date. Avoid treating a sketch of a data flow as an actual operational network.
Evidence and how to avoid making a false claim
Source context matters for both evidence and ethics. WMO’s annual climate reports and observations are public scientific work; national warning agencies have specific legal responsibilities; an invented story is merely a teaching case. The child should know the difference and never imply a classroom forecast is official.
For this mission, one might consult WMO on observation, forecast and warning are separate information products. A WMO document defining weather and climate can explain general concepts, while WMO’s Global Basic Observing Network describes observational cooperation and the UNDRR report analyses multi-hazard warning systems. Each gives a different type of authoritative support. The pupil should cite the exact publication rather than the organisation’s name alone.
A conditional mathematics example
A toy forecast gives 24 °C for one hour and an invented observation records 26 °C. The difference is two degrees for that paired case, not a verified model accuracy score.
Weather and climate science uses physical quantities in defined units. A rainfall depth needs its accumulation window, temperature has place and observation conditions, a wind vector needs speed and direction, and forecast probability needs a clearly defined event and valid period. Mathematical literacy begins with the question the number is supposed to answer.
A statistic may be arithmetically correct yet socially misleading. Forecast errors from one day cannot define skill, a global surface-temperature anomaly is not a local reading, and a percentage of formatted warnings is not the share of people successfully protected. State numerator, denominator, location, time and the relevant outcome.
Now change exactly one paper assumption and compute again, stating the same relevant unit and period. The revised result can show how the model responds, but not a validated risk forecast, a climatological trend, or real forecast skill. If a hazard might be involved in real life, authorised current advice takes priority over the classroom calculation.
Rainbolt finds the assumption that fails
Rainbolt learns the reading and forecast refer to different locations.
Rainbolt introduces a changed condition: a station location changes, an observation is wrongly labelled, a model lead time shifts, data are duplicated, or a notice expires. The learner keeps the original claim in a version history and writes why the corrected statement is narrower or different. Corrections should be part of public trust.
The learner keeps both versions and labels the change: new observation, different reference, expired notice or revised model condition. A corrected public explanation should make the uncertain part visible and mention the proper authorised institution if a real decision would follow. A useful article does not merely replace one dramatic headline with another.
Wintour checks that a person can actually use the information
Wintour asks whether people can find official, accessible and current weather information.
Wintour asks who could be excluded or harmed by the communication. A child walking to school, an older resident, a worker outdoors, a person with a disability, or someone with limited Internet access may face different information needs. A forecast is not meaningfully accessible if the intended user cannot obtain or understand it.
Recognise the boundary between learning and real operations. Children may draw weather charts and evaluate hypothetical messages but should not attempt to issue emergency alerts, calibrate professional instruments or make field predictions from the paper scenarios. Actual safety decisions belong to authorised meteorological and emergency professionals.
In a society, meteorological science supports work, schooling, transport, water services and general safety. Useful access depends on more than scientific accuracy: messages must match the question, arrive at a meaningful time and be understandable to the recipients. This does not authorise the class to tell real residents how to respond to hazards.
Family activity and a small-group tutorial
Draw three labelled paper notices with sources, dates and an uncertainty field.
A three-learner tutorial can assign a source historian, maths interpreter and user-access reviewer. Rotate roles after introducing a changed weather condition or observation error. Each student should restate another’s important concern accurately before the group publishes a revised classroom explanation.
End with a successor-ready record: purpose, station or geographic area, observation and publication times, unit, method, forecast horizon if present, uncertainty, institutional source, vulnerable user needs and versioned corrections. A new learner should be able to reconstruct the conclusion without the original teacher present.
Four case-study cards
The misleading weather or climate headline
The claim begins: A fictional radio channel announces that because an instrument read 32 °C at noon, temperatures are guaranteed to remain that value all week. Write a more accurate title identifying the observed or predicted quantity, reference period, place and authority. Name a fact that remains unknown.
A strong answer returns to the mission mechanism: An observation describes something measured at a time and location; a forecast estimates future conditions under a model and lead time; a warning communicates potential hazards under an authoritative system. Their evidence, units and responsibilities differ. It should not inflate the fictional result into a real public warning. Instead it names the exact type of evidence, the limitations of the observation, and whether someone with another user need might interpret the same information differently.
For observation, forecast and warning are separate information products, rotate three readers: the first checks WMO or UNDRR provenance and times, the second computes and interprets the numeric example, and the third examines accessible communication. Each child must paraphrase a peer’s objection and then write a succinct correction the next pupil could use without the teacher’s help.
What does the number actually measure?
Use this invented calculation: A toy forecast gives 24 °C for one hour and an invented observation records 26 °C. The difference is two degrees for that paired case, not a verified model accuracy score. Check the unit, denominator or accumulation period. Change an input and show what the new arithmetic does not establish.
A strong answer returns to the mission mechanism: An observation describes something measured at a time and location; a forecast estimates future conditions under a model and lead time; a warning communicates potential hazards under an authoritative system. Their evidence, units and responsibilities differ. It should not inflate the fictional result into a real public warning. Instead it names the exact type of evidence, the limitations of the observation, and whether someone with another user need might interpret the same information differently.
For observation, forecast and warning are separate information products, rotate three readers: the first checks WMO or UNDRR provenance and times, the second computes and interprets the numeric example, and the third examines accessible communication. Each child must paraphrase a peer’s objection and then write a succinct correction the next pupil could use without the teacher’s help.
The original evidence changes
Rainbolt adds: Rainbolt learns the reading and forecast refer to different locations. Identify the first point in the observation or forecast chain where the old inference fails. Write a versioned correction and explain the correct source for a real public query.
A strong answer returns to the mission mechanism: An observation describes something measured at a time and location; a forecast estimates future conditions under a model and lead time; a warning communicates potential hazards under an authoritative system. Their evidence, units and responsibilities differ. It should not inflate the fictional result into a real public warning. Instead it names the exact type of evidence, the limitations of the observation, and whether someone with another user need might interpret the same information differently.
For observation, forecast and warning are separate information products, rotate three readers: the first checks WMO or UNDRR provenance and times, the second computes and interprets the numeric example, and the third examines accessible communication. Each child must paraphrase a peer’s objection and then write a succinct correction the next pupil could use without the teacher’s help.
The user left out of the forecast
Wintour asks: Wintour asks whether people can find official, accessible and current weather information. State a plausible accessibility or fairness concern and describe the type of authorised information that could improve the person’s understanding without issuing actual emergency instructions.
A strong answer returns to the mission mechanism: An observation describes something measured at a time and location; a forecast estimates future conditions under a model and lead time; a warning communicates potential hazards under an authoritative system. Their evidence, units and responsibilities differ. It should not inflate the fictional result into a real public warning. Instead it names the exact type of evidence, the limitations of the observation, and whether someone with another user need might interpret the same information differently.
For observation, forecast and warning are separate information products, rotate three readers: the first checks WMO or UNDRR provenance and times, the second computes and interprets the numeric example, and the third examines accessible communication. Each child must paraphrase a peer’s objection and then write a succinct correction the next pupil could use without the teacher’s help.
Long-term transfer: A new learner understands observation, forecast and warning are separate information products when they can identify the question, observation or modelling stage, source date, uncertainty, affected user and why the initial public claim was too broad.
Mission 03 — Surface stations and the meaning of measurement context
Skyhaven opens the lesson: Skyhaven’s students compare a sun-exposed toy thermometer with a professionally sited station as if the measurements represented the same air temperature.
The short, accurate explanation
Reliable meteorological observations depend on the defined measurand, exposure, instrument calibration, siting, time and metadata. A classroom number is not interchangeable with a qualified public observation merely because the unit looks correct.
Start with the observable variable and the user’s actual question. Does the person want to know what happened at a station, what might happen tomorrow, how conditions differ from a climatological baseline, or what an authorised warning says? Those aims need different evidence, language and responsible institutions. A visually impressive weather dashboard is not enough.
The crucial distinction for surface stations and the meaning of measurement context is: Reliable meteorological observations depend on the defined measurand, exposure, instrument calibration, siting, time and metadata. A classroom number is not interchangeable with a qualified public observation merely because the unit looks correct. Ask the learner to define which claim belongs to an observed fact, which is a model or interpretation, and which would need a legally authorised public warning. Misidentifying that role makes the communication unreliable even if the calculation appears neat.
Who observes, checks, forecasts and communicates?
A useful explanation traces the information chain: observation location, instrument or data stream, quality checks, international exchange when relevant, prediction or statistical analysis, and public communication. Each stage can fail independently. Record the original source and timestamp rather than pretending that a current phone display and an archived report are the same product.
International cooperation is a distinct civilisational capability. A local forecaster can benefit from marine buoys, satellite observations or upstream atmospheric data made available internationally. WMO’s GBON and WIS2 demonstrate institutional data exchange, not merely a collection of machines. The student should be able to identify a shared source’s limitations.
In the fictional case, Skyhaven’s students compare a sun-exposed toy thermometer with a professionally sited station as if the measurements represented the same air temperature. Map what the original observation can directly show and the later stages needed for public use. Where the source is a weather report, show its location and time. Where the source is climate research, show its baseline, aggregation method and source publication date. Avoid treating a sketch of a data flow as an actual operational network.
Evidence and how to avoid making a false claim
Source context matters for both evidence and ethics. WMO’s annual climate reports and observations are public scientific work; national warning agencies have specific legal responsibilities; an invented story is merely a teaching case. The child should know the difference and never imply a classroom forecast is official.
For this mission, one might consult WMO on surface stations and the meaning of measurement context. A WMO document defining weather and climate can explain general concepts, while WMO’s Global Basic Observing Network describes observational cooperation and the UNDRR report analyses multi-hazard warning systems. Each gives a different type of authoritative support. The pupil should cite the exact publication rather than the organisation’s name alone.
A conditional mathematics example
Three invented station readings are 29, 30 and 31 °C. Their arithmetic mean is 30 °C, but the average does not prove all were made under comparable conditions.
Weather and climate science uses physical quantities in defined units. A rainfall depth needs its accumulation window, temperature has place and observation conditions, a wind vector needs speed and direction, and forecast probability needs a clearly defined event and valid period. Mathematical literacy begins with the question the number is supposed to answer.
A statistic may be arithmetically correct yet socially misleading. Forecast errors from one day cannot define skill, a global surface-temperature anomaly is not a local reading, and a percentage of formatted warnings is not the share of people successfully protected. State numerator, denominator, location, time and the relevant outcome.
Now change exactly one paper assumption and compute again, stating the same relevant unit and period. The revised result can show how the model responds, but not a validated risk forecast, a climatological trend, or real forecast skill. If a hazard might be involved in real life, authorised current advice takes priority over the classroom calculation.
Rainbolt finds the assumption that fails
Rainbolt reveals one station was measuring surface temperature rather than screened air temperature.
Rainbolt introduces a changed condition: a station location changes, an observation is wrongly labelled, a model lead time shifts, data are duplicated, or a notice expires. The learner keeps the original claim in a version history and writes why the corrected statement is narrower or different. Corrections should be part of public trust.
The learner keeps both versions and labels the change: new observation, different reference, expired notice or revised model condition. A corrected public explanation should make the uncertain part visible and mention the proper authorised institution if a real decision would follow. A useful article does not merely replace one dramatic headline with another.
Wintour checks that a person can actually use the information
Wintour considers the risk of misleading people about outdoor conditions from unverified household readings.
Wintour asks who could be excluded or harmed by the communication. A child walking to school, an older resident, a worker outdoors, a person with a disability, or someone with limited Internet access may face different information needs. A forecast is not meaningfully accessible if the intended user cannot obtain or understand it.
Recognise the boundary between learning and real operations. Children may draw weather charts and evaluate hypothetical messages but should not attempt to issue emergency alerts, calibrate professional instruments or make field predictions from the paper scenarios. Actual safety decisions belong to authorised meteorological and emergency professionals.
In a society, meteorological science supports work, schooling, transport, water services and general safety. Useful access depends on more than scientific accuracy: messages must match the question, arrive at a meaningful time and be understandable to the recipients. This does not authorise the class to tell real residents how to respond to hazards.
Family activity and a small-group tutorial
Use printed weather-log cards; do not operate or certify weather sensors.
A three-learner tutorial can assign a source historian, maths interpreter and user-access reviewer. Rotate roles after introducing a changed weather condition or observation error. Each student should restate another’s important concern accurately before the group publishes a revised classroom explanation.
End with a successor-ready record: purpose, station or geographic area, observation and publication times, unit, method, forecast horizon if present, uncertainty, institutional source, vulnerable user needs and versioned corrections. A new learner should be able to reconstruct the conclusion without the original teacher present.
Four case-study cards
The misleading weather or climate headline
The claim begins: Skyhaven’s students compare a sun-exposed toy thermometer with a professionally sited station as if the measurements represented the same air temperature. Write a more accurate title identifying the observed or predicted quantity, reference period, place and authority. Name a fact that remains unknown.
A strong answer returns to the mission mechanism: Reliable meteorological observations depend on the defined measurand, exposure, instrument calibration, siting, time and metadata. A classroom number is not interchangeable with a qualified public observation merely because the unit looks correct. It should not inflate the fictional result into a real public warning. Instead it names the exact type of evidence, the limitations of the observation, and whether someone with another user need might interpret the same information differently.
For surface stations and the meaning of measurement context, rotate three readers: the first checks WMO or UNDRR provenance and times, the second computes and interprets the numeric example, and the third examines accessible communication. Each child must paraphrase a peer’s objection and then write a succinct correction the next pupil could use without the teacher’s help.
What does the number actually measure?
Use this invented calculation: Three invented station readings are 29, 30 and 31 °C. Their arithmetic mean is 30 °C, but the average does not prove all were made under comparable conditions. Check the unit, denominator or accumulation period. Change an input and show what the new arithmetic does not establish.
A strong answer returns to the mission mechanism: Reliable meteorological observations depend on the defined measurand, exposure, instrument calibration, siting, time and metadata. A classroom number is not interchangeable with a qualified public observation merely because the unit looks correct. It should not inflate the fictional result into a real public warning. Instead it names the exact type of evidence, the limitations of the observation, and whether someone with another user need might interpret the same information differently.
For surface stations and the meaning of measurement context, rotate three readers: the first checks WMO or UNDRR provenance and times, the second computes and interprets the numeric example, and the third examines accessible communication. Each child must paraphrase a peer’s objection and then write a succinct correction the next pupil could use without the teacher’s help.
The original evidence changes
Rainbolt adds: Rainbolt reveals one station was measuring surface temperature rather than screened air temperature. Identify the first point in the observation or forecast chain where the old inference fails. Write a versioned correction and explain the correct source for a real public query.
A strong answer returns to the mission mechanism: Reliable meteorological observations depend on the defined measurand, exposure, instrument calibration, siting, time and metadata. A classroom number is not interchangeable with a qualified public observation merely because the unit looks correct. It should not inflate the fictional result into a real public warning. Instead it names the exact type of evidence, the limitations of the observation, and whether someone with another user need might interpret the same information differently.
For surface stations and the meaning of measurement context, rotate three readers: the first checks WMO or UNDRR provenance and times, the second computes and interprets the numeric example, and the third examines accessible communication. Each child must paraphrase a peer’s objection and then write a succinct correction the next pupil could use without the teacher’s help.
The user left out of the forecast
Wintour asks: Wintour considers the risk of misleading people about outdoor conditions from unverified household readings. State a plausible accessibility or fairness concern and describe the type of authorised information that could improve the person’s understanding without issuing actual emergency instructions.
A strong answer returns to the mission mechanism: Reliable meteorological observations depend on the defined measurand, exposure, instrument calibration, siting, time and metadata. A classroom number is not interchangeable with a qualified public observation merely because the unit looks correct. It should not inflate the fictional result into a real public warning. Instead it names the exact type of evidence, the limitations of the observation, and whether someone with another user need might interpret the same information differently.
For surface stations and the meaning of measurement context, rotate three readers: the first checks WMO or UNDRR provenance and times, the second computes and interprets the numeric example, and the third examines accessible communication. Each child must paraphrase a peer’s objection and then write a succinct correction the next pupil could use without the teacher’s help.
Long-term transfer: A new learner understands surface stations and the meaning of measurement context when they can identify the question, observation or modelling stage, source date, uncertainty, affected user and why the initial public claim was too broad.
Mission 04 — Rain gauges, rainfall totals and accumulation windows
Skyhaven opens the lesson: A news bulletin lists 60 millimetres of rainfall without specifying whether it fell in one hour, one day or one month.
The short, accurate explanation
Rainfall depth is an accumulated measurement over a defined area representation and time. The same total distributed over an hour rather than a month can have very different implications; local impacts require professional hazard analysis.
Start with the observable variable and the user’s actual question. Does the person want to know what happened at a station, what might happen tomorrow, how conditions differ from a climatological baseline, or what an authorised warning says? Those aims need different evidence, language and responsible institutions. A visually impressive weather dashboard is not enough.
The crucial distinction for rain gauges, rainfall totals and accumulation windows is: Rainfall depth is an accumulated measurement over a defined area representation and time. The same total distributed over an hour rather than a month can have very different implications; local impacts require professional hazard analysis. Ask the learner to define which claim belongs to an observed fact, which is a model or interpretation, and which would need a legally authorised public warning. Misidentifying that role makes the communication unreliable even if the calculation appears neat.
Who observes, checks, forecasts and communicates?
A useful explanation traces the information chain: observation location, instrument or data stream, quality checks, international exchange when relevant, prediction or statistical analysis, and public communication. Each stage can fail independently. Record the original source and timestamp rather than pretending that a current phone display and an archived report are the same product.
International cooperation is a distinct civilisational capability. A local forecaster can benefit from marine buoys, satellite observations or upstream atmospheric data made available internationally. WMO’s GBON and WIS2 demonstrate institutional data exchange, not merely a collection of machines. The student should be able to identify a shared source’s limitations.
In the fictional case, A news bulletin lists 60 millimetres of rainfall without specifying whether it fell in one hour, one day or one month. Map what the original observation can directly show and the later stages needed for public use. Where the source is a weather report, show its location and time. Where the source is climate research, show its baseline, aggregation method and source publication date. Avoid treating a sketch of a data flow as an actual operational network.
Evidence and how to avoid making a false claim
Source context matters for both evidence and ethics. WMO’s annual climate reports and observations are public scientific work; national warning agencies have specific legal responsibilities; an invented story is merely a teaching case. The child should know the difference and never imply a classroom forecast is official.
For this mission, one might consult WMO on rain gauges, rainfall totals and accumulation windows. A WMO document defining weather and climate can explain general concepts, while WMO’s Global Basic Observing Network describes observational cooperation and the UNDRR report analyses multi-hazard warning systems. Each gives a different type of authoritative support. The pupil should cite the exact publication rather than the organisation’s name alone.
A conditional mathematics example
A paper town records 30 mm in the morning and 15 mm in the afternoon, or 45 mm during that day. This is a fictional accumulated total, not a flood prediction.
Weather and climate science uses physical quantities in defined units. A rainfall depth needs its accumulation window, temperature has place and observation conditions, a wind vector needs speed and direction, and forecast probability needs a clearly defined event and valid period. Mathematical literacy begins with the question the number is supposed to answer.
A statistic may be arithmetically correct yet socially misleading. Forecast errors from one day cannot define skill, a global surface-temperature anomaly is not a local reading, and a percentage of formatted warnings is not the share of people successfully protected. State numerator, denominator, location, time and the relevant outcome.
Now change exactly one paper assumption and compute again, stating the same relevant unit and period. The revised result can show how the model responds, but not a validated risk forecast, a climatological trend, or real forecast skill. If a hazard might be involved in real life, authorised current advice takes priority over the classroom calculation.
Rainbolt finds the assumption that fails
Rainbolt changes the accumulation window from a day to an hour in one of the labels.
Rainbolt introduces a changed condition: a station location changes, an observation is wrongly labelled, a model lead time shifts, data are duplicated, or a notice expires. The learner keeps the original claim in a version history and writes why the corrected statement is narrower or different. Corrections should be part of public trust.
The learner keeps both versions and labels the change: new observation, different reference, expired notice or revised model condition. A corrected public explanation should make the uncertain part visible and mention the proper authorised institution if a real decision would follow. A useful article does not merely replace one dramatic headline with another.
Wintour checks that a person can actually use the information
Wintour asks for clear descriptions for commuters and residents without presenting an unsafe forecast.
Wintour asks who could be excluded or harmed by the communication. A child walking to school, an older resident, a worker outdoors, a person with a disability, or someone with limited Internet access may face different information needs. A forecast is not meaningfully accessible if the intended user cannot obtain or understand it.
Recognise the boundary between learning and real operations. Children may draw weather charts and evaluate hypothetical messages but should not attempt to issue emergency alerts, calibrate professional instruments or make field predictions from the paper scenarios. Actual safety decisions belong to authorised meteorological and emergency professionals.
In a society, meteorological science supports work, schooling, transport, water services and general safety. Useful access depends on more than scientific accuracy: messages must match the question, arrive at a meaningful time and be understandable to the recipients. This does not authorise the class to tell real residents how to respond to hazards.
Family activity and a small-group tutorial
Correct invented rainfall charts using units and time windows only.
A three-learner tutorial can assign a source historian, maths interpreter and user-access reviewer. Rotate roles after introducing a changed weather condition or observation error. Each student should restate another’s important concern accurately before the group publishes a revised classroom explanation.
End with a successor-ready record: purpose, station or geographic area, observation and publication times, unit, method, forecast horizon if present, uncertainty, institutional source, vulnerable user needs and versioned corrections. A new learner should be able to reconstruct the conclusion without the original teacher present.
Four case-study cards
The misleading weather or climate headline
The claim begins: A news bulletin lists 60 millimetres of rainfall without specifying whether it fell in one hour, one day or one month. Write a more accurate title identifying the observed or predicted quantity, reference period, place and authority. Name a fact that remains unknown.
A strong answer returns to the mission mechanism: Rainfall depth is an accumulated measurement over a defined area representation and time. The same total distributed over an hour rather than a month can have very different implications; local impacts require professional hazard analysis. It should not inflate the fictional result into a real public warning. Instead it names the exact type of evidence, the limitations of the observation, and whether someone with another user need might interpret the same information differently.
For rain gauges, rainfall totals and accumulation windows, rotate three readers: the first checks WMO or UNDRR provenance and times, the second computes and interprets the numeric example, and the third examines accessible communication. Each child must paraphrase a peer’s objection and then write a succinct correction the next pupil could use without the teacher’s help.
What does the number actually measure?
Use this invented calculation: A paper town records 30 mm in the morning and 15 mm in the afternoon, or 45 mm during that day. This is a fictional accumulated total, not a flood prediction. Check the unit, denominator or accumulation period. Change an input and show what the new arithmetic does not establish.
A strong answer returns to the mission mechanism: Rainfall depth is an accumulated measurement over a defined area representation and time. The same total distributed over an hour rather than a month can have very different implications; local impacts require professional hazard analysis. It should not inflate the fictional result into a real public warning. Instead it names the exact type of evidence, the limitations of the observation, and whether someone with another user need might interpret the same information differently.
For rain gauges, rainfall totals and accumulation windows, rotate three readers: the first checks WMO or UNDRR provenance and times, the second computes and interprets the numeric example, and the third examines accessible communication. Each child must paraphrase a peer’s objection and then write a succinct correction the next pupil could use without the teacher’s help.
The original evidence changes
Rainbolt adds: Rainbolt changes the accumulation window from a day to an hour in one of the labels. Identify the first point in the observation or forecast chain where the old inference fails. Write a versioned correction and explain the correct source for a real public query.
A strong answer returns to the mission mechanism: Rainfall depth is an accumulated measurement over a defined area representation and time. The same total distributed over an hour rather than a month can have very different implications; local impacts require professional hazard analysis. It should not inflate the fictional result into a real public warning. Instead it names the exact type of evidence, the limitations of the observation, and whether someone with another user need might interpret the same information differently.
For rain gauges, rainfall totals and accumulation windows, rotate three readers: the first checks WMO or UNDRR provenance and times, the second computes and interprets the numeric example, and the third examines accessible communication. Each child must paraphrase a peer’s objection and then write a succinct correction the next pupil could use without the teacher’s help.
The user left out of the forecast
Wintour asks: Wintour asks for clear descriptions for commuters and residents without presenting an unsafe forecast. State a plausible accessibility or fairness concern and describe the type of authorised information that could improve the person’s understanding without issuing actual emergency instructions.
A strong answer returns to the mission mechanism: Rainfall depth is an accumulated measurement over a defined area representation and time. The same total distributed over an hour rather than a month can have very different implications; local impacts require professional hazard analysis. It should not inflate the fictional result into a real public warning. Instead it names the exact type of evidence, the limitations of the observation, and whether someone with another user need might interpret the same information differently.
For rain gauges, rainfall totals and accumulation windows, rotate three readers: the first checks WMO or UNDRR provenance and times, the second computes and interprets the numeric example, and the third examines accessible communication. Each child must paraphrase a peer’s objection and then write a succinct correction the next pupil could use without the teacher’s help.
Long-term transfer: A new learner understands rain gauges, rainfall totals and accumulation windows when they can identify the question, observation or modelling stage, source date, uncertainty, affected user and why the initial public claim was too broad.
Mission 05 — Pressure, wind, humidity and different atmospheric quantities
Skyhaven opens the lesson: Skyhaven’s poster adds relative humidity percentage to wind speed and says the sum measures storm strength.
The short, accurate explanation
Atmospheric measurements describe different quantities, including pressure, wind velocity and direction, relative humidity and precipitation. Their units cannot be added as though they were the same substance or a universal hazard index.
Start with the observable variable and the user’s actual question. Does the person want to know what happened at a station, what might happen tomorrow, how conditions differ from a climatological baseline, or what an authorised warning says? Those aims need different evidence, language and responsible institutions. A visually impressive weather dashboard is not enough.
The crucial distinction for pressure, wind, humidity and different atmospheric quantities is: Atmospheric measurements describe different quantities, including pressure, wind velocity and direction, relative humidity and precipitation. Their units cannot be added as though they were the same substance or a universal hazard index. Ask the learner to define which claim belongs to an observed fact, which is a model or interpretation, and which would need a legally authorised public warning. Misidentifying that role makes the communication unreliable even if the calculation appears neat.
Who observes, checks, forecasts and communicates?
A useful explanation traces the information chain: observation location, instrument or data stream, quality checks, international exchange when relevant, prediction or statistical analysis, and public communication. Each stage can fail independently. Record the original source and timestamp rather than pretending that a current phone display and an archived report are the same product.
International cooperation is a distinct civilisational capability. A local forecaster can benefit from marine buoys, satellite observations or upstream atmospheric data made available internationally. WMO’s GBON and WIS2 demonstrate institutional data exchange, not merely a collection of machines. The student should be able to identify a shared source’s limitations.
In the fictional case, Skyhaven’s poster adds relative humidity percentage to wind speed and says the sum measures storm strength. Map what the original observation can directly show and the later stages needed for public use. Where the source is a weather report, show its location and time. Where the source is climate research, show its baseline, aggregation method and source publication date. Avoid treating a sketch of a data flow as an actual operational network.
Evidence and how to avoid making a false claim
Source context matters for both evidence and ethics. WMO’s annual climate reports and observations are public scientific work; national warning agencies have specific legal responsibilities; an invented story is merely a teaching case. The child should know the difference and never imply a classroom forecast is official.
For this mission, one might consult WMO on pressure, wind, humidity and different atmospheric quantities. A WMO document defining weather and climate can explain general concepts, while WMO’s Global Basic Observing Network describes observational cooperation and the UNDRR report analyses multi-hazard warning systems. Each gives a different type of authoritative support. The pupil should cite the exact publication rather than the organisation’s name alone.
A conditional mathematics example
A fictional wind is 10 km/h at one time and 20 km/h later. The difference is 10 km/h; it cannot be added meaningfully to 70% humidity.
Weather and climate science uses physical quantities in defined units. A rainfall depth needs its accumulation window, temperature has place and observation conditions, a wind vector needs speed and direction, and forecast probability needs a clearly defined event and valid period. Mathematical literacy begins with the question the number is supposed to answer.
A statistic may be arithmetically correct yet socially misleading. Forecast errors from one day cannot define skill, a global surface-temperature anomaly is not a local reading, and a percentage of formatted warnings is not the share of people successfully protected. State numerator, denominator, location, time and the relevant outcome.
Now change exactly one paper assumption and compute again, stating the same relevant unit and period. The revised result can show how the model responds, but not a validated risk forecast, a climatological trend, or real forecast skill. If a hazard might be involved in real life, authorised current advice takes priority over the classroom calculation.
Rainbolt finds the assumption that fails
Rainbolt reveals the reported wind direction was described from the wrong reference.
Rainbolt introduces a changed condition: a station location changes, an observation is wrongly labelled, a model lead time shifts, data are duplicated, or a notice expires. The learner keeps the original claim in a version history and writes why the corrected statement is narrower or different. Corrections should be part of public trust.
The learner keeps both versions and labels the change: new observation, different reference, expired notice or revised model condition. A corrected public explanation should make the uncertain part visible and mention the proper authorised institution if a real decision would follow. A useful article does not merely replace one dramatic headline with another.
Wintour checks that a person can actually use the information
Wintour asks how people with limited scientific background can use accurate forecasts without misleading composite scores.
Wintour asks who could be excluded or harmed by the communication. A child walking to school, an older resident, a worker outdoors, a person with a disability, or someone with limited Internet access may face different information needs. A forecast is not meaningfully accessible if the intended user cannot obtain or understand it.
Recognise the boundary between learning and real operations. Children may draw weather charts and evaluate hypothetical messages but should not attempt to issue emergency alerts, calibrate professional instruments or make field predictions from the paper scenarios. Actual safety decisions belong to authorised meteorological and emergency professionals.
In a society, meteorological science supports work, schooling, transport, water services and general safety. Useful access depends on more than scientific accuracy: messages must match the question, arrive at a meaningful time and be understandable to the recipients. This does not authorise the class to tell real residents how to respond to hazards.
Family activity and a small-group tutorial
Sort units and quantities into separate columns before interpreting a headline.
A three-learner tutorial can assign a source historian, maths interpreter and user-access reviewer. Rotate roles after introducing a changed weather condition or observation error. Each student should restate another’s important concern accurately before the group publishes a revised classroom explanation.
End with a successor-ready record: purpose, station or geographic area, observation and publication times, unit, method, forecast horizon if present, uncertainty, institutional source, vulnerable user needs and versioned corrections. A new learner should be able to reconstruct the conclusion without the original teacher present.
Four case-study cards
The misleading weather or climate headline
The claim begins: Skyhaven’s poster adds relative humidity percentage to wind speed and says the sum measures storm strength. Write a more accurate title identifying the observed or predicted quantity, reference period, place and authority. Name a fact that remains unknown.
A strong answer returns to the mission mechanism: Atmospheric measurements describe different quantities, including pressure, wind velocity and direction, relative humidity and precipitation. Their units cannot be added as though they were the same substance or a universal hazard index. It should not inflate the fictional result into a real public warning. Instead it names the exact type of evidence, the limitations of the observation, and whether someone with another user need might interpret the same information differently.
For pressure, wind, humidity and different atmospheric quantities, rotate three readers: the first checks WMO or UNDRR provenance and times, the second computes and interprets the numeric example, and the third examines accessible communication. Each child must paraphrase a peer’s objection and then write a succinct correction the next pupil could use without the teacher’s help.
What does the number actually measure?
Use this invented calculation: A fictional wind is 10 km/h at one time and 20 km/h later. The difference is 10 km/h; it cannot be added meaningfully to 70% humidity. Check the unit, denominator or accumulation period. Change an input and show what the new arithmetic does not establish.
A strong answer returns to the mission mechanism: Atmospheric measurements describe different quantities, including pressure, wind velocity and direction, relative humidity and precipitation. Their units cannot be added as though they were the same substance or a universal hazard index. It should not inflate the fictional result into a real public warning. Instead it names the exact type of evidence, the limitations of the observation, and whether someone with another user need might interpret the same information differently.
For pressure, wind, humidity and different atmospheric quantities, rotate three readers: the first checks WMO or UNDRR provenance and times, the second computes and interprets the numeric example, and the third examines accessible communication. Each child must paraphrase a peer’s objection and then write a succinct correction the next pupil could use without the teacher’s help.
The original evidence changes
Rainbolt adds: Rainbolt reveals the reported wind direction was described from the wrong reference. Identify the first point in the observation or forecast chain where the old inference fails. Write a versioned correction and explain the correct source for a real public query.
A strong answer returns to the mission mechanism: Atmospheric measurements describe different quantities, including pressure, wind velocity and direction, relative humidity and precipitation. Their units cannot be added as though they were the same substance or a universal hazard index. It should not inflate the fictional result into a real public warning. Instead it names the exact type of evidence, the limitations of the observation, and whether someone with another user need might interpret the same information differently.
For pressure, wind, humidity and different atmospheric quantities, rotate three readers: the first checks WMO or UNDRR provenance and times, the second computes and interprets the numeric example, and the third examines accessible communication. Each child must paraphrase a peer’s objection and then write a succinct correction the next pupil could use without the teacher’s help.
The user left out of the forecast
Wintour asks: Wintour asks how people with limited scientific background can use accurate forecasts without misleading composite scores. State a plausible accessibility or fairness concern and describe the type of authorised information that could improve the person’s understanding without issuing actual emergency instructions.
A strong answer returns to the mission mechanism: Atmospheric measurements describe different quantities, including pressure, wind velocity and direction, relative humidity and precipitation. Their units cannot be added as though they were the same substance or a universal hazard index. It should not inflate the fictional result into a real public warning. Instead it names the exact type of evidence, the limitations of the observation, and whether someone with another user need might interpret the same information differently.
For pressure, wind, humidity and different atmospheric quantities, rotate three readers: the first checks WMO or UNDRR provenance and times, the second computes and interprets the numeric example, and the third examines accessible communication. Each child must paraphrase a peer’s objection and then write a succinct correction the next pupil could use without the teacher’s help.
Long-term transfer: A new learner understands pressure, wind, humidity and different atmospheric quantities when they can identify the question, observation or modelling stage, source date, uncertainty, affected user and why the initial public claim was too broad.
Mission 06 — Satellites and ground observations have complementary roles
Skyhaven opens the lesson: A town buys satellite imagery and declares ground stations unnecessary because the clouds are visible from orbit.
The short, accurate explanation
Satellites provide broad atmospheric and surface observations, while ground-based stations, balloons, buoys and aircraft measurements can contribute different information. Forecast systems need multiple data sources and appropriately managed international exchange.
Start with the observable variable and the user’s actual question. Does the person want to know what happened at a station, what might happen tomorrow, how conditions differ from a climatological baseline, or what an authorised warning says? Those aims need different evidence, language and responsible institutions. A visually impressive weather dashboard is not enough.
The crucial distinction for satellites and ground observations have complementary roles is: Satellites provide broad atmospheric and surface observations, while ground-based stations, balloons, buoys and aircraft measurements can contribute different information. Forecast systems need multiple data sources and appropriately managed international exchange. Ask the learner to define which claim belongs to an observed fact, which is a model or interpretation, and which would need a legally authorised public warning. Misidentifying that role makes the communication unreliable even if the calculation appears neat.
Who observes, checks, forecasts and communicates?
A useful explanation traces the information chain: observation location, instrument or data stream, quality checks, international exchange when relevant, prediction or statistical analysis, and public communication. Each stage can fail independently. Record the original source and timestamp rather than pretending that a current phone display and an archived report are the same product.
International cooperation is a distinct civilisational capability. A local forecaster can benefit from marine buoys, satellite observations or upstream atmospheric data made available internationally. WMO’s GBON and WIS2 demonstrate institutional data exchange, not merely a collection of machines. The student should be able to identify a shared source’s limitations.
In the fictional case, A town buys satellite imagery and declares ground stations unnecessary because the clouds are visible from orbit. Map what the original observation can directly show and the later stages needed for public use. Where the source is a weather report, show its location and time. Where the source is climate research, show its baseline, aggregation method and source publication date. Avoid treating a sketch of a data flow as an actual operational network.
Evidence and how to avoid making a false claim
Source context matters for both evidence and ethics. WMO’s annual climate reports and observations are public scientific work; national warning agencies have specific legal responsibilities; an invented story is merely a teaching case. The child should know the difference and never imply a classroom forecast is official.
For this mission, one might consult WMO on satellites and ground observations have complementary roles. A WMO document defining weather and climate can explain general concepts, while WMO’s Global Basic Observing Network describes observational cooperation and the UNDRR report analyses multi-hazard warning systems. Each gives a different type of authoritative support. The pupil should cite the exact publication rather than the organisation’s name alone.
A conditional mathematics example
A fictional observation system has eight satellite-derived reports and twelve station reports, totalling twenty records. Their count says nothing about information content or forecast skill.
Weather and climate science uses physical quantities in defined units. A rainfall depth needs its accumulation window, temperature has place and observation conditions, a wind vector needs speed and direction, and forecast probability needs a clearly defined event and valid period. Mathematical literacy begins with the question the number is supposed to answer.
A statistic may be arithmetically correct yet socially misleading. Forecast errors from one day cannot define skill, a global surface-temperature anomaly is not a local reading, and a percentage of formatted warnings is not the share of people successfully protected. State numerator, denominator, location, time and the relevant outcome.
Now change exactly one paper assumption and compute again, stating the same relevant unit and period. The revised result can show how the model responds, but not a validated risk forecast, a climatological trend, or real forecast skill. If a hazard might be involved in real life, authorised current advice takes priority over the classroom calculation.
Rainbolt finds the assumption that fails
Rainbolt finds that one data type was unavailable during a crucial period.
Rainbolt introduces a changed condition: a station location changes, an observation is wrongly labelled, a model lead time shifts, data are duplicated, or a notice expires. The learner keeps the original claim in a version history and writes why the corrected statement is narrower or different. Corrections should be part of public trust.
The learner keeps both versions and labels the change: new observation, different reference, expired notice or revised model condition. A corrected public explanation should make the uncertain part visible and mention the proper authorised institution if a real decision would follow. A useful article does not merely replace one dramatic headline with another.
Wintour checks that a person can actually use the information
Wintour asks how investments in observing networks serve remote communities fairly.
Wintour asks who could be excluded or harmed by the communication. A child walking to school, an older resident, a worker outdoors, a person with a disability, or someone with limited Internet access may face different information needs. A forecast is not meaningfully accessible if the intended user cannot obtain or understand it.
Recognise the boundary between learning and real operations. Children may draw weather charts and evaluate hypothetical messages but should not attempt to issue emergency alerts, calibrate professional instruments or make field predictions from the paper scenarios. Actual safety decisions belong to authorised meteorological and emergency professionals.
In a society, meteorological science supports work, schooling, transport, water services and general safety. Useful access depends on more than scientific accuracy: messages must match the question, arrive at a meaningful time and be understandable to the recipients. This does not authorise the class to tell real residents how to respond to hazards.
Family activity and a small-group tutorial
Make a paper data-source map distinguishing surface, upper-air, ocean and satellite roles.
A three-learner tutorial can assign a source historian, maths interpreter and user-access reviewer. Rotate roles after introducing a changed weather condition or observation error. Each student should restate another’s important concern accurately before the group publishes a revised classroom explanation.
End with a successor-ready record: purpose, station or geographic area, observation and publication times, unit, method, forecast horizon if present, uncertainty, institutional source, vulnerable user needs and versioned corrections. A new learner should be able to reconstruct the conclusion without the original teacher present.
Four case-study cards
The misleading weather or climate headline
The claim begins: A town buys satellite imagery and declares ground stations unnecessary because the clouds are visible from orbit. Write a more accurate title identifying the observed or predicted quantity, reference period, place and authority. Name a fact that remains unknown.
A strong answer returns to the mission mechanism: Satellites provide broad atmospheric and surface observations, while ground-based stations, balloons, buoys and aircraft measurements can contribute different information. Forecast systems need multiple data sources and appropriately managed international exchange. It should not inflate the fictional result into a real public warning. Instead it names the exact type of evidence, the limitations of the observation, and whether someone with another user need might interpret the same information differently.
For satellites and ground observations have complementary roles, rotate three readers: the first checks WMO or UNDRR provenance and times, the second computes and interprets the numeric example, and the third examines accessible communication. Each child must paraphrase a peer’s objection and then write a succinct correction the next pupil could use without the teacher’s help.
What does the number actually measure?
Use this invented calculation: A fictional observation system has eight satellite-derived reports and twelve station reports, totalling twenty records. Their count says nothing about information content or forecast skill. Check the unit, denominator or accumulation period. Change an input and show what the new arithmetic does not establish.
A strong answer returns to the mission mechanism: Satellites provide broad atmospheric and surface observations, while ground-based stations, balloons, buoys and aircraft measurements can contribute different information. Forecast systems need multiple data sources and appropriately managed international exchange. It should not inflate the fictional result into a real public warning. Instead it names the exact type of evidence, the limitations of the observation, and whether someone with another user need might interpret the same information differently.
For satellites and ground observations have complementary roles, rotate three readers: the first checks WMO or UNDRR provenance and times, the second computes and interprets the numeric example, and the third examines accessible communication. Each child must paraphrase a peer’s objection and then write a succinct correction the next pupil could use without the teacher’s help.
The original evidence changes
Rainbolt adds: Rainbolt finds that one data type was unavailable during a crucial period. Identify the first point in the observation or forecast chain where the old inference fails. Write a versioned correction and explain the correct source for a real public query.
A strong answer returns to the mission mechanism: Satellites provide broad atmospheric and surface observations, while ground-based stations, balloons, buoys and aircraft measurements can contribute different information. Forecast systems need multiple data sources and appropriately managed international exchange. It should not inflate the fictional result into a real public warning. Instead it names the exact type of evidence, the limitations of the observation, and whether someone with another user need might interpret the same information differently.
For satellites and ground observations have complementary roles, rotate three readers: the first checks WMO or UNDRR provenance and times, the second computes and interprets the numeric example, and the third examines accessible communication. Each child must paraphrase a peer’s objection and then write a succinct correction the next pupil could use without the teacher’s help.
The user left out of the forecast
Wintour asks: Wintour asks how investments in observing networks serve remote communities fairly. State a plausible accessibility or fairness concern and describe the type of authorised information that could improve the person’s understanding without issuing actual emergency instructions.
A strong answer returns to the mission mechanism: Satellites provide broad atmospheric and surface observations, while ground-based stations, balloons, buoys and aircraft measurements can contribute different information. Forecast systems need multiple data sources and appropriately managed international exchange. It should not inflate the fictional result into a real public warning. Instead it names the exact type of evidence, the limitations of the observation, and whether someone with another user need might interpret the same information differently.
For satellites and ground observations have complementary roles, rotate three readers: the first checks WMO or UNDRR provenance and times, the second computes and interprets the numeric example, and the third examines accessible communication. Each child must paraphrase a peer’s objection and then write a succinct correction the next pupil could use without the teacher’s help.
Long-term transfer: A new learner understands satellites and ground observations have complementary roles when they can identify the question, observation or modelling stage, source date, uncertainty, affected user and why the initial public claim was too broad.
Mission 07 — International data exchange and the WMO system
Skyhaven opens the lesson: Skyhaven’s meteorologists say a forecast can be reliable using only observations from within the town boundary.
The short, accurate explanation
Weather processes cross borders, and model initialisation benefits from observations collected far away. WMO’s GBON and WIS2 support the global sharing of suitable data through agreed standards and institutional cooperation.
Start with the observable variable and the user’s actual question. Does the person want to know what happened at a station, what might happen tomorrow, how conditions differ from a climatological baseline, or what an authorised warning says? Those aims need different evidence, language and responsible institutions. A visually impressive weather dashboard is not enough.
The crucial distinction for international data exchange and the wmo system is: Weather processes cross borders, and model initialisation benefits from observations collected far away. WMO’s GBON and WIS2 support the global sharing of suitable data through agreed standards and institutional cooperation. Ask the learner to define which claim belongs to an observed fact, which is a model or interpretation, and which would need a legally authorised public warning. Misidentifying that role makes the communication unreliable even if the calculation appears neat.
Who observes, checks, forecasts and communicates?
A useful explanation traces the information chain: observation location, instrument or data stream, quality checks, international exchange when relevant, prediction or statistical analysis, and public communication. Each stage can fail independently. Record the original source and timestamp rather than pretending that a current phone display and an archived report are the same product.
International cooperation is a distinct civilisational capability. A local forecaster can benefit from marine buoys, satellite observations or upstream atmospheric data made available internationally. WMO’s GBON and WIS2 demonstrate institutional data exchange, not merely a collection of machines. The student should be able to identify a shared source’s limitations.
In the fictional case, Skyhaven’s meteorologists say a forecast can be reliable using only observations from within the town boundary. Map what the original observation can directly show and the later stages needed for public use. Where the source is a weather report, show its location and time. Where the source is climate research, show its baseline, aggregation method and source publication date. Avoid treating a sketch of a data flow as an actual operational network.
Evidence and how to avoid making a false claim
Source context matters for both evidence and ethics. WMO’s annual climate reports and observations are public scientific work; national warning agencies have specific legal responsibilities; an invented story is merely a teaching case. The child should know the difference and never imply a classroom forecast is official.
For this mission, one might consult WMO on international data exchange and the wmo system. A WMO document defining weather and climate can explain general concepts, while WMO’s Global Basic Observing Network describes observational cooperation and the UNDRR report analyses multi-hazard warning systems. Each gives a different type of authoritative support. The pupil should cite the exact publication rather than the organisation’s name alone.
A conditional mathematics example
A toy network has five national nodes with four sending records to a shared archive. This 80% source participation is not evidence of forecast quality.
Weather and climate science uses physical quantities in defined units. A rainfall depth needs its accumulation window, temperature has place and observation conditions, a wind vector needs speed and direction, and forecast probability needs a clearly defined event and valid period. Mathematical literacy begins with the question the number is supposed to answer.
A statistic may be arithmetically correct yet socially misleading. Forecast errors from one day cannot define skill, a global surface-temperature anomaly is not a local reading, and a percentage of formatted warnings is not the share of people successfully protected. State numerator, denominator, location, time and the relevant outcome.
Now change exactly one paper assumption and compute again, stating the same relevant unit and period. The revised result can show how the model responds, but not a validated risk forecast, a climatological trend, or real forecast skill. If a hazard might be involved in real life, authorised current advice takes priority over the classroom calculation.
Rainbolt finds the assumption that fails
Rainbolt disconnects an upstream regional data link and changes which inputs are available.
Rainbolt introduces a changed condition: a station location changes, an observation is wrongly labelled, a model lead time shifts, data are duplicated, or a notice expires. The learner keeps the original claim in a version history and writes why the corrected statement is narrower or different. Corrections should be part of public trust.
The learner keeps both versions and labels the change: new observation, different reference, expired notice or revised model condition. A corrected public explanation should make the uncertain part visible and mention the proper authorised institution if a real decision would follow. A useful article does not merely replace one dramatic headline with another.
Wintour checks that a person can actually use the information
Wintour asks how smaller or resource-constrained countries gain meaningful access to the common observation system.
Wintour asks who could be excluded or harmed by the communication. A child walking to school, an older resident, a worker outdoors, a person with a disability, or someone with limited Internet access may face different information needs. A forecast is not meaningfully accessible if the intended user cannot obtain or understand it.
Recognise the boundary between learning and real operations. Children may draw weather charts and evaluate hypothetical messages but should not attempt to issue emergency alerts, calibrate professional instruments or make field predictions from the paper scenarios. Actual safety decisions belong to authorised meteorological and emergency professionals.
In a society, meteorological science supports work, schooling, transport, water services and general safety. Useful access depends on more than scientific accuracy: messages must match the question, arrive at a meaningful time and be understandable to the recipients. This does not authorise the class to tell real residents how to respond to hazards.
Family activity and a small-group tutorial
Draw paper observation and data-sharing arrows without accessing operational systems.
A three-learner tutorial can assign a source historian, maths interpreter and user-access reviewer. Rotate roles after introducing a changed weather condition or observation error. Each student should restate another’s important concern accurately before the group publishes a revised classroom explanation.
End with a successor-ready record: purpose, station or geographic area, observation and publication times, unit, method, forecast horizon if present, uncertainty, institutional source, vulnerable user needs and versioned corrections. A new learner should be able to reconstruct the conclusion without the original teacher present.
Four case-study cards
The misleading weather or climate headline
The claim begins: Skyhaven’s meteorologists say a forecast can be reliable using only observations from within the town boundary. Write a more accurate title identifying the observed or predicted quantity, reference period, place and authority. Name a fact that remains unknown.
A strong answer returns to the mission mechanism: Weather processes cross borders, and model initialisation benefits from observations collected far away. WMO’s GBON and WIS2 support the global sharing of suitable data through agreed standards and institutional cooperation. It should not inflate the fictional result into a real public warning. Instead it names the exact type of evidence, the limitations of the observation, and whether someone with another user need might interpret the same information differently.
For international data exchange and the wmo system, rotate three readers: the first checks WMO or UNDRR provenance and times, the second computes and interprets the numeric example, and the third examines accessible communication. Each child must paraphrase a peer’s objection and then write a succinct correction the next pupil could use without the teacher’s help.
What does the number actually measure?
Use this invented calculation: A toy network has five national nodes with four sending records to a shared archive. This 80% source participation is not evidence of forecast quality. Check the unit, denominator or accumulation period. Change an input and show what the new arithmetic does not establish.
A strong answer returns to the mission mechanism: Weather processes cross borders, and model initialisation benefits from observations collected far away. WMO’s GBON and WIS2 support the global sharing of suitable data through agreed standards and institutional cooperation. It should not inflate the fictional result into a real public warning. Instead it names the exact type of evidence, the limitations of the observation, and whether someone with another user need might interpret the same information differently.
For international data exchange and the wmo system, rotate three readers: the first checks WMO or UNDRR provenance and times, the second computes and interprets the numeric example, and the third examines accessible communication. Each child must paraphrase a peer’s objection and then write a succinct correction the next pupil could use without the teacher’s help.
The original evidence changes
Rainbolt adds: Rainbolt disconnects an upstream regional data link and changes which inputs are available. Identify the first point in the observation or forecast chain where the old inference fails. Write a versioned correction and explain the correct source for a real public query.
A strong answer returns to the mission mechanism: Weather processes cross borders, and model initialisation benefits from observations collected far away. WMO’s GBON and WIS2 support the global sharing of suitable data through agreed standards and institutional cooperation. It should not inflate the fictional result into a real public warning. Instead it names the exact type of evidence, the limitations of the observation, and whether someone with another user need might interpret the same information differently.
For international data exchange and the wmo system, rotate three readers: the first checks WMO or UNDRR provenance and times, the second computes and interprets the numeric example, and the third examines accessible communication. Each child must paraphrase a peer’s objection and then write a succinct correction the next pupil could use without the teacher’s help.
The user left out of the forecast
Wintour asks: Wintour asks how smaller or resource-constrained countries gain meaningful access to the common observation system. State a plausible accessibility or fairness concern and describe the type of authorised information that could improve the person’s understanding without issuing actual emergency instructions.
A strong answer returns to the mission mechanism: Weather processes cross borders, and model initialisation benefits from observations collected far away. WMO’s GBON and WIS2 support the global sharing of suitable data through agreed standards and institutional cooperation. It should not inflate the fictional result into a real public warning. Instead it names the exact type of evidence, the limitations of the observation, and whether someone with another user need might interpret the same information differently.
For international data exchange and the wmo system, rotate three readers: the first checks WMO or UNDRR provenance and times, the second computes and interprets the numeric example, and the third examines accessible communication. Each child must paraphrase a peer’s objection and then write a succinct correction the next pupil could use without the teacher’s help.
Long-term transfer: A new learner understands international data exchange and the wmo system when they can identify the question, observation or modelling stage, source date, uncertainty, affected user and why the initial public claim was too broad.
Mission 08 — Numerical forecasts and why they contain uncertainty
Skyhaven opens the lesson: An app lists a precise temperature three days from now, and its advertisement calls the figure a promised outcome.
The short, accurate explanation
Numerical weather prediction uses observations and models of physical processes to estimate possible future conditions. Initial conditions and model assumptions introduce uncertainty, which generally changes with lead time and weather situation. A forecast is not a contractual guarantee.
Start with the observable variable and the user’s actual question. Does the person want to know what happened at a station, what might happen tomorrow, how conditions differ from a climatological baseline, or what an authorised warning says? Those aims need different evidence, language and responsible institutions. A visually impressive weather dashboard is not enough.
The crucial distinction for numerical forecasts and why they contain uncertainty is: Numerical weather prediction uses observations and models of physical processes to estimate possible future conditions. Initial conditions and model assumptions introduce uncertainty, which generally changes with lead time and weather situation. A forecast is not a contractual guarantee. Ask the learner to define which claim belongs to an observed fact, which is a model or interpretation, and which would need a legally authorised public warning. Misidentifying that role makes the communication unreliable even if the calculation appears neat.
Who observes, checks, forecasts and communicates?
A useful explanation traces the information chain: observation location, instrument or data stream, quality checks, international exchange when relevant, prediction or statistical analysis, and public communication. Each stage can fail independently. Record the original source and timestamp rather than pretending that a current phone display and an archived report are the same product.
International cooperation is a distinct civilisational capability. A local forecaster can benefit from marine buoys, satellite observations or upstream atmospheric data made available internationally. WMO’s GBON and WIS2 demonstrate institutional data exchange, not merely a collection of machines. The student should be able to identify a shared source’s limitations.
In the fictional case, An app lists a precise temperature three days from now, and its advertisement calls the figure a promised outcome. Map what the original observation can directly show and the later stages needed for public use. Where the source is a weather report, show its location and time. Where the source is climate research, show its baseline, aggregation method and source publication date. Avoid treating a sketch of a data flow as an actual operational network.
Evidence and how to avoid making a false claim
Source context matters for both evidence and ethics. WMO’s annual climate reports and observations are public scientific work; national warning agencies have specific legal responsibilities; an invented story is merely a teaching case. The child should know the difference and never imply a classroom forecast is official.
For this mission, one might consult WMO on numerical forecasts and why they contain uncertainty. A WMO document defining weather and climate can explain general concepts, while WMO’s Global Basic Observing Network describes observational cooperation and the UNDRR report analyses multi-hazard warning systems. Each gives a different type of authoritative support. The pupil should cite the exact publication rather than the organisation’s name alone.
A conditional mathematics example
A toy forecast predicts 28 °C for a future day and the invented observed value is 30 °C. The two-degree difference is only one forecast-error example.
Weather and climate science uses physical quantities in defined units. A rainfall depth needs its accumulation window, temperature has place and observation conditions, a wind vector needs speed and direction, and forecast probability needs a clearly defined event and valid period. Mathematical literacy begins with the question the number is supposed to answer.
A statistic may be arithmetically correct yet socially misleading. Forecast errors from one day cannot define skill, a global surface-temperature anomaly is not a local reading, and a percentage of formatted warnings is not the share of people successfully protected. State numerator, denominator, location, time and the relevant outcome.
Now change exactly one paper assumption and compute again, stating the same relevant unit and period. The revised result can show how the model responds, but not a validated risk forecast, a climatological trend, or real forecast skill. If a hazard might be involved in real life, authorised current advice takes priority over the classroom calculation.
Rainbolt finds the assumption that fails
Rainbolt changes the lead time from one day to seven days without changing the presentation.
Rainbolt introduces a changed condition: a station location changes, an observation is wrongly labelled, a model lead time shifts, data are duplicated, or a notice expires. The learner keeps the original claim in a version history and writes why the corrected statement is narrower or different. Corrections should be part of public trust.
The learner keeps both versions and labels the change: new observation, different reference, expired notice or revised model condition. A corrected public explanation should make the uncertain part visible and mention the proper authorised institution if a real decision would follow. A useful article does not merely replace one dramatic headline with another.
Wintour checks that a person can actually use the information
Wintour asks how probability or uncertainty can be explained honestly to students and families.
Wintour asks who could be excluded or harmed by the communication. A child walking to school, an older resident, a worker outdoors, a person with a disability, or someone with limited Internet access may face different information needs. A forecast is not meaningfully accessible if the intended user cannot obtain or understand it.
Recognise the boundary between learning and real operations. Children may draw weather charts and evaluate hypothetical messages but should not attempt to issue emergency alerts, calibrate professional instruments or make field predictions from the paper scenarios. Actual safety decisions belong to authorised meteorological and emergency professionals.
In a society, meteorological science supports work, schooling, transport, water services and general safety. Useful access depends on more than scientific accuracy: messages must match the question, arrive at a meaningful time and be understandable to the recipients. This does not authorise the class to tell real residents how to respond to hazards.
Family activity and a small-group tutorial
Compare invented forecasts with dated observations without claiming a real forecast skill level.
A three-learner tutorial can assign a source historian, maths interpreter and user-access reviewer. Rotate roles after introducing a changed weather condition or observation error. Each student should restate another’s important concern accurately before the group publishes a revised classroom explanation.
End with a successor-ready record: purpose, station or geographic area, observation and publication times, unit, method, forecast horizon if present, uncertainty, institutional source, vulnerable user needs and versioned corrections. A new learner should be able to reconstruct the conclusion without the original teacher present.
Four case-study cards
The misleading weather or climate headline
The claim begins: An app lists a precise temperature three days from now, and its advertisement calls the figure a promised outcome. Write a more accurate title identifying the observed or predicted quantity, reference period, place and authority. Name a fact that remains unknown.
A strong answer returns to the mission mechanism: Numerical weather prediction uses observations and models of physical processes to estimate possible future conditions. Initial conditions and model assumptions introduce uncertainty, which generally changes with lead time and weather situation. A forecast is not a contractual guarantee. It should not inflate the fictional result into a real public warning. Instead it names the exact type of evidence, the limitations of the observation, and whether someone with another user need might interpret the same information differently.
For numerical forecasts and why they contain uncertainty, rotate three readers: the first checks WMO or UNDRR provenance and times, the second computes and interprets the numeric example, and the third examines accessible communication. Each child must paraphrase a peer’s objection and then write a succinct correction the next pupil could use without the teacher’s help.
What does the number actually measure?
Use this invented calculation: A toy forecast predicts 28 °C for a future day and the invented observed value is 30 °C. The two-degree difference is only one forecast-error example. Check the unit, denominator or accumulation period. Change an input and show what the new arithmetic does not establish.
A strong answer returns to the mission mechanism: Numerical weather prediction uses observations and models of physical processes to estimate possible future conditions. Initial conditions and model assumptions introduce uncertainty, which generally changes with lead time and weather situation. A forecast is not a contractual guarantee. It should not inflate the fictional result into a real public warning. Instead it names the exact type of evidence, the limitations of the observation, and whether someone with another user need might interpret the same information differently.
For numerical forecasts and why they contain uncertainty, rotate three readers: the first checks WMO or UNDRR provenance and times, the second computes and interprets the numeric example, and the third examines accessible communication. Each child must paraphrase a peer’s objection and then write a succinct correction the next pupil could use without the teacher’s help.
The original evidence changes
Rainbolt adds: Rainbolt changes the lead time from one day to seven days without changing the presentation. Identify the first point in the observation or forecast chain where the old inference fails. Write a versioned correction and explain the correct source for a real public query.
A strong answer returns to the mission mechanism: Numerical weather prediction uses observations and models of physical processes to estimate possible future conditions. Initial conditions and model assumptions introduce uncertainty, which generally changes with lead time and weather situation. A forecast is not a contractual guarantee. It should not inflate the fictional result into a real public warning. Instead it names the exact type of evidence, the limitations of the observation, and whether someone with another user need might interpret the same information differently.
For numerical forecasts and why they contain uncertainty, rotate three readers: the first checks WMO or UNDRR provenance and times, the second computes and interprets the numeric example, and the third examines accessible communication. Each child must paraphrase a peer’s objection and then write a succinct correction the next pupil could use without the teacher’s help.
The user left out of the forecast
Wintour asks: Wintour asks how probability or uncertainty can be explained honestly to students and families. State a plausible accessibility or fairness concern and describe the type of authorised information that could improve the person’s understanding without issuing actual emergency instructions.
A strong answer returns to the mission mechanism: Numerical weather prediction uses observations and models of physical processes to estimate possible future conditions. Initial conditions and model assumptions introduce uncertainty, which generally changes with lead time and weather situation. A forecast is not a contractual guarantee. It should not inflate the fictional result into a real public warning. Instead it names the exact type of evidence, the limitations of the observation, and whether someone with another user need might interpret the same information differently.
For numerical forecasts and why they contain uncertainty, rotate three readers: the first checks WMO or UNDRR provenance and times, the second computes and interprets the numeric example, and the third examines accessible communication. Each child must paraphrase a peer’s objection and then write a succinct correction the next pupil could use without the teacher’s help.
Long-term transfer: A new learner understands numerical forecasts and why they contain uncertainty when they can identify the question, observation or modelling stage, source date, uncertainty, affected user and why the initial public claim was too broad.
Mission 09 — Probability forecasts and the common 70% mistake
Skyhaven opens the lesson: Skyhaven announces a 70% probability of rain and tells every resident it will rain on precisely 70% of the town’s streets for 70% of the day.
The short, accurate explanation
A probability of precipitation has a specific forecasting definition, region, valid time and threshold in the product. It should not be casually equated with fraction of area, fraction of hours or certainty about one person’s journey.
Start with the observable variable and the user’s actual question. Does the person want to know what happened at a station, what might happen tomorrow, how conditions differ from a climatological baseline, or what an authorised warning says? Those aims need different evidence, language and responsible institutions. A visually impressive weather dashboard is not enough.
The crucial distinction for probability forecasts and the common 70% mistake is: A probability of precipitation has a specific forecasting definition, region, valid time and threshold in the product. It should not be casually equated with fraction of area, fraction of hours or certainty about one person’s journey. Ask the learner to define which claim belongs to an observed fact, which is a model or interpretation, and which would need a legally authorised public warning. Misidentifying that role makes the communication unreliable even if the calculation appears neat.
Who observes, checks, forecasts and communicates?
A useful explanation traces the information chain: observation location, instrument or data stream, quality checks, international exchange when relevant, prediction or statistical analysis, and public communication. Each stage can fail independently. Record the original source and timestamp rather than pretending that a current phone display and an archived report are the same product.
International cooperation is a distinct civilisational capability. A local forecaster can benefit from marine buoys, satellite observations or upstream atmospheric data made available internationally. WMO’s GBON and WIS2 demonstrate institutional data exchange, not merely a collection of machines. The student should be able to identify a shared source’s limitations.
In the fictional case, Skyhaven announces a 70% probability of rain and tells every resident it will rain on precisely 70% of the town’s streets for 70% of the day. Map what the original observation can directly show and the later stages needed for public use. Where the source is a weather report, show its location and time. Where the source is climate research, show its baseline, aggregation method and source publication date. Avoid treating a sketch of a data flow as an actual operational network.
Evidence and how to avoid making a false claim
Source context matters for both evidence and ethics. WMO’s annual climate reports and observations are public scientific work; national warning agencies have specific legal responsibilities; an invented story is merely a teaching case. The child should know the difference and never imply a classroom forecast is official.
For this mission, one might consult WMO on probability forecasts and the common 70% mistake. A WMO document defining weather and climate can explain general concepts, while WMO’s Global Basic Observing Network describes observational cooperation and the UNDRR report analyses multi-hazard warning systems. Each gives a different type of authoritative support. The pupil should cite the exact publication rather than the organisation’s name alone.
A conditional mathematics example
A toy forecast says seven successes among ten imagined comparable forecast cases. The 70% relative frequency is a classroom illustration, not a calibrated real weather probability.
Weather and climate science uses physical quantities in defined units. A rainfall depth needs its accumulation window, temperature has place and observation conditions, a wind vector needs speed and direction, and forecast probability needs a clearly defined event and valid period. Mathematical literacy begins with the question the number is supposed to answer.
A statistic may be arithmetically correct yet socially misleading. Forecast errors from one day cannot define skill, a global surface-temperature anomaly is not a local reading, and a percentage of formatted warnings is not the share of people successfully protected. State numerator, denominator, location, time and the relevant outcome.
Now change exactly one paper assumption and compute again, stating the same relevant unit and period. The revised result can show how the model responds, but not a validated risk forecast, a climatological trend, or real forecast skill. If a hazard might be involved in real life, authorised current advice takes priority over the classroom calculation.
Rainbolt finds the assumption that fails
Rainbolt discovers the forecast probability referred to a different region and valid period.
Rainbolt introduces a changed condition: a station location changes, an observation is wrongly labelled, a model lead time shifts, data are duplicated, or a notice expires. The learner keeps the original claim in a version history and writes why the corrected statement is narrower or different. Corrections should be part of public trust.
The learner keeps both versions and labels the change: new observation, different reference, expired notice or revised model condition. A corrected public explanation should make the uncertain part visible and mention the proper authorised institution if a real decision would follow. A useful article does not merely replace one dramatic headline with another.
Wintour checks that a person can actually use the information
Wintour considers different readers’ needs and why ordinary language should not falsely promise certainty.
Wintour asks who could be excluded or harmed by the communication. A child walking to school, an older resident, a worker outdoors, a person with a disability, or someone with limited Internet access may face different information needs. A forecast is not meaningfully accessible if the intended user cannot obtain or understand it.
Recognise the boundary between learning and real operations. Children may draw weather charts and evaluate hypothetical messages but should not attempt to issue emergency alerts, calibrate professional instruments or make field predictions from the paper scenarios. Actual safety decisions belong to authorised meteorological and emergency professionals.
In a society, meteorological science supports work, schooling, transport, water services and general safety. Useful access depends on more than scientific accuracy: messages must match the question, arrive at a meaningful time and be understandable to the recipients. This does not authorise the class to tell real residents how to respond to hazards.
Family activity and a small-group tutorial
Translate invented probabilistic notices while retaining location, time and event definition.
A three-learner tutorial can assign a source historian, maths interpreter and user-access reviewer. Rotate roles after introducing a changed weather condition or observation error. Each student should restate another’s important concern accurately before the group publishes a revised classroom explanation.
End with a successor-ready record: purpose, station or geographic area, observation and publication times, unit, method, forecast horizon if present, uncertainty, institutional source, vulnerable user needs and versioned corrections. A new learner should be able to reconstruct the conclusion without the original teacher present.
Four case-study cards
The misleading weather or climate headline
The claim begins: Skyhaven announces a 70% probability of rain and tells every resident it will rain on precisely 70% of the town’s streets for 70% of the day. Write a more accurate title identifying the observed or predicted quantity, reference period, place and authority. Name a fact that remains unknown.
A strong answer returns to the mission mechanism: A probability of precipitation has a specific forecasting definition, region, valid time and threshold in the product. It should not be casually equated with fraction of area, fraction of hours or certainty about one person’s journey. It should not inflate the fictional result into a real public warning. Instead it names the exact type of evidence, the limitations of the observation, and whether someone with another user need might interpret the same information differently.
For probability forecasts and the common 70% mistake, rotate three readers: the first checks WMO or UNDRR provenance and times, the second computes and interprets the numeric example, and the third examines accessible communication. Each child must paraphrase a peer’s objection and then write a succinct correction the next pupil could use without the teacher’s help.
What does the number actually measure?
Use this invented calculation: A toy forecast says seven successes among ten imagined comparable forecast cases. The 70% relative frequency is a classroom illustration, not a calibrated real weather probability. Check the unit, denominator or accumulation period. Change an input and show what the new arithmetic does not establish.
A strong answer returns to the mission mechanism: A probability of precipitation has a specific forecasting definition, region, valid time and threshold in the product. It should not be casually equated with fraction of area, fraction of hours or certainty about one person’s journey. It should not inflate the fictional result into a real public warning. Instead it names the exact type of evidence, the limitations of the observation, and whether someone with another user need might interpret the same information differently.
For probability forecasts and the common 70% mistake, rotate three readers: the first checks WMO or UNDRR provenance and times, the second computes and interprets the numeric example, and the third examines accessible communication. Each child must paraphrase a peer’s objection and then write a succinct correction the next pupil could use without the teacher’s help.
The original evidence changes
Rainbolt adds: Rainbolt discovers the forecast probability referred to a different region and valid period. Identify the first point in the observation or forecast chain where the old inference fails. Write a versioned correction and explain the correct source for a real public query.
A strong answer returns to the mission mechanism: A probability of precipitation has a specific forecasting definition, region, valid time and threshold in the product. It should not be casually equated with fraction of area, fraction of hours or certainty about one person’s journey. It should not inflate the fictional result into a real public warning. Instead it names the exact type of evidence, the limitations of the observation, and whether someone with another user need might interpret the same information differently.
For probability forecasts and the common 70% mistake, rotate three readers: the first checks WMO or UNDRR provenance and times, the second computes and interprets the numeric example, and the third examines accessible communication. Each child must paraphrase a peer’s objection and then write a succinct correction the next pupil could use without the teacher’s help.
The user left out of the forecast
Wintour asks: Wintour considers different readers’ needs and why ordinary language should not falsely promise certainty. State a plausible accessibility or fairness concern and describe the type of authorised information that could improve the person’s understanding without issuing actual emergency instructions.
A strong answer returns to the mission mechanism: A probability of precipitation has a specific forecasting definition, region, valid time and threshold in the product. It should not be casually equated with fraction of area, fraction of hours or certainty about one person’s journey. It should not inflate the fictional result into a real public warning. Instead it names the exact type of evidence, the limitations of the observation, and whether someone with another user need might interpret the same information differently.
For probability forecasts and the common 70% mistake, rotate three readers: the first checks WMO or UNDRR provenance and times, the second computes and interprets the numeric example, and the third examines accessible communication. Each child must paraphrase a peer’s objection and then write a succinct correction the next pupil could use without the teacher’s help.
Long-term transfer: A new learner understands probability forecasts and the common 70% mistake when they can identify the question, observation or modelling stage, source date, uncertainty, affected user and why the initial public claim was too broad.
Mission 10 — Heat alerts, rainfall warnings and official public authority
Skyhaven opens the lesson: A student shares a coloured storm icon online and calls it an evacuation order from the national weather service.
The short, accurate explanation
Hazard warnings are issued and communicated under the legitimate meteorological and emergency-management authorities of particular countries. Hazard forecasts, impact-based warnings and protective actions have different responsible actors; a social-media icon cannot grant authority.
Start with the observable variable and the user’s actual question. Does the person want to know what happened at a station, what might happen tomorrow, how conditions differ from a climatological baseline, or what an authorised warning says? Those aims need different evidence, language and responsible institutions. A visually impressive weather dashboard is not enough.
The crucial distinction for heat alerts, rainfall warnings and official public authority is: Hazard warnings are issued and communicated under the legitimate meteorological and emergency-management authorities of particular countries. Hazard forecasts, impact-based warnings and protective actions have different responsible actors; a social-media icon cannot grant authority. Ask the learner to define which claim belongs to an observed fact, which is a model or interpretation, and which would need a legally authorised public warning. Misidentifying that role makes the communication unreliable even if the calculation appears neat.
Who observes, checks, forecasts and communicates?
A useful explanation traces the information chain: observation location, instrument or data stream, quality checks, international exchange when relevant, prediction or statistical analysis, and public communication. Each stage can fail independently. Record the original source and timestamp rather than pretending that a current phone display and an archived report are the same product.
International cooperation is a distinct civilisational capability. A local forecaster can benefit from marine buoys, satellite observations or upstream atmospheric data made available internationally. WMO’s GBON and WIS2 demonstrate institutional data exchange, not merely a collection of machines. The student should be able to identify a shared source’s limitations.
In the fictional case, A student shares a coloured storm icon online and calls it an evacuation order from the national weather service. Map what the original observation can directly show and the later stages needed for public use. Where the source is a weather report, show its location and time. Where the source is climate research, show its baseline, aggregation method and source publication date. Avoid treating a sketch of a data flow as an actual operational network.
Evidence and how to avoid making a false claim
Source context matters for both evidence and ethics. WMO’s annual climate reports and observations are public scientific work; national warning agencies have specific legal responsibilities; an invented story is merely a teaching case. The child should know the difference and never imply a classroom forecast is official.
For this mission, one might consult WMO on heat alerts, rainfall warnings and official public authority. A WMO document defining weather and climate can explain general concepts, while WMO’s Global Basic Observing Network describes observational cooperation and the UNDRR report analyses multi-hazard warning systems. Each gives a different type of authoritative support. The pupil should cite the exact publication rather than the organisation’s name alone.
A conditional mathematics example
A fictional bulletin has twelve fields and ten include time, issuing office and affected area: 83.3% documentation, not an official warning-quality score.
Weather and climate science uses physical quantities in defined units. A rainfall depth needs its accumulation window, temperature has place and observation conditions, a wind vector needs speed and direction, and forecast probability needs a clearly defined event and valid period. Mathematical literacy begins with the question the number is supposed to answer.
A statistic may be arithmetically correct yet socially misleading. Forecast errors from one day cannot define skill, a global surface-temperature anomaly is not a local reading, and a percentage of formatted warnings is not the share of people successfully protected. State numerator, denominator, location, time and the relevant outcome.
Now change exactly one paper assumption and compute again, stating the same relevant unit and period. The revised result can show how the model responds, but not a validated risk forecast, a climatological trend, or real forecast skill. If a hazard might be involved in real life, authorised current advice takes priority over the classroom calculation.
Rainbolt finds the assumption that fails
Rainbolt identifies that the copied notice had expired the previous day.
Rainbolt introduces a changed condition: a station location changes, an observation is wrongly labelled, a model lead time shifts, data are duplicated, or a notice expires. The learner keeps the original claim in a version history and writes why the corrected statement is narrower or different. Corrections should be part of public trust.
The learner keeps both versions and labels the change: new observation, different reference, expired notice or revised model condition. A corrected public explanation should make the uncertain part visible and mention the proper authorised institution if a real decision would follow. A useful article does not merely replace one dramatic headline with another.
Wintour checks that a person can actually use the information
Wintour asks how the elderly, disabled users and people with different language needs receive official information.
Wintour asks who could be excluded or harmed by the communication. A child walking to school, an older resident, a worker outdoors, a person with a disability, or someone with limited Internet access may face different information needs. A forecast is not meaningfully accessible if the intended user cannot obtain or understand it.
Recognise the boundary between learning and real operations. Children may draw weather charts and evaluate hypothetical messages but should not attempt to issue emergency alerts, calibrate professional instruments or make field predictions from the paper scenarios. Actual safety decisions belong to authorised meteorological and emergency professionals.
In a society, meteorological science supports work, schooling, transport, water services and general safety. Useful access depends on more than scientific accuracy: messages must match the question, arrive at a meaningful time and be understandable to the recipients. This does not authorise the class to tell real residents how to respond to hazards.
Family activity and a small-group tutorial
Compare imaginary warning headers, never issue or forward fabricated real emergency directions.
A three-learner tutorial can assign a source historian, maths interpreter and user-access reviewer. Rotate roles after introducing a changed weather condition or observation error. Each student should restate another’s important concern accurately before the group publishes a revised classroom explanation.
End with a successor-ready record: purpose, station or geographic area, observation and publication times, unit, method, forecast horizon if present, uncertainty, institutional source, vulnerable user needs and versioned corrections. A new learner should be able to reconstruct the conclusion without the original teacher present.
Four case-study cards
The misleading weather or climate headline
The claim begins: A student shares a coloured storm icon online and calls it an evacuation order from the national weather service. Write a more accurate title identifying the observed or predicted quantity, reference period, place and authority. Name a fact that remains unknown.
A strong answer returns to the mission mechanism: Hazard warnings are issued and communicated under the legitimate meteorological and emergency-management authorities of particular countries. Hazard forecasts, impact-based warnings and protective actions have different responsible actors; a social-media icon cannot grant authority. It should not inflate the fictional result into a real public warning. Instead it names the exact type of evidence, the limitations of the observation, and whether someone with another user need might interpret the same information differently.
For heat alerts, rainfall warnings and official public authority, rotate three readers: the first checks WMO or UNDRR provenance and times, the second computes and interprets the numeric example, and the third examines accessible communication. Each child must paraphrase a peer’s objection and then write a succinct correction the next pupil could use without the teacher’s help.
What does the number actually measure?
Use this invented calculation: A fictional bulletin has twelve fields and ten include time, issuing office and affected area: 83.3% documentation, not an official warning-quality score. Check the unit, denominator or accumulation period. Change an input and show what the new arithmetic does not establish.
A strong answer returns to the mission mechanism: Hazard warnings are issued and communicated under the legitimate meteorological and emergency-management authorities of particular countries. Hazard forecasts, impact-based warnings and protective actions have different responsible actors; a social-media icon cannot grant authority. It should not inflate the fictional result into a real public warning. Instead it names the exact type of evidence, the limitations of the observation, and whether someone with another user need might interpret the same information differently.
For heat alerts, rainfall warnings and official public authority, rotate three readers: the first checks WMO or UNDRR provenance and times, the second computes and interprets the numeric example, and the third examines accessible communication. Each child must paraphrase a peer’s objection and then write a succinct correction the next pupil could use without the teacher’s help.
The original evidence changes
Rainbolt adds: Rainbolt identifies that the copied notice had expired the previous day. Identify the first point in the observation or forecast chain where the old inference fails. Write a versioned correction and explain the correct source for a real public query.
A strong answer returns to the mission mechanism: Hazard warnings are issued and communicated under the legitimate meteorological and emergency-management authorities of particular countries. Hazard forecasts, impact-based warnings and protective actions have different responsible actors; a social-media icon cannot grant authority. It should not inflate the fictional result into a real public warning. Instead it names the exact type of evidence, the limitations of the observation, and whether someone with another user need might interpret the same information differently.
For heat alerts, rainfall warnings and official public authority, rotate three readers: the first checks WMO or UNDRR provenance and times, the second computes and interprets the numeric example, and the third examines accessible communication. Each child must paraphrase a peer’s objection and then write a succinct correction the next pupil could use without the teacher’s help.
The user left out of the forecast
Wintour asks: Wintour asks how the elderly, disabled users and people with different language needs receive official information. State a plausible accessibility or fairness concern and describe the type of authorised information that could improve the person’s understanding without issuing actual emergency instructions.
A strong answer returns to the mission mechanism: Hazard warnings are issued and communicated under the legitimate meteorological and emergency-management authorities of particular countries. Hazard forecasts, impact-based warnings and protective actions have different responsible actors; a social-media icon cannot grant authority. It should not inflate the fictional result into a real public warning. Instead it names the exact type of evidence, the limitations of the observation, and whether someone with another user need might interpret the same information differently.
For heat alerts, rainfall warnings and official public authority, rotate three readers: the first checks WMO or UNDRR provenance and times, the second computes and interprets the numeric example, and the third examines accessible communication. Each child must paraphrase a peer’s objection and then write a succinct correction the next pupil could use without the teacher’s help.
Long-term transfer: A new learner understands heat alerts, rainfall warnings and official public authority when they can identify the question, observation or modelling stage, source date, uncertainty, affected user and why the initial public claim was too broad.
Mission 11 — Early warning means more than sensors and sirens
Skyhaven opens the lesson: Skyhaven’s brochure declares universal safety after installing four monitoring stations, ignoring communication and response institutions.
The short, accurate explanation
Multi-hazard early-warning systems include risk knowledge, monitoring and forecasting, warning dissemination and capacity to act, with governance across those stages. The 2025 UNDRR report noted 119 countries reporting systems, not universal coverage of every person.
Start with the observable variable and the user’s actual question. Does the person want to know what happened at a station, what might happen tomorrow, how conditions differ from a climatological baseline, or what an authorised warning says? Those aims need different evidence, language and responsible institutions. A visually impressive weather dashboard is not enough.
The crucial distinction for early warning means more than sensors and sirens is: Multi-hazard early-warning systems include risk knowledge, monitoring and forecasting, warning dissemination and capacity to act, with governance across those stages. The 2025 UNDRR report noted 119 countries reporting systems, not universal coverage of every person. Ask the learner to define which claim belongs to an observed fact, which is a model or interpretation, and which would need a legally authorised public warning. Misidentifying that role makes the communication unreliable even if the calculation appears neat.
Who observes, checks, forecasts and communicates?
A useful explanation traces the information chain: observation location, instrument or data stream, quality checks, international exchange when relevant, prediction or statistical analysis, and public communication. Each stage can fail independently. Record the original source and timestamp rather than pretending that a current phone display and an archived report are the same product.
International cooperation is a distinct civilisational capability. A local forecaster can benefit from marine buoys, satellite observations or upstream atmospheric data made available internationally. WMO’s GBON and WIS2 demonstrate institutional data exchange, not merely a collection of machines. The student should be able to identify a shared source’s limitations.
In the fictional case, Skyhaven’s brochure declares universal safety after installing four monitoring stations, ignoring communication and response institutions. Map what the original observation can directly show and the later stages needed for public use. Where the source is a weather report, show its location and time. Where the source is climate research, show its baseline, aggregation method and source publication date. Avoid treating a sketch of a data flow as an actual operational network.
Evidence and how to avoid making a false claim
Source context matters for both evidence and ethics. WMO’s annual climate reports and observations are public scientific work; national warning agencies have specific legal responsibilities; an invented story is merely a teaching case. The child should know the difference and never imply a classroom forecast is official.
For this mission, one might consult WMO on early warning means more than sensors and sirens. A WMO document defining weather and climate can explain general concepts, while WMO’s Global Basic Observing Network describes observational cooperation and the UNDRR report analyses multi-hazard warning systems. Each gives a different type of authoritative support. The pupil should cite the exact publication rather than the organisation’s name alone.
A conditional mathematics example
An invented framework checks four pillars and documents two. Fifty percent documentary coverage is not ‘half of citizens protected’.
Weather and climate science uses physical quantities in defined units. A rainfall depth needs its accumulation window, temperature has place and observation conditions, a wind vector needs speed and direction, and forecast probability needs a clearly defined event and valid period. Mathematical literacy begins with the question the number is supposed to answer.
A statistic may be arithmetically correct yet socially misleading. Forecast errors from one day cannot define skill, a global surface-temperature anomaly is not a local reading, and a percentage of formatted warnings is not the share of people successfully protected. State numerator, denominator, location, time and the relevant outcome.
Now change exactly one paper assumption and compute again, stating the same relevant unit and period. The revised result can show how the model responds, but not a validated risk forecast, a climatological trend, or real forecast skill. If a hazard might be involved in real life, authorised current advice takes priority over the classroom calculation.
Rainbolt finds the assumption that fails
Rainbolt reveals that no user-facing route exists for one at-risk district.
Rainbolt introduces a changed condition: a station location changes, an observation is wrongly labelled, a model lead time shifts, data are duplicated, or a notice expires. The learner keeps the original claim in a version history and writes why the corrected statement is narrower or different. Corrections should be part of public trust.
The learner keeps both versions and labels the change: new observation, different reference, expired notice or revised model condition. A corrected public explanation should make the uncertain part visible and mention the proper authorised institution if a real decision would follow. A useful article does not merely replace one dramatic headline with another.
Wintour checks that a person can actually use the information
Wintour asks whose information, trust and options are missing from the infrastructure plan.
Wintour asks who could be excluded or harmed by the communication. A child walking to school, an older resident, a worker outdoors, a person with a disability, or someone with limited Internet access may face different information needs. A forecast is not meaningfully accessible if the intended user cannot obtain or understand it.
Recognise the boundary between learning and real operations. Children may draw weather charts and evaluate hypothetical messages but should not attempt to issue emergency alerts, calibrate professional instruments or make field predictions from the paper scenarios. Actual safety decisions belong to authorised meteorological and emergency professionals.
In a society, meteorological science supports work, schooling, transport, water services and general safety. Useful access depends on more than scientific accuracy: messages must match the question, arrive at a meaningful time and be understandable to the recipients. This does not authorise the class to tell real residents how to respond to hazards.
Family activity and a small-group tutorial
Draw four labelled paper pillars and put ‘authorised service needed’ at operational handoffs.
A three-learner tutorial can assign a source historian, maths interpreter and user-access reviewer. Rotate roles after introducing a changed weather condition or observation error. Each student should restate another’s important concern accurately before the group publishes a revised classroom explanation.
End with a successor-ready record: purpose, station or geographic area, observation and publication times, unit, method, forecast horizon if present, uncertainty, institutional source, vulnerable user needs and versioned corrections. A new learner should be able to reconstruct the conclusion without the original teacher present.
Four case-study cards
The misleading weather or climate headline
The claim begins: Skyhaven’s brochure declares universal safety after installing four monitoring stations, ignoring communication and response institutions. Write a more accurate title identifying the observed or predicted quantity, reference period, place and authority. Name a fact that remains unknown.
A strong answer returns to the mission mechanism: Multi-hazard early-warning systems include risk knowledge, monitoring and forecasting, warning dissemination and capacity to act, with governance across those stages. The 2025 UNDRR report noted 119 countries reporting systems, not universal coverage of every person. It should not inflate the fictional result into a real public warning. Instead it names the exact type of evidence, the limitations of the observation, and whether someone with another user need might interpret the same information differently.
For early warning means more than sensors and sirens, rotate three readers: the first checks WMO or UNDRR provenance and times, the second computes and interprets the numeric example, and the third examines accessible communication. Each child must paraphrase a peer’s objection and then write a succinct correction the next pupil could use without the teacher’s help.
What does the number actually measure?
Use this invented calculation: An invented framework checks four pillars and documents two. Fifty percent documentary coverage is not ‘half of citizens protected’. Check the unit, denominator or accumulation period. Change an input and show what the new arithmetic does not establish.
A strong answer returns to the mission mechanism: Multi-hazard early-warning systems include risk knowledge, monitoring and forecasting, warning dissemination and capacity to act, with governance across those stages. The 2025 UNDRR report noted 119 countries reporting systems, not universal coverage of every person. It should not inflate the fictional result into a real public warning. Instead it names the exact type of evidence, the limitations of the observation, and whether someone with another user need might interpret the same information differently.
For early warning means more than sensors and sirens, rotate three readers: the first checks WMO or UNDRR provenance and times, the second computes and interprets the numeric example, and the third examines accessible communication. Each child must paraphrase a peer’s objection and then write a succinct correction the next pupil could use without the teacher’s help.
The original evidence changes
Rainbolt adds: Rainbolt reveals that no user-facing route exists for one at-risk district. Identify the first point in the observation or forecast chain where the old inference fails. Write a versioned correction and explain the correct source for a real public query.
A strong answer returns to the mission mechanism: Multi-hazard early-warning systems include risk knowledge, monitoring and forecasting, warning dissemination and capacity to act, with governance across those stages. The 2025 UNDRR report noted 119 countries reporting systems, not universal coverage of every person. It should not inflate the fictional result into a real public warning. Instead it names the exact type of evidence, the limitations of the observation, and whether someone with another user need might interpret the same information differently.
For early warning means more than sensors and sirens, rotate three readers: the first checks WMO or UNDRR provenance and times, the second computes and interprets the numeric example, and the third examines accessible communication. Each child must paraphrase a peer’s objection and then write a succinct correction the next pupil could use without the teacher’s help.
The user left out of the forecast
Wintour asks: Wintour asks whose information, trust and options are missing from the infrastructure plan. State a plausible accessibility or fairness concern and describe the type of authorised information that could improve the person’s understanding without issuing actual emergency instructions.
A strong answer returns to the mission mechanism: Multi-hazard early-warning systems include risk knowledge, monitoring and forecasting, warning dissemination and capacity to act, with governance across those stages. The 2025 UNDRR report noted 119 countries reporting systems, not universal coverage of every person. It should not inflate the fictional result into a real public warning. Instead it names the exact type of evidence, the limitations of the observation, and whether someone with another user need might interpret the same information differently.
For early warning means more than sensors and sirens, rotate three readers: the first checks WMO or UNDRR provenance and times, the second computes and interprets the numeric example, and the third examines accessible communication. Each child must paraphrase a peer’s objection and then write a succinct correction the next pupil could use without the teacher’s help.
Long-term transfer: A new learner understands early warning means more than sensors and sirens when they can identify the question, observation or modelling stage, source date, uncertainty, affected user and why the initial public claim was too broad.
Mission 12 — Climate normals, anomalies and reference periods
Skyhaven opens the lesson: A classroom graph compares an observation to an unnamed ‘normal’ and announces a precise global warming figure.
The short, accurate explanation
Climate anomalies compare observations with a stated baseline period; the baseline and spatial average must be shown. WMO’s 2025 global report compares an annual global estimate with 1850–1900, which is different from a local daily anomaly.
Start with the observable variable and the user’s actual question. Does the person want to know what happened at a station, what might happen tomorrow, how conditions differ from a climatological baseline, or what an authorised warning says? Those aims need different evidence, language and responsible institutions. A visually impressive weather dashboard is not enough.
The crucial distinction for climate normals, anomalies and reference periods is: Climate anomalies compare observations with a stated baseline period; the baseline and spatial average must be shown. WMO’s 2025 global report compares an annual global estimate with 1850–1900, which is different from a local daily anomaly. Ask the learner to define which claim belongs to an observed fact, which is a model or interpretation, and which would need a legally authorised public warning. Misidentifying that role makes the communication unreliable even if the calculation appears neat.
Who observes, checks, forecasts and communicates?
A useful explanation traces the information chain: observation location, instrument or data stream, quality checks, international exchange when relevant, prediction or statistical analysis, and public communication. Each stage can fail independently. Record the original source and timestamp rather than pretending that a current phone display and an archived report are the same product.
International cooperation is a distinct civilisational capability. A local forecaster can benefit from marine buoys, satellite observations or upstream atmospheric data made available internationally. WMO’s GBON and WIS2 demonstrate institutional data exchange, not merely a collection of machines. The student should be able to identify a shared source’s limitations.
In the fictional case, A classroom graph compares an observation to an unnamed ‘normal’ and announces a precise global warming figure. Map what the original observation can directly show and the later stages needed for public use. Where the source is a weather report, show its location and time. Where the source is climate research, show its baseline, aggregation method and source publication date. Avoid treating a sketch of a data flow as an actual operational network.
Evidence and how to avoid making a false claim
Source context matters for both evidence and ethics. WMO’s annual climate reports and observations are public scientific work; national warning agencies have specific legal responsibilities; an invented story is merely a teaching case. The child should know the difference and never imply a classroom forecast is official.
For this mission, one might consult WMO on climate normals, anomalies and reference periods. A WMO document defining weather and climate can explain general concepts, while WMO’s Global Basic Observing Network describes observational cooperation and the UNDRR report analyses multi-hazard warning systems. Each gives a different type of authoritative support. The pupil should cite the exact publication rather than the organisation’s name alone.
A conditional mathematics example
A fictional month’s mean temperature is 28 °C and its local toy normal is 27 °C. The anomaly is plus one degree for that station and period, not a global climate finding.
Weather and climate science uses physical quantities in defined units. A rainfall depth needs its accumulation window, temperature has place and observation conditions, a wind vector needs speed and direction, and forecast probability needs a clearly defined event and valid period. Mathematical literacy begins with the question the number is supposed to answer.
A statistic may be arithmetically correct yet socially misleading. Forecast errors from one day cannot define skill, a global surface-temperature anomaly is not a local reading, and a percentage of formatted warnings is not the share of people successfully protected. State numerator, denominator, location, time and the relevant outcome.
Now change exactly one paper assumption and compute again, stating the same relevant unit and period. The revised result can show how the model responds, but not a validated risk forecast, a climatological trend, or real forecast skill. If a hazard might be involved in real life, authorised current advice takes priority over the classroom calculation.
Rainbolt finds the assumption that fails
Rainbolt changes the baseline normal and the anomaly changes even though the observation stays 28 °C.
Rainbolt introduces a changed condition: a station location changes, an observation is wrongly labelled, a model lead time shifts, data are duplicated, or a notice expires. The learner keeps the original claim in a version history and writes why the corrected statement is narrower or different. Corrections should be part of public trust.
The learner keeps both versions and labels the change: new observation, different reference, expired notice or revised model condition. A corrected public explanation should make the uncertain part visible and mention the proper authorised institution if a real decision would follow. A useful article does not merely replace one dramatic headline with another.
Wintour checks that a person can actually use the information
Wintour asks how the public can avoid confusing local experiences and global indicators.
Wintour asks who could be excluded or harmed by the communication. A child walking to school, an older resident, a worker outdoors, a person with a disability, or someone with limited Internet access may face different information needs. A forecast is not meaningfully accessible if the intended user cannot obtain or understand it.
Recognise the boundary between learning and real operations. Children may draw weather charts and evaluate hypothetical messages but should not attempt to issue emergency alerts, calibrate professional instruments or make field predictions from the paper scenarios. Actual safety decisions belong to authorised meteorological and emergency professionals.
In a society, meteorological science supports work, schooling, transport, water services and general safety. Useful access depends on more than scientific accuracy: messages must match the question, arrive at a meaningful time and be understandable to the recipients. This does not authorise the class to tell real residents how to respond to hazards.
Family activity and a small-group tutorial
Create a paper climate normal and anomaly chart with reference period printed prominently.
A three-learner tutorial can assign a source historian, maths interpreter and user-access reviewer. Rotate roles after introducing a changed weather condition or observation error. Each student should restate another’s important concern accurately before the group publishes a revised classroom explanation.
End with a successor-ready record: purpose, station or geographic area, observation and publication times, unit, method, forecast horizon if present, uncertainty, institutional source, vulnerable user needs and versioned corrections. A new learner should be able to reconstruct the conclusion without the original teacher present.
Four case-study cards
The misleading weather or climate headline
The claim begins: A classroom graph compares an observation to an unnamed ‘normal’ and announces a precise global warming figure. Write a more accurate title identifying the observed or predicted quantity, reference period, place and authority. Name a fact that remains unknown.
A strong answer returns to the mission mechanism: Climate anomalies compare observations with a stated baseline period; the baseline and spatial average must be shown. WMO’s 2025 global report compares an annual global estimate with 1850–1900, which is different from a local daily anomaly. It should not inflate the fictional result into a real public warning. Instead it names the exact type of evidence, the limitations of the observation, and whether someone with another user need might interpret the same information differently.
For climate normals, anomalies and reference periods, rotate three readers: the first checks WMO or UNDRR provenance and times, the second computes and interprets the numeric example, and the third examines accessible communication. Each child must paraphrase a peer’s objection and then write a succinct correction the next pupil could use without the teacher’s help.
What does the number actually measure?
Use this invented calculation: A fictional month’s mean temperature is 28 °C and its local toy normal is 27 °C. The anomaly is plus one degree for that station and period, not a global climate finding. Check the unit, denominator or accumulation period. Change an input and show what the new arithmetic does not establish.
A strong answer returns to the mission mechanism: Climate anomalies compare observations with a stated baseline period; the baseline and spatial average must be shown. WMO’s 2025 global report compares an annual global estimate with 1850–1900, which is different from a local daily anomaly. It should not inflate the fictional result into a real public warning. Instead it names the exact type of evidence, the limitations of the observation, and whether someone with another user need might interpret the same information differently.
For climate normals, anomalies and reference periods, rotate three readers: the first checks WMO or UNDRR provenance and times, the second computes and interprets the numeric example, and the third examines accessible communication. Each child must paraphrase a peer’s objection and then write a succinct correction the next pupil could use without the teacher’s help.
The original evidence changes
Rainbolt adds: Rainbolt changes the baseline normal and the anomaly changes even though the observation stays 28 °C. Identify the first point in the observation or forecast chain where the old inference fails. Write a versioned correction and explain the correct source for a real public query.
A strong answer returns to the mission mechanism: Climate anomalies compare observations with a stated baseline period; the baseline and spatial average must be shown. WMO’s 2025 global report compares an annual global estimate with 1850–1900, which is different from a local daily anomaly. It should not inflate the fictional result into a real public warning. Instead it names the exact type of evidence, the limitations of the observation, and whether someone with another user need might interpret the same information differently.
For climate normals, anomalies and reference periods, rotate three readers: the first checks WMO or UNDRR provenance and times, the second computes and interprets the numeric example, and the third examines accessible communication. Each child must paraphrase a peer’s objection and then write a succinct correction the next pupil could use without the teacher’s help.
The user left out of the forecast
Wintour asks: Wintour asks how the public can avoid confusing local experiences and global indicators. State a plausible accessibility or fairness concern and describe the type of authorised information that could improve the person’s understanding without issuing actual emergency instructions.
A strong answer returns to the mission mechanism: Climate anomalies compare observations with a stated baseline period; the baseline and spatial average must be shown. WMO’s 2025 global report compares an annual global estimate with 1850–1900, which is different from a local daily anomaly. It should not inflate the fictional result into a real public warning. Instead it names the exact type of evidence, the limitations of the observation, and whether someone with another user need might interpret the same information differently.
For climate normals, anomalies and reference periods, rotate three readers: the first checks WMO or UNDRR provenance and times, the second computes and interprets the numeric example, and the third examines accessible communication. Each child must paraphrase a peer’s objection and then write a succinct correction the next pupil could use without the teacher’s help.
Long-term transfer: A new learner understands climate normals, anomalies and reference periods when they can identify the question, observation or modelling stage, source date, uncertainty, affected user and why the initial public claim was too broad.
Mission 13 — Ocean, polar and remote observations
Skyhaven opens the lesson: Skyhaven’s model of global climate uses only its city weather station and declares remote ocean and ice measurements irrelevant.
The short, accurate explanation
Climate and weather observing systems include ocean heat, sea level, sea ice, glaciers, atmospheric composition and many other variables, assembled by qualified institutions. WMO’s 2026 observing guidance addresses atmospheric, oceanic and cryospheric needs.
Start with the observable variable and the user’s actual question. Does the person want to know what happened at a station, what might happen tomorrow, how conditions differ from a climatological baseline, or what an authorised warning says? Those aims need different evidence, language and responsible institutions. A visually impressive weather dashboard is not enough.
The crucial distinction for ocean, polar and remote observations is: Climate and weather observing systems include ocean heat, sea level, sea ice, glaciers, atmospheric composition and many other variables, assembled by qualified institutions. WMO’s 2026 observing guidance addresses atmospheric, oceanic and cryospheric needs. Ask the learner to define which claim belongs to an observed fact, which is a model or interpretation, and which would need a legally authorised public warning. Misidentifying that role makes the communication unreliable even if the calculation appears neat.
Who observes, checks, forecasts and communicates?
A useful explanation traces the information chain: observation location, instrument or data stream, quality checks, international exchange when relevant, prediction or statistical analysis, and public communication. Each stage can fail independently. Record the original source and timestamp rather than pretending that a current phone display and an archived report are the same product.
International cooperation is a distinct civilisational capability. A local forecaster can benefit from marine buoys, satellite observations or upstream atmospheric data made available internationally. WMO’s GBON and WIS2 demonstrate institutional data exchange, not merely a collection of machines. The student should be able to identify a shared source’s limitations.
In the fictional case, Skyhaven’s model of global climate uses only its city weather station and declares remote ocean and ice measurements irrelevant. Map what the original observation can directly show and the later stages needed for public use. Where the source is a weather report, show its location and time. Where the source is climate research, show its baseline, aggregation method and source publication date. Avoid treating a sketch of a data flow as an actual operational network.
Evidence and how to avoid making a false claim
Source context matters for both evidence and ethics. WMO’s annual climate reports and observations are public scientific work; national warning agencies have specific legal responsibilities; an invented story is merely a teaching case. The child should know the difference and never imply a classroom forecast is official.
For this mission, one might consult WMO on ocean, polar and remote observations. A WMO document defining weather and climate can explain general concepts, while WMO’s Global Basic Observing Network describes observational cooperation and the UNDRR report analyses multi-hazard warning systems. Each gives a different type of authoritative support. The pupil should cite the exact publication rather than the organisation’s name alone.
A conditional mathematics example
A fictional monitoring pack includes four land sources, two marine and one polar. Their count is not the area represented or data quality.
Weather and climate science uses physical quantities in defined units. A rainfall depth needs its accumulation window, temperature has place and observation conditions, a wind vector needs speed and direction, and forecast probability needs a clearly defined event and valid period. Mathematical literacy begins with the question the number is supposed to answer.
A statistic may be arithmetically correct yet socially misleading. Forecast errors from one day cannot define skill, a global surface-temperature anomaly is not a local reading, and a percentage of formatted warnings is not the share of people successfully protected. State numerator, denominator, location, time and the relevant outcome.
Now change exactly one paper assumption and compute again, stating the same relevant unit and period. The revised result can show how the model responds, but not a validated risk forecast, a climatological trend, or real forecast skill. If a hazard might be involved in real life, authorised current advice takes priority over the classroom calculation.
Rainbolt finds the assumption that fails
Rainbolt discovers one source uses a different reference period and cannot be graphed as a comparable point.
Rainbolt introduces a changed condition: a station location changes, an observation is wrongly labelled, a model lead time shifts, data are duplicated, or a notice expires. The learner keeps the original claim in a version history and writes why the corrected statement is narrower or different. Corrections should be part of public trust.
The learner keeps both versions and labels the change: new observation, different reference, expired notice or revised model condition. A corrected public explanation should make the uncertain part visible and mention the proper authorised institution if a real decision would follow. A useful article does not merely replace one dramatic headline with another.
Wintour checks that a person can actually use the information
Wintour asks how people living far from capital cities are considered in observation and climate services.
Wintour asks who could be excluded or harmed by the communication. A child walking to school, an older resident, a worker outdoors, a person with a disability, or someone with limited Internet access may face different information needs. A forecast is not meaningfully accessible if the intended user cannot obtain or understand it.
Recognise the boundary between learning and real operations. Children may draw weather charts and evaluate hypothetical messages but should not attempt to issue emergency alerts, calibrate professional instruments or make field predictions from the paper scenarios. Actual safety decisions belong to authorised meteorological and emergency professionals.
In a society, meteorological science supports work, schooling, transport, water services and general safety. Useful access depends on more than scientific accuracy: messages must match the question, arrive at a meaningful time and be understandable to the recipients. This does not authorise the class to tell real residents how to respond to hazards.
Family activity and a small-group tutorial
Classify official source types on paper without accessing remote field sites.
A three-learner tutorial can assign a source historian, maths interpreter and user-access reviewer. Rotate roles after introducing a changed weather condition or observation error. Each student should restate another’s important concern accurately before the group publishes a revised classroom explanation.
End with a successor-ready record: purpose, station or geographic area, observation and publication times, unit, method, forecast horizon if present, uncertainty, institutional source, vulnerable user needs and versioned corrections. A new learner should be able to reconstruct the conclusion without the original teacher present.
Four case-study cards
The misleading weather or climate headline
The claim begins: Skyhaven’s model of global climate uses only its city weather station and declares remote ocean and ice measurements irrelevant. Write a more accurate title identifying the observed or predicted quantity, reference period, place and authority. Name a fact that remains unknown.
A strong answer returns to the mission mechanism: Climate and weather observing systems include ocean heat, sea level, sea ice, glaciers, atmospheric composition and many other variables, assembled by qualified institutions. WMO’s 2026 observing guidance addresses atmospheric, oceanic and cryospheric needs. It should not inflate the fictional result into a real public warning. Instead it names the exact type of evidence, the limitations of the observation, and whether someone with another user need might interpret the same information differently.
For ocean, polar and remote observations, rotate three readers: the first checks WMO or UNDRR provenance and times, the second computes and interprets the numeric example, and the third examines accessible communication. Each child must paraphrase a peer’s objection and then write a succinct correction the next pupil could use without the teacher’s help.
What does the number actually measure?
Use this invented calculation: A fictional monitoring pack includes four land sources, two marine and one polar. Their count is not the area represented or data quality. Check the unit, denominator or accumulation period. Change an input and show what the new arithmetic does not establish.
A strong answer returns to the mission mechanism: Climate and weather observing systems include ocean heat, sea level, sea ice, glaciers, atmospheric composition and many other variables, assembled by qualified institutions. WMO’s 2026 observing guidance addresses atmospheric, oceanic and cryospheric needs. It should not inflate the fictional result into a real public warning. Instead it names the exact type of evidence, the limitations of the observation, and whether someone with another user need might interpret the same information differently.
For ocean, polar and remote observations, rotate three readers: the first checks WMO or UNDRR provenance and times, the second computes and interprets the numeric example, and the third examines accessible communication. Each child must paraphrase a peer’s objection and then write a succinct correction the next pupil could use without the teacher’s help.
The original evidence changes
Rainbolt adds: Rainbolt discovers one source uses a different reference period and cannot be graphed as a comparable point. Identify the first point in the observation or forecast chain where the old inference fails. Write a versioned correction and explain the correct source for a real public query.
A strong answer returns to the mission mechanism: Climate and weather observing systems include ocean heat, sea level, sea ice, glaciers, atmospheric composition and many other variables, assembled by qualified institutions. WMO’s 2026 observing guidance addresses atmospheric, oceanic and cryospheric needs. It should not inflate the fictional result into a real public warning. Instead it names the exact type of evidence, the limitations of the observation, and whether someone with another user need might interpret the same information differently.
For ocean, polar and remote observations, rotate three readers: the first checks WMO or UNDRR provenance and times, the second computes and interprets the numeric example, and the third examines accessible communication. Each child must paraphrase a peer’s objection and then write a succinct correction the next pupil could use without the teacher’s help.
The user left out of the forecast
Wintour asks: Wintour asks how people living far from capital cities are considered in observation and climate services. State a plausible accessibility or fairness concern and describe the type of authorised information that could improve the person’s understanding without issuing actual emergency instructions.
A strong answer returns to the mission mechanism: Climate and weather observing systems include ocean heat, sea level, sea ice, glaciers, atmospheric composition and many other variables, assembled by qualified institutions. WMO’s 2026 observing guidance addresses atmospheric, oceanic and cryospheric needs. It should not inflate the fictional result into a real public warning. Instead it names the exact type of evidence, the limitations of the observation, and whether someone with another user need might interpret the same information differently.
For ocean, polar and remote observations, rotate three readers: the first checks WMO or UNDRR provenance and times, the second computes and interprets the numeric example, and the third examines accessible communication. Each child must paraphrase a peer’s objection and then write a succinct correction the next pupil could use without the teacher’s help.
Long-term transfer: A new learner understands ocean, polar and remote observations when they can identify the question, observation or modelling stage, source date, uncertainty, affected user and why the initial public claim was too broad.
Mission 14 — Forecast communication, accessibility and trust
Skyhaven opens the lesson: Skyhaven publishes the best forecast in technical jargon on a site its older residents cannot read and calls the service effective for everyone.
The short, accurate explanation
Information becomes useful when recipients can find timely, understandable and accessible products from authoritative services. Technical quality, dissemination and comprehension are distinct measures; communications must avoid both panic and false reassurance.
Start with the observable variable and the user’s actual question. Does the person want to know what happened at a station, what might happen tomorrow, how conditions differ from a climatological baseline, or what an authorised warning says? Those aims need different evidence, language and responsible institutions. A visually impressive weather dashboard is not enough.
The crucial distinction for forecast communication, accessibility and trust is: Information becomes useful when recipients can find timely, understandable and accessible products from authoritative services. Technical quality, dissemination and comprehension are distinct measures; communications must avoid both panic and false reassurance. Ask the learner to define which claim belongs to an observed fact, which is a model or interpretation, and which would need a legally authorised public warning. Misidentifying that role makes the communication unreliable even if the calculation appears neat.
Who observes, checks, forecasts and communicates?
A useful explanation traces the information chain: observation location, instrument or data stream, quality checks, international exchange when relevant, prediction or statistical analysis, and public communication. Each stage can fail independently. Record the original source and timestamp rather than pretending that a current phone display and an archived report are the same product.
International cooperation is a distinct civilisational capability. A local forecaster can benefit from marine buoys, satellite observations or upstream atmospheric data made available internationally. WMO’s GBON and WIS2 demonstrate institutional data exchange, not merely a collection of machines. The student should be able to identify a shared source’s limitations.
In the fictional case, Skyhaven publishes the best forecast in technical jargon on a site its older residents cannot read and calls the service effective for everyone. Map what the original observation can directly show and the later stages needed for public use. Where the source is a weather report, show its location and time. Where the source is climate research, show its baseline, aggregation method and source publication date. Avoid treating a sketch of a data flow as an actual operational network.
Evidence and how to avoid making a false claim
Source context matters for both evidence and ethics. WMO’s annual climate reports and observations are public scientific work; national warning agencies have specific legal responsibilities; an invented story is merely a teaching case. The child should know the difference and never imply a classroom forecast is official.
For this mission, one might consult WMO on forecast communication, accessibility and trust. A WMO document defining weather and climate can explain general concepts, while WMO’s Global Basic Observing Network describes observational cooperation and the UNDRR report analyses multi-hazard warning systems. Each gives a different type of authoritative support. The pupil should cite the exact publication rather than the organisation’s name alone.
A conditional mathematics example
A fictional survey reaches 100 people but only 60 understand a defined notice. This 60% toy response is not a universal comprehension rate.
Weather and climate science uses physical quantities in defined units. A rainfall depth needs its accumulation window, temperature has place and observation conditions, a wind vector needs speed and direction, and forecast probability needs a clearly defined event and valid period. Mathematical literacy begins with the question the number is supposed to answer.
A statistic may be arithmetically correct yet socially misleading. Forecast errors from one day cannot define skill, a global surface-temperature anomaly is not a local reading, and a percentage of formatted warnings is not the share of people successfully protected. State numerator, denominator, location, time and the relevant outcome.
Now change exactly one paper assumption and compute again, stating the same relevant unit and period. The revised result can show how the model responds, but not a validated risk forecast, a climatological trend, or real forecast skill. If a hazard might be involved in real life, authorised current advice takes priority over the classroom calculation.
Rainbolt finds the assumption that fails
Rainbolt finds the message was written in a language many intended readers did not use.
Rainbolt introduces a changed condition: a station location changes, an observation is wrongly labelled, a model lead time shifts, data are duplicated, or a notice expires. The learner keeps the original claim in a version history and writes why the corrected statement is narrower or different. Corrections should be part of public trust.
The learner keeps both versions and labels the change: new observation, different reference, expired notice or revised model condition. A corrected public explanation should make the uncertain part visible and mention the proper authorised institution if a real decision would follow. A useful article does not merely replace one dramatic headline with another.
Wintour checks that a person can actually use the information
Wintour considers language, disability, cost, digital access and fair public communication.
Wintour asks who could be excluded or harmed by the communication. A child walking to school, an older resident, a worker outdoors, a person with a disability, or someone with limited Internet access may face different information needs. A forecast is not meaningfully accessible if the intended user cannot obtain or understand it.
Recognise the boundary between learning and real operations. Children may draw weather charts and evaluate hypothetical messages but should not attempt to issue emergency alerts, calibrate professional instruments or make field predictions from the paper scenarios. Actual safety decisions belong to authorised meteorological and emergency professionals.
In a society, meteorological science supports work, schooling, transport, water services and general safety. Useful access depends on more than scientific accuracy: messages must match the question, arrive at a meaningful time and be understandable to the recipients. This does not authorise the class to tell real residents how to respond to hazards.
Family activity and a small-group tutorial
Rewrite invented bulletins in clear, source-labelled plain English.
A three-learner tutorial can assign a source historian, maths interpreter and user-access reviewer. Rotate roles after introducing a changed weather condition or observation error. Each student should restate another’s important concern accurately before the group publishes a revised classroom explanation.
End with a successor-ready record: purpose, station or geographic area, observation and publication times, unit, method, forecast horizon if present, uncertainty, institutional source, vulnerable user needs and versioned corrections. A new learner should be able to reconstruct the conclusion without the original teacher present.
Four case-study cards
The misleading weather or climate headline
The claim begins: Skyhaven publishes the best forecast in technical jargon on a site its older residents cannot read and calls the service effective for everyone. Write a more accurate title identifying the observed or predicted quantity, reference period, place and authority. Name a fact that remains unknown.
A strong answer returns to the mission mechanism: Information becomes useful when recipients can find timely, understandable and accessible products from authoritative services. Technical quality, dissemination and comprehension are distinct measures; communications must avoid both panic and false reassurance. It should not inflate the fictional result into a real public warning. Instead it names the exact type of evidence, the limitations of the observation, and whether someone with another user need might interpret the same information differently.
For forecast communication, accessibility and trust, rotate three readers: the first checks WMO or UNDRR provenance and times, the second computes and interprets the numeric example, and the third examines accessible communication. Each child must paraphrase a peer’s objection and then write a succinct correction the next pupil could use without the teacher’s help.
What does the number actually measure?
Use this invented calculation: A fictional survey reaches 100 people but only 60 understand a defined notice. This 60% toy response is not a universal comprehension rate. Check the unit, denominator or accumulation period. Change an input and show what the new arithmetic does not establish.
A strong answer returns to the mission mechanism: Information becomes useful when recipients can find timely, understandable and accessible products from authoritative services. Technical quality, dissemination and comprehension are distinct measures; communications must avoid both panic and false reassurance. It should not inflate the fictional result into a real public warning. Instead it names the exact type of evidence, the limitations of the observation, and whether someone with another user need might interpret the same information differently.
For forecast communication, accessibility and trust, rotate three readers: the first checks WMO or UNDRR provenance and times, the second computes and interprets the numeric example, and the third examines accessible communication. Each child must paraphrase a peer’s objection and then write a succinct correction the next pupil could use without the teacher’s help.
The original evidence changes
Rainbolt adds: Rainbolt finds the message was written in a language many intended readers did not use. Identify the first point in the observation or forecast chain where the old inference fails. Write a versioned correction and explain the correct source for a real public query.
A strong answer returns to the mission mechanism: Information becomes useful when recipients can find timely, understandable and accessible products from authoritative services. Technical quality, dissemination and comprehension are distinct measures; communications must avoid both panic and false reassurance. It should not inflate the fictional result into a real public warning. Instead it names the exact type of evidence, the limitations of the observation, and whether someone with another user need might interpret the same information differently.
For forecast communication, accessibility and trust, rotate three readers: the first checks WMO or UNDRR provenance and times, the second computes and interprets the numeric example, and the third examines accessible communication. Each child must paraphrase a peer’s objection and then write a succinct correction the next pupil could use without the teacher’s help.
The user left out of the forecast
Wintour asks: Wintour considers language, disability, cost, digital access and fair public communication. State a plausible accessibility or fairness concern and describe the type of authorised information that could improve the person’s understanding without issuing actual emergency instructions.
A strong answer returns to the mission mechanism: Information becomes useful when recipients can find timely, understandable and accessible products from authoritative services. Technical quality, dissemination and comprehension are distinct measures; communications must avoid both panic and false reassurance. It should not inflate the fictional result into a real public warning. Instead it names the exact type of evidence, the limitations of the observation, and whether someone with another user need might interpret the same information differently.
For forecast communication, accessibility and trust, rotate three readers: the first checks WMO or UNDRR provenance and times, the second computes and interprets the numeric example, and the third examines accessible communication. Each child must paraphrase a peer’s objection and then write a succinct correction the next pupil could use without the teacher’s help.
Long-term transfer: A new learner understands forecast communication, accessibility and trust when they can identify the question, observation or modelling stage, source date, uncertainty, affected user and why the initial public claim was too broad.
Mission 15 — Weather data quality, verification and versioned records
Skyhaven opens the lesson: A local dashboard shows a temperature graph without units, source, observation time or an explanation for missing points.
The short, accurate explanation
Observation quality relies on documented methods, units, metadata, quality controls and traceability to its source. A sensor’s readout and a cleaned dataset are not the same thing; gaps and corrections should remain visible.
Start with the observable variable and the user’s actual question. Does the person want to know what happened at a station, what might happen tomorrow, how conditions differ from a climatological baseline, or what an authorised warning says? Those aims need different evidence, language and responsible institutions. A visually impressive weather dashboard is not enough.
The crucial distinction for weather data quality, verification and versioned records is: Observation quality relies on documented methods, units, metadata, quality controls and traceability to its source. A sensor’s readout and a cleaned dataset are not the same thing; gaps and corrections should remain visible. Ask the learner to define which claim belongs to an observed fact, which is a model or interpretation, and which would need a legally authorised public warning. Misidentifying that role makes the communication unreliable even if the calculation appears neat.
Who observes, checks, forecasts and communicates?
A useful explanation traces the information chain: observation location, instrument or data stream, quality checks, international exchange when relevant, prediction or statistical analysis, and public communication. Each stage can fail independently. Record the original source and timestamp rather than pretending that a current phone display and an archived report are the same product.
International cooperation is a distinct civilisational capability. A local forecaster can benefit from marine buoys, satellite observations or upstream atmospheric data made available internationally. WMO’s GBON and WIS2 demonstrate institutional data exchange, not merely a collection of machines. The student should be able to identify a shared source’s limitations.
In the fictional case, A local dashboard shows a temperature graph without units, source, observation time or an explanation for missing points. Map what the original observation can directly show and the later stages needed for public use. Where the source is a weather report, show its location and time. Where the source is climate research, show its baseline, aggregation method and source publication date. Avoid treating a sketch of a data flow as an actual operational network.
Evidence and how to avoid making a false claim
Source context matters for both evidence and ethics. WMO’s annual climate reports and observations are public scientific work; national warning agencies have specific legal responsibilities; an invented story is merely a teaching case. The child should know the difference and never imply a classroom forecast is official.
For this mission, one might consult WMO on weather data quality, verification and versioned records. A WMO document defining weather and climate can explain general concepts, while WMO’s Global Basic Observing Network describes observational cooperation and the UNDRR report analyses multi-hazard warning systems. Each gives a different type of authoritative support. The pupil should cite the exact publication rather than the organisation’s name alone.
A conditional mathematics example
In a toy dataset of twenty observations, fifteen have an acceptable timestamp and unit: 75% metadata completion, not the probability readings are physically correct.
Weather and climate science uses physical quantities in defined units. A rainfall depth needs its accumulation window, temperature has place and observation conditions, a wind vector needs speed and direction, and forecast probability needs a clearly defined event and valid period. Mathematical literacy begins with the question the number is supposed to answer.
A statistic may be arithmetically correct yet socially misleading. Forecast errors from one day cannot define skill, a global surface-temperature anomaly is not a local reading, and a percentage of formatted warnings is not the share of people successfully protected. State numerator, denominator, location, time and the relevant outcome.
Now change exactly one paper assumption and compute again, stating the same relevant unit and period. The revised result can show how the model responds, but not a validated risk forecast, a climatological trend, or real forecast skill. If a hazard might be involved in real life, authorised current advice takes priority over the classroom calculation.
Rainbolt finds the assumption that fails
Rainbolt finds duplicated records that were treated as separate days.
Rainbolt introduces a changed condition: a station location changes, an observation is wrongly labelled, a model lead time shifts, data are duplicated, or a notice expires. The learner keeps the original claim in a version history and writes why the corrected statement is narrower or different. Corrections should be part of public trust.
The learner keeps both versions and labels the change: new observation, different reference, expired notice or revised model condition. A corrected public explanation should make the uncertain part visible and mention the proper authorised institution if a real decision would follow. A useful article does not merely replace one dramatic headline with another.
Wintour checks that a person can actually use the information
Wintour asks whether users can see what was corrected and whether misleading public charts can be challenged.
Wintour asks who could be excluded or harmed by the communication. A child walking to school, an older resident, a worker outdoors, a person with a disability, or someone with limited Internet access may face different information needs. A forecast is not meaningfully accessible if the intended user cannot obtain or understand it.
Recognise the boundary between learning and real operations. Children may draw weather charts and evaluate hypothetical messages but should not attempt to issue emergency alerts, calibrate professional instruments or make field predictions from the paper scenarios. Actual safety decisions belong to authorised meteorological and emergency professionals.
In a society, meteorological science supports work, schooling, transport, water services and general safety. Useful access depends on more than scientific accuracy: messages must match the question, arrive at a meaningful time and be understandable to the recipients. This does not authorise the class to tell real residents how to respond to hazards.
Family activity and a small-group tutorial
Create fictional data metadata and corrections, without real weather claims.
A three-learner tutorial can assign a source historian, maths interpreter and user-access reviewer. Rotate roles after introducing a changed weather condition or observation error. Each student should restate another’s important concern accurately before the group publishes a revised classroom explanation.
End with a successor-ready record: purpose, station or geographic area, observation and publication times, unit, method, forecast horizon if present, uncertainty, institutional source, vulnerable user needs and versioned corrections. A new learner should be able to reconstruct the conclusion without the original teacher present.
Four case-study cards
The misleading weather or climate headline
The claim begins: A local dashboard shows a temperature graph without units, source, observation time or an explanation for missing points. Write a more accurate title identifying the observed or predicted quantity, reference period, place and authority. Name a fact that remains unknown.
A strong answer returns to the mission mechanism: Observation quality relies on documented methods, units, metadata, quality controls and traceability to its source. A sensor’s readout and a cleaned dataset are not the same thing; gaps and corrections should remain visible. It should not inflate the fictional result into a real public warning. Instead it names the exact type of evidence, the limitations of the observation, and whether someone with another user need might interpret the same information differently.
For weather data quality, verification and versioned records, rotate three readers: the first checks WMO or UNDRR provenance and times, the second computes and interprets the numeric example, and the third examines accessible communication. Each child must paraphrase a peer’s objection and then write a succinct correction the next pupil could use without the teacher’s help.
What does the number actually measure?
Use this invented calculation: In a toy dataset of twenty observations, fifteen have an acceptable timestamp and unit: 75% metadata completion, not the probability readings are physically correct. Check the unit, denominator or accumulation period. Change an input and show what the new arithmetic does not establish.
A strong answer returns to the mission mechanism: Observation quality relies on documented methods, units, metadata, quality controls and traceability to its source. A sensor’s readout and a cleaned dataset are not the same thing; gaps and corrections should remain visible. It should not inflate the fictional result into a real public warning. Instead it names the exact type of evidence, the limitations of the observation, and whether someone with another user need might interpret the same information differently.
For weather data quality, verification and versioned records, rotate three readers: the first checks WMO or UNDRR provenance and times, the second computes and interprets the numeric example, and the third examines accessible communication. Each child must paraphrase a peer’s objection and then write a succinct correction the next pupil could use without the teacher’s help.
The original evidence changes
Rainbolt adds: Rainbolt finds duplicated records that were treated as separate days. Identify the first point in the observation or forecast chain where the old inference fails. Write a versioned correction and explain the correct source for a real public query.
A strong answer returns to the mission mechanism: Observation quality relies on documented methods, units, metadata, quality controls and traceability to its source. A sensor’s readout and a cleaned dataset are not the same thing; gaps and corrections should remain visible. It should not inflate the fictional result into a real public warning. Instead it names the exact type of evidence, the limitations of the observation, and whether someone with another user need might interpret the same information differently.
For weather data quality, verification and versioned records, rotate three readers: the first checks WMO or UNDRR provenance and times, the second computes and interprets the numeric example, and the third examines accessible communication. Each child must paraphrase a peer’s objection and then write a succinct correction the next pupil could use without the teacher’s help.
The user left out of the forecast
Wintour asks: Wintour asks whether users can see what was corrected and whether misleading public charts can be challenged. State a plausible accessibility or fairness concern and describe the type of authorised information that could improve the person’s understanding without issuing actual emergency instructions.
A strong answer returns to the mission mechanism: Observation quality relies on documented methods, units, metadata, quality controls and traceability to its source. A sensor’s readout and a cleaned dataset are not the same thing; gaps and corrections should remain visible. It should not inflate the fictional result into a real public warning. Instead it names the exact type of evidence, the limitations of the observation, and whether someone with another user need might interpret the same information differently.
For weather data quality, verification and versioned records, rotate three readers: the first checks WMO or UNDRR provenance and times, the second computes and interprets the numeric example, and the third examines accessible communication. Each child must paraphrase a peer’s objection and then write a succinct correction the next pupil could use without the teacher’s help.
Long-term transfer: A new learner understands weather data quality, verification and versioned records when they can identify the question, observation or modelling stage, source date, uncertainty, affected user and why the initial public claim was too broad.
Mission 16 — Meteorological institutions that can outlive their founders
Skyhaven opens the lesson: Skyhaven’s first forecasting office closes and leaves beautiful charts without definitions, trained staff, archives or current official-warning routes.
The short, accurate explanation
Weather and climate service systems need qualified observers, maintained instruments, credible modelling, international data exchange, lawful communication responsibilities and preservation of evidence. Future specialists must be able to understand both successful forecasts and errors.
Start with the observable variable and the user’s actual question. Does the person want to know what happened at a station, what might happen tomorrow, how conditions differ from a climatological baseline, or what an authorised warning says? Those aims need different evidence, language and responsible institutions. A visually impressive weather dashboard is not enough.
The crucial distinction for meteorological institutions that can outlive their founders is: Weather and climate service systems need qualified observers, maintained instruments, credible modelling, international data exchange, lawful communication responsibilities and preservation of evidence. Future specialists must be able to understand both successful forecasts and errors. Ask the learner to define which claim belongs to an observed fact, which is a model or interpretation, and which would need a legally authorised public warning. Misidentifying that role makes the communication unreliable even if the calculation appears neat.
Who observes, checks, forecasts and communicates?
A useful explanation traces the information chain: observation location, instrument or data stream, quality checks, international exchange when relevant, prediction or statistical analysis, and public communication. Each stage can fail independently. Record the original source and timestamp rather than pretending that a current phone display and an archived report are the same product.
International cooperation is a distinct civilisational capability. A local forecaster can benefit from marine buoys, satellite observations or upstream atmospheric data made available internationally. WMO’s GBON and WIS2 demonstrate institutional data exchange, not merely a collection of machines. The student should be able to identify a shared source’s limitations.
In the fictional case, Skyhaven’s first forecasting office closes and leaves beautiful charts without definitions, trained staff, archives or current official-warning routes. Map what the original observation can directly show and the later stages needed for public use. Where the source is a weather report, show its location and time. Where the source is climate research, show its baseline, aggregation method and source publication date. Avoid treating a sketch of a data flow as an actual operational network.
Evidence and how to avoid making a false claim
Source context matters for both evidence and ethics. WMO’s annual climate reports and observations are public scientific work; national warning agencies have specific legal responsibilities; an invented story is merely a teaching case. The child should know the difference and never imply a classroom forecast is official.
For this mission, one might consult WMO on meteorological institutions that can outlive their founders. A WMO document defining weather and climate can explain general concepts, while WMO’s Global Basic Observing Network describes observational cooperation and the UNDRR report analyses multi-hazard warning systems. Each gives a different type of authoritative support. The pupil should cite the exact publication rather than the organisation’s name alone.
A conditional mathematics example
Twelve of sixteen imaginary observation files include station, time, unit and reviewer: 75% record coverage, not national forecast skill.
Weather and climate science uses physical quantities in defined units. A rainfall depth needs its accumulation window, temperature has place and observation conditions, a wind vector needs speed and direction, and forecast probability needs a clearly defined event and valid period. Mathematical literacy begins with the question the number is supposed to answer.
A statistic may be arithmetically correct yet socially misleading. Forecast errors from one day cannot define skill, a global surface-temperature anomaly is not a local reading, and a percentage of formatted warnings is not the share of people successfully protected. State numerator, denominator, location, time and the relevant outcome.
Now change exactly one paper assumption and compute again, stating the same relevant unit and period. The revised result can show how the model responds, but not a validated risk forecast, a climatological trend, or real forecast skill. If a hazard might be involved in real life, authorised current advice takes priority over the classroom calculation.
Rainbolt finds the assumption that fails
Rainbolt discovers the public archive’s reference instrument changed but the note is missing.
Rainbolt introduces a changed condition: a station location changes, an observation is wrongly labelled, a model lead time shifts, data are duplicated, or a notice expires. The learner keeps the original claim in a version history and writes why the corrected statement is narrower or different. Corrections should be part of public trust.
The learner keeps both versions and labels the change: new observation, different reference, expired notice or revised model condition. A corrected public explanation should make the uncertain part visible and mention the proper authorised institution if a real decision would follow. A useful article does not merely replace one dramatic headline with another.
Wintour checks that a person can actually use the information
Wintour asks whether people can obtain trustworthy information and corrections after leadership changes.
Wintour asks who could be excluded or harmed by the communication. A child walking to school, an older resident, a worker outdoors, a person with a disability, or someone with limited Internet access may face different information needs. A forecast is not meaningfully accessible if the intended user cannot obtain or understand it.
Recognise the boundary between learning and real operations. Children may draw weather charts and evaluate hypothetical messages but should not attempt to issue emergency alerts, calibrate professional instruments or make field predictions from the paper scenarios. Actual safety decisions belong to authorised meteorological and emergency professionals.
In a society, meteorological science supports work, schooling, transport, water services and general safety. Useful access depends on more than scientific accuracy: messages must match the question, arrive at a meaningful time and be understandable to the recipients. This does not authorise the class to tell real residents how to respond to hazards.
Family activity and a small-group tutorial
Give new pupils a fictional weather-service handover pack and ask which claims are supportable.
A three-learner tutorial can assign a source historian, maths interpreter and user-access reviewer. Rotate roles after introducing a changed weather condition or observation error. Each student should restate another’s important concern accurately before the group publishes a revised classroom explanation.
End with a successor-ready record: purpose, station or geographic area, observation and publication times, unit, method, forecast horizon if present, uncertainty, institutional source, vulnerable user needs and versioned corrections. A new learner should be able to reconstruct the conclusion without the original teacher present.
Four case-study cards
The misleading weather or climate headline
The claim begins: Skyhaven’s first forecasting office closes and leaves beautiful charts without definitions, trained staff, archives or current official-warning routes. Write a more accurate title identifying the observed or predicted quantity, reference period, place and authority. Name a fact that remains unknown.
A strong answer returns to the mission mechanism: Weather and climate service systems need qualified observers, maintained instruments, credible modelling, international data exchange, lawful communication responsibilities and preservation of evidence. Future specialists must be able to understand both successful forecasts and errors. It should not inflate the fictional result into a real public warning. Instead it names the exact type of evidence, the limitations of the observation, and whether someone with another user need might interpret the same information differently.
For meteorological institutions that can outlive their founders, rotate three readers: the first checks WMO or UNDRR provenance and times, the second computes and interprets the numeric example, and the third examines accessible communication. Each child must paraphrase a peer’s objection and then write a succinct correction the next pupil could use without the teacher’s help.
What does the number actually measure?
Use this invented calculation: Twelve of sixteen imaginary observation files include station, time, unit and reviewer: 75% record coverage, not national forecast skill. Check the unit, denominator or accumulation period. Change an input and show what the new arithmetic does not establish.
A strong answer returns to the mission mechanism: Weather and climate service systems need qualified observers, maintained instruments, credible modelling, international data exchange, lawful communication responsibilities and preservation of evidence. Future specialists must be able to understand both successful forecasts and errors. It should not inflate the fictional result into a real public warning. Instead it names the exact type of evidence, the limitations of the observation, and whether someone with another user need might interpret the same information differently.
For meteorological institutions that can outlive their founders, rotate three readers: the first checks WMO or UNDRR provenance and times, the second computes and interprets the numeric example, and the third examines accessible communication. Each child must paraphrase a peer’s objection and then write a succinct correction the next pupil could use without the teacher’s help.
The original evidence changes
Rainbolt adds: Rainbolt discovers the public archive’s reference instrument changed but the note is missing. Identify the first point in the observation or forecast chain where the old inference fails. Write a versioned correction and explain the correct source for a real public query.
A strong answer returns to the mission mechanism: Weather and climate service systems need qualified observers, maintained instruments, credible modelling, international data exchange, lawful communication responsibilities and preservation of evidence. Future specialists must be able to understand both successful forecasts and errors. It should not inflate the fictional result into a real public warning. Instead it names the exact type of evidence, the limitations of the observation, and whether someone with another user need might interpret the same information differently.
For meteorological institutions that can outlive their founders, rotate three readers: the first checks WMO or UNDRR provenance and times, the second computes and interprets the numeric example, and the third examines accessible communication. Each child must paraphrase a peer’s objection and then write a succinct correction the next pupil could use without the teacher’s help.
The user left out of the forecast
Wintour asks: Wintour asks whether people can obtain trustworthy information and corrections after leadership changes. State a plausible accessibility or fairness concern and describe the type of authorised information that could improve the person’s understanding without issuing actual emergency instructions.
A strong answer returns to the mission mechanism: Weather and climate service systems need qualified observers, maintained instruments, credible modelling, international data exchange, lawful communication responsibilities and preservation of evidence. Future specialists must be able to understand both successful forecasts and errors. It should not inflate the fictional result into a real public warning. Instead it names the exact type of evidence, the limitations of the observation, and whether someone with another user need might interpret the same information differently.
For meteorological institutions that can outlive their founders, rotate three readers: the first checks WMO or UNDRR provenance and times, the second computes and interprets the numeric example, and the third examines accessible communication. Each child must paraphrase a peer’s objection and then write a succinct correction the next pupil could use without the teacher’s help.
Long-term transfer: A new learner understands meteorological institutions that can outlive their founders when they can identify the question, observation or modelling stage, source date, uncertainty, affected user and why the initial public claim was too broad.
Eight-week weather-and-climate literacy course
The lessons are designed for safe paper learning and source interpretation, not for meteorological operations. Each week pairs two missions and asks pupils to distinguish a current measurement, a modelled future, a climate average and a message issued by an appropriate public authority.
Week 1: Weather and climate are different timescales and Observation, forecast and warning are separate information products
Begin by defining weather and climate are different timescales and then examine its relationship with observation, forecast and warning are separate information products. The tutor asks what the student would see in a reliable source, which units would appear and which physical or institutional mechanism the numbers describe. A concept map should link quantities and responsibility with labelled arrows.
Ten minutes are spent reading an official primary source; ten interpreting a fictitious chart; ten recalculating a case after Rainbolt changes a condition; and ten evaluating Wintour’s concern about the user. The teacher should explain that a weather icon on a screen is not a substitute for a live official warning.
Three learners rotate as observing-system explainer, statistical checker and citizen-information advocate. A parent can ask how a date, unit or forecast horizon changes the meaning of a chart without requiring a child to carry out outdoor tests. Each week ends with a dated correction and one statement the data cannot prove.
Week 2: Surface stations and the meaning of measurement context and Rain gauges, rainfall totals and accumulation windows
Begin by defining surface stations and the meaning of measurement context and then examine its relationship with rain gauges, rainfall totals and accumulation windows. The tutor asks what the student would see in a reliable source, which units would appear and which physical or institutional mechanism the numbers describe. A concept map should link quantities and responsibility with labelled arrows.
Ten minutes are spent reading an official primary source; ten interpreting a fictitious chart; ten recalculating a case after Rainbolt changes a condition; and ten evaluating Wintour’s concern about the user. The teacher should explain that a weather icon on a screen is not a substitute for a live official warning.
Three learners rotate as observing-system explainer, statistical checker and citizen-information advocate. A parent can ask how a date, unit or forecast horizon changes the meaning of a chart without requiring a child to carry out outdoor tests. Each week ends with a dated correction and one statement the data cannot prove.
Week 3: Pressure, wind, humidity and different atmospheric quantities and Satellites and ground observations have complementary roles
Begin by defining pressure, wind, humidity and different atmospheric quantities and then examine its relationship with satellites and ground observations have complementary roles. The tutor asks what the student would see in a reliable source, which units would appear and which physical or institutional mechanism the numbers describe. A concept map should link quantities and responsibility with labelled arrows.
Ten minutes are spent reading an official primary source; ten interpreting a fictitious chart; ten recalculating a case after Rainbolt changes a condition; and ten evaluating Wintour’s concern about the user. The teacher should explain that a weather icon on a screen is not a substitute for a live official warning.
Three learners rotate as observing-system explainer, statistical checker and citizen-information advocate. A parent can ask how a date, unit or forecast horizon changes the meaning of a chart without requiring a child to carry out outdoor tests. Each week ends with a dated correction and one statement the data cannot prove.
Week 4: International data exchange and the WMO system and Numerical forecasts and why they contain uncertainty
Begin by defining international data exchange and the wmo system and then examine its relationship with numerical forecasts and why they contain uncertainty. The tutor asks what the student would see in a reliable source, which units would appear and which physical or institutional mechanism the numbers describe. A concept map should link quantities and responsibility with labelled arrows.
Ten minutes are spent reading an official primary source; ten interpreting a fictitious chart; ten recalculating a case after Rainbolt changes a condition; and ten evaluating Wintour’s concern about the user. The teacher should explain that a weather icon on a screen is not a substitute for a live official warning.
Three learners rotate as observing-system explainer, statistical checker and citizen-information advocate. A parent can ask how a date, unit or forecast horizon changes the meaning of a chart without requiring a child to carry out outdoor tests. Each week ends with a dated correction and one statement the data cannot prove.
Week 5: Probability forecasts and the common 70% mistake and Heat alerts, rainfall warnings and official public authority
Begin by defining probability forecasts and the common 70% mistake and then examine its relationship with heat alerts, rainfall warnings and official public authority. The tutor asks what the student would see in a reliable source, which units would appear and which physical or institutional mechanism the numbers describe. A concept map should link quantities and responsibility with labelled arrows.
Ten minutes are spent reading an official primary source; ten interpreting a fictitious chart; ten recalculating a case after Rainbolt changes a condition; and ten evaluating Wintour’s concern about the user. The teacher should explain that a weather icon on a screen is not a substitute for a live official warning.
Three learners rotate as observing-system explainer, statistical checker and citizen-information advocate. A parent can ask how a date, unit or forecast horizon changes the meaning of a chart without requiring a child to carry out outdoor tests. Each week ends with a dated correction and one statement the data cannot prove.
Week 6: Early warning means more than sensors and sirens and Climate normals, anomalies and reference periods
Begin by defining early warning means more than sensors and sirens and then examine its relationship with climate normals, anomalies and reference periods. The tutor asks what the student would see in a reliable source, which units would appear and which physical or institutional mechanism the numbers describe. A concept map should link quantities and responsibility with labelled arrows.
Ten minutes are spent reading an official primary source; ten interpreting a fictitious chart; ten recalculating a case after Rainbolt changes a condition; and ten evaluating Wintour’s concern about the user. The teacher should explain that a weather icon on a screen is not a substitute for a live official warning.
Three learners rotate as observing-system explainer, statistical checker and citizen-information advocate. A parent can ask how a date, unit or forecast horizon changes the meaning of a chart without requiring a child to carry out outdoor tests. Each week ends with a dated correction and one statement the data cannot prove.
Week 7: Ocean, polar and remote observations and Forecast communication, accessibility and trust
Begin by defining ocean, polar and remote observations and then examine its relationship with forecast communication, accessibility and trust. The tutor asks what the student would see in a reliable source, which units would appear and which physical or institutional mechanism the numbers describe. A concept map should link quantities and responsibility with labelled arrows.
Ten minutes are spent reading an official primary source; ten interpreting a fictitious chart; ten recalculating a case after Rainbolt changes a condition; and ten evaluating Wintour’s concern about the user. The teacher should explain that a weather icon on a screen is not a substitute for a live official warning.
Three learners rotate as observing-system explainer, statistical checker and citizen-information advocate. A parent can ask how a date, unit or forecast horizon changes the meaning of a chart without requiring a child to carry out outdoor tests. Each week ends with a dated correction and one statement the data cannot prove.
Week 8: Weather data quality, verification and versioned records and Meteorological institutions that can outlive their founders
Begin by defining weather data quality, verification and versioned records and then examine its relationship with meteorological institutions that can outlive their founders. The tutor asks what the student would see in a reliable source, which units would appear and which physical or institutional mechanism the numbers describe. A concept map should link quantities and responsibility with labelled arrows.
Ten minutes are spent reading an official primary source; ten interpreting a fictitious chart; ten recalculating a case after Rainbolt changes a condition; and ten evaluating Wintour’s concern about the user. The teacher should explain that a weather icon on a screen is not a substitute for a live official warning.
Three learners rotate as observing-system explainer, statistical checker and citizen-information advocate. A parent can ask how a date, unit or forecast horizon changes the meaning of a chart without requiring a child to carry out outdoor tests. Each week ends with a dated correction and one statement the data cannot prove.
Twenty useful weather-and-climate questions
- Is a weather forecast the same as a measured observation? No, one models possible future conditions while the other reports a measurement.
- Can one hot day prove a new climate trend? No, longer records and appropriate statistical analysis are needed.
- What is a climate normal? A longer-term reference average, commonly using thirty years, under defined WMO practices.
- Why does rainfall need an accumulation period? The same depth can occur over very different times, with different implications.
- Is a 70% rain forecast the same as rain lasting 70% of the day? Not automatically; the product’s event definition matters.
- Do satellites make surface stations unnecessary? No, different observing systems supply complementary information.
- What is WMO GBON? A global programme to strengthen and exchange essential surface observing data.
- What is WIS2? The modern WMO Information System, operational since January 2025.
- Are all meteorological data identical across sources? No, methods, siting, units and quality control vary.
- What did WMO’s March 2026 climate report find? 2015–2025 were the eleven warmest years in the cited record.
- Does the global annual temperature anomaly describe my town’s daily temperature? No.
- What is forecast lead time? The time between a prediction’s issue or initialisation and its valid future period.
- Why can a forecast change? New observations and different model assumptions can alter expected future conditions.
- Can a classroom issue official hazard alerts? No, warnings belong to authorised public systems.
- How many countries reported multi-hazard early-warning systems in 2025? UNDRR reported 119, under that year’s country-reporting scope.
- Does reporting a system mean every household is warned? No, practical coverage, understanding and action differ.
- Why should warnings be accessible? People need appropriate language, formats, delivery and current sources.
- Are climate reports and forecasts updated on identical schedules? No, their methods and periods differ.
- Can a weather chart be misleading without unit or time? Yes, interpretation depends on those details.
- What should a weather civilisation preserve? Qualified observations, comparable data, accountable forecasts and public correction routes.
Sixteen questions for the Secondary learner
What counts as weather?
The state of the atmosphere at a particular time, described by relevant physical quantities.
Tutor follow-up: give a fictional weather record, label its time, place, quantity and original institutional source, and explain whether it supports observation, forecast or climate interpretation. Ask the learner to state one important limitation before calculating a proportion or difference.
How does climate differ?
Climate describes statistical conditions and patterns over longer reference periods.
Tutor follow-up: give a fictional weather record, label its time, place, quantity and original institutional source, and explain whether it supports observation, forecast or climate interpretation. Ask the learner to state one important limitation before calculating a proportion or difference.
What is a meteorological observation?
A measured atmospheric or related environmental quantity under a specified method and time.
Tutor follow-up: give a fictional weather record, label its time, place, quantity and original institutional source, and explain whether it supports observation, forecast or climate interpretation. Ask the learner to state one important limitation before calculating a proportion or difference.
Why should station metadata be public?
Method, siting, time and quality records help explain whether observations are comparable.
Tutor follow-up: give a fictional weather record, label its time, place, quantity and original institutional source, and explain whether it supports observation, forecast or climate interpretation. Ask the learner to state one important limitation before calculating a proportion or difference.
What is precipitation accumulation?
The amount collected or estimated over a defined period, often expressed as a water-depth equivalent.
Tutor follow-up: give a fictional weather record, label its time, place, quantity and original institutional source, and explain whether it supports observation, forecast or climate interpretation. Ask the learner to state one important limitation before calculating a proportion or difference.
Are speed and direction interchangeable for wind?
No, they are distinct components of a vector-like quantity.
Tutor follow-up: give a fictional weather record, label its time, place, quantity and original institutional source, and explain whether it supports observation, forecast or climate interpretation. Ask the learner to state one important limitation before calculating a proportion or difference.
What is numerical weather prediction?
Forecasting based on physical models, observations, computing and relevant assumptions.
Tutor follow-up: give a fictional weather record, label its time, place, quantity and original institutional source, and explain whether it supports observation, forecast or climate interpretation. Ask the learner to state one important limitation before calculating a proportion or difference.
Why is a forecast not guaranteed?
Uncertainty in data, model and atmospheric evolution creates a range of possible outcomes.
Tutor follow-up: give a fictional weather record, label its time, place, quantity and original institutional source, and explain whether it supports observation, forecast or climate interpretation. Ask the learner to state one important limitation before calculating a proportion or difference.
What is a climate anomaly?
Difference between an observed or estimated value and a stated reference average.
Tutor follow-up: give a fictional weather record, label its time, place, quantity and original institutional source, and explain whether it supports observation, forecast or climate interpretation. Ask the learner to state one important limitation before calculating a proportion or difference.
What is a model baseline?
The reference period or comparison used to interpret an anomaly or scenario.
Tutor follow-up: give a fictional weather record, label its time, place, quantity and original institutional source, and explain whether it supports observation, forecast or climate interpretation. Ask the learner to state one important limitation before calculating a proportion or difference.
How does WIS2 help?
It supports exchange and use of meteorological information among relevant WMO members and systems.
Tutor follow-up: give a fictional weather record, label its time, place, quantity and original institutional source, and explain whether it supports observation, forecast or climate interpretation. Ask the learner to state one important limitation before calculating a proportion or difference.
What is an early-warning system?
Coordinated capabilities for risk knowledge, monitoring, communication and action under appropriate authorities.
Tutor follow-up: give a fictional weather record, label its time, place, quantity and original institutional source, and explain whether it supports observation, forecast or climate interpretation. Ask the learner to state one important limitation before calculating a proportion or difference.
What does UNDRR’s system statistic measure?
Reported existence or comprehensiveness under the chosen country-level method, not each individual’s safety.
Tutor follow-up: give a fictional weather record, label its time, place, quantity and original institutional source, and explain whether it supports observation, forecast or climate interpretation. Ask the learner to state one important limitation before calculating a proportion or difference.
Why are uncertainty and probability important?
They help users understand possible outcomes without presenting an uncertain future as definite.
Tutor follow-up: give a fictional weather record, label its time, place, quantity and original institutional source, and explain whether it supports observation, forecast or climate interpretation. Ask the learner to state one important limitation before calculating a proportion or difference.
What is verification?
Comparing defined forecasts and observations using consistent methods and relevant metrics.
Tutor follow-up: give a fictional weather record, label its time, place, quantity and original institutional source, and explain whether it supports observation, forecast or climate interpretation. Ask the learner to state one important limitation before calculating a proportion or difference.
How can children study weather responsibly?
Through public source interpretation, harmless paper records, mathematical exercises and avoiding unverified public warnings.
Tutor follow-up: give a fictional weather record, label its time, place, quantity and original institutional source, and explain whether it supports observation, forecast or climate interpretation. Ask the learner to state one important limitation before calculating a proportion or difference.
Weather and climate glossary
- Weather — atmospheric conditions at a defined time and place
- Climate — statistical patterns of atmospheric and related conditions over longer periods
- Climatological normal — reference climatic average under a specified period
- Observation — measured value or record under a defined method
- Forecast — estimate of future conditions based on suitable evidence and modelling
- Forecast horizon — period into the future covered by a prediction
- Precipitation — liquid or solid water falling from the atmosphere
- Rainfall accumulation — amount of rainfall recorded over a defined interval
- Relative humidity — specified relation involving atmospheric moisture under temperature-dependent conditions
- Atmospheric pressure — force per unit area associated with the atmosphere
- Wind speed — rate of horizontal air movement under a defined method
- Wind direction — direction from which wind blows under usual meteorological convention
- Weather station — place and apparatus for making relevant observations
- Satellite observation — information remotely sensed by an orbiting instrument
- Data assimilation — incorporation of observations into a modelled estimate
- Numerical weather prediction — use of physical numerical models to forecast
- Climate anomaly — difference from a specified reference climate value
- Uncertainty — recognised limitations on the precision or reliability of a value
- Multi-hazard early warning — coordinated information and action capabilities across relevant hazards
- Provenance — source, date, method and reference conditions behind data or a claim
Forecast verification
Comparison of a predicted event with a relevant observed event under a chosen metric.
A Primary or Secondary student should use ‘Forecast verification’ in a source-aware sentence and rewrite one misleading claim. The school does not produce a professional forecast by completing this exercise.
Ensemble forecast
Set of predictions generated from multiple conditions or model variants.
A Primary or Secondary student should use ‘Ensemble forecast’ in a source-aware sentence and rewrite one misleading claim. The school does not produce a professional forecast by completing this exercise.
Observation metadata
Context describing time, location, method, units and status.
A Primary or Secondary student should use ‘Observation metadata’ in a source-aware sentence and rewrite one misleading claim. The school does not produce a professional forecast by completing this exercise.
WIS2
WMO’s modern information-exchange system.
A Primary or Secondary student should use ‘WIS2’ in a source-aware sentence and rewrite one misleading claim. The school does not produce a professional forecast by completing this exercise.
GBON
Global Basic Observing Network for essential surface observations.
A Primary or Secondary student should use ‘GBON’ in a source-aware sentence and rewrite one misleading claim. The school does not produce a professional forecast by completing this exercise.
Lead time
Interval available before the forecast’s valid event or warning period.
A Primary or Secondary student should use ‘Lead time’ in a source-aware sentence and rewrite one misleading claim. The school does not produce a professional forecast by completing this exercise.
Image provenance and the enduring weather-service question
The featured media is an existing eduKateSG educational illustration of students and their teacher recording imaginary weather observations with instruments and a labelled paper log. It is not a qualified meteorological station or a real climate report, and it should not be cited as a certified weather measurement.
All Skyhaven temperatures, rainfall amounts, stations, forecasts and warning forms are fictional. WMO and UNDRR data support specific real institutional claims under their own publication and observation dates. Official real-time warning services remain the source for actual public action.
Final Skyhaven question: When the original weather observers, forecasters and public officers retire, can the next generation still find comparable data, explain uncertainty, receive accessible official information and correct a misleading chart? That is a weather-and-climate civilisation’s lasting public capability.