
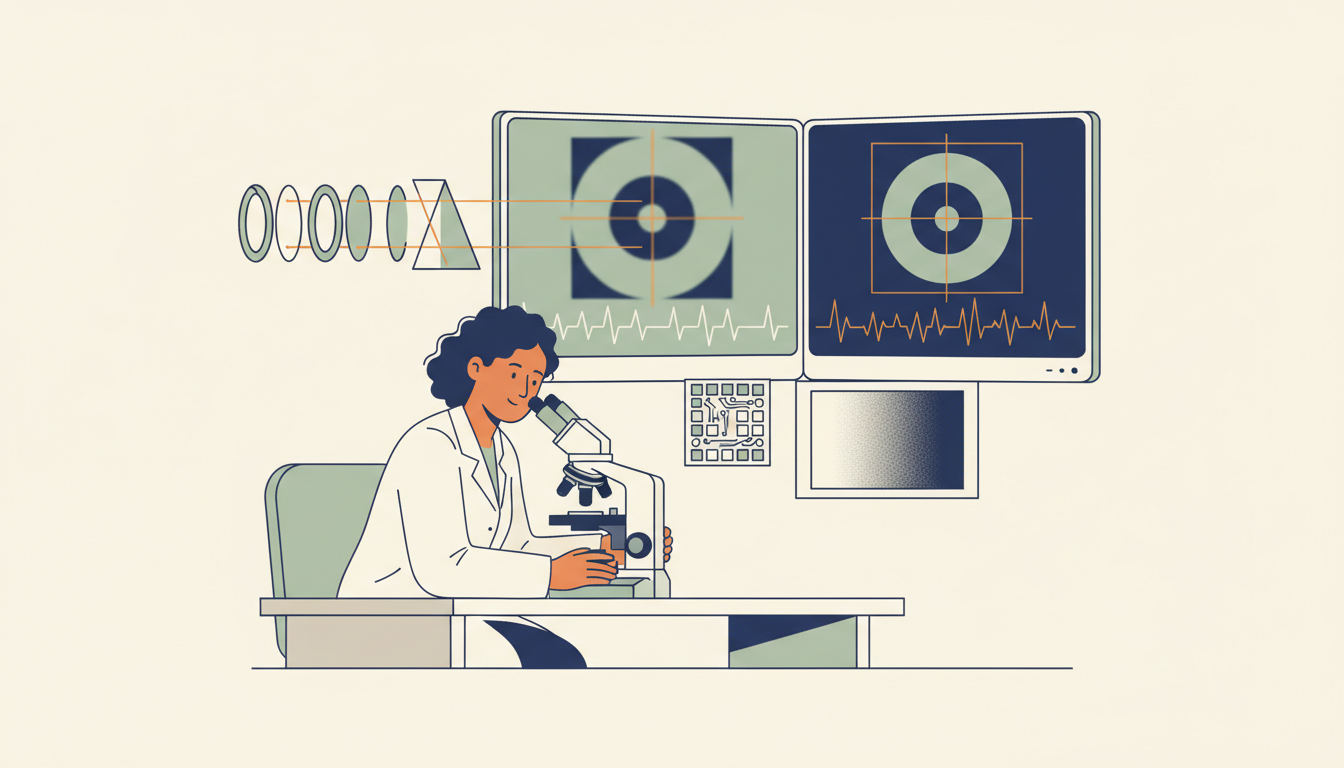
Imaging science turns physical signals into pictures that help people observe, measure and investigate. A useful image can come from visible light, sound, X-rays or magnetic-resonance signals, but the displayed pixels must be interpreted through the measurement process that produced them.
This Gold Standard guide connects image formation, pixel sampling, resolution, contrast, noise and processing with two checked fictional calculations. It also compares imaging modalities at a scientific level and explains why attractive displays do not replace trustworthy evidence.
Chapter index
Signals, optics, sampling and resolution · Chapters 1–9
- An image is evidence produced by a measuring system
- Choose a modality that measures the relevant property
- Follow the path from source to detector
- Optical images depend on light interactions
- Focus, blur and spatial resolution differ
- Sampling divides a field of view into recorded values
- Worked example: pixel interval is not feature resolution
- Sampling too coarsely can create false patterns
- Contrast reveals differences without defining their cause
Contrast, noise and different imaging modalities · Chapters 10–19
- Dynamic range and saturation limit available evidence
- Noise can imitate structure or hide useful detail
- A signal-to-noise ratio needs a defined model
- Illumination, calibration and reference objects matter
- Colour can be measured or deliberately assigned
- Microscopy depends on magnification and optical limits
- Ultrasound reconstructs structure from echoes
- X-ray imaging measures attenuation of ionising radiation
- Computed tomography reconstructs slices from projections
- MRI obtains different information without X-rays
Processing, evaluation, ethics and transfer · Chapters 20–29
- Remote sensing makes images of places from measured bands
- Image processing cannot recreate all missing information
- Machine learning can detect patterns and make errors
- Worked classifier example: precision and sensitivity differ
- Metadata records what the image really represents
- Privacy, consent and responsible publication matter
- Diagnostic checklist: identify the claim the image can support
- Transfer the lesson into changed conditions
- Frequently asked questions about imaging science
- Continue through connected eduKate subject roots
1. An image is evidence produced by a measuring system
Imaging science investigates how physical signals become visual representations and how those representations support reliable observation and measurement. An image is not always a direct view of what a person would see. It can be a reconstruction from light, sound, X-rays or other measurements processed according to a model.
The most important question is which property the imaging system actually measured. A photograph records a pattern of light arriving at a sensor. An ultrasound image is derived from acoustic echoes, while some medical tomographic techniques reconstruct internal structure from many measurements. A coloured display may be useful even when its colours were assigned to represent quantities not visible to the eye.
The NIH/NIBIB imaging science topics describe distinct medical imaging methods. This guide develops the shared scientific logic across them without suggesting that one modality, picture or algorithm can replace specialist interpretation.
2. Choose a modality that measures the relevant property
Different imaging systems detect different interactions. Visible-light cameras respond to light transmitted, reflected or emitted in their useful wavelength range. Ultrasound uses acoustic signals and echoes. X-ray-based techniques use interactions of ionising radiation with matter, while MRI relies on magnetic-resonance phenomena rather than X-rays.
These methods answer different questions and have different safety, resolution, cost and practicality constraints. A high-resolution surface photograph cannot automatically reveal what lies deep inside an opaque object. Conversely, an internal imaging method might be unsuitable for inspecting fine surface colour or texture.
The appropriate choice depends on the task, specimen, environment and qualified oversight. The Physics and Optics roots explain relevant physical principles, while Engineering develops system trade-offs.
3. Follow the path from source to detector
A useful imaging model begins with a source of physical energy or contrast, its interaction with the object, the path to a detector and the process that produces an image. Some systems use ambient illumination; others deliberately generate a signal. The detector converts physical energy into measurable information under its design and calibration.
Every stage can alter what is recorded. A lens may blur, material may absorb or scatter, the sensor may add noise and processing may emphasise particular patterns. These effects explain why the final pixels cannot be treated as independent and perfect samples of the original object.
A good diagram labels what is emitted or transmitted, what interacts with the sample, what reaches the detector and what computation follows. It should identify assumptions rather than depict an image as though it appeared without an instrument.
4. Optical images depend on light interactions
Optical imaging uses absorption, reflection, scattering and emission of light to form useful signals. A microscope can magnify a specimen, a camera can record a scene and specialised instruments can exploit wavelengths outside ordinary visible perception. What appears bright or dark depends on illumination, detector response and the material being examined.
The NIBIB overview of optical imaging describes scientific uses of light across different physical scales. The principles help learners see why illumination geometry and material properties matter when interpreting a photograph or microscope image.
A shadow may indicate an obstruction to light, not necessarily an absent material. A bright region may come from reflection, fluorescence or display mapping, depending on the modality. The strongest interpretation identifies the actual contrast mechanism before assigning a physical meaning.
5. Focus, blur and spatial resolution differ
Focus concerns how an optical system forms an image of features under particular conditions. Blur can arise from imperfect focus, motion, diffraction, detector sampling and other mechanisms. Spatial resolution concerns whether sufficiently distinct features can be distinguished, not simply whether the output has many pixels.
An image with large pixel dimensions may still be optically blurry. Enlarging it or using a sharpening filter does not automatically recover details that were never measured. A filter may improve apparent edge contrast while also creating ringing or misleading structure. The evidence for a new detail requires suitable measurements or validation.
The Image Processing root explores these computational effects. Imaging science connects them to physical measurement so that the output’s attractive appearance does not outrun its evidentiary quality.
6. Sampling divides a field of view into recorded values
Digital images often sample a field of view onto a grid. Pixel count and field size together give a nominal spatial sampling interval in image coordinates. The interval is useful for scale calculations but must not be mistaken for the smallest detail the complete optical or physical system can resolve.
A camera covering twenty millimetres across one thousand samples has a nominal interval of 20 ÷ 1,000 = 0.020 millimetres per sample in that direction, assuming uniform mapping. Whether a feature of that size is distinguishable depends on optics, blur, contrast, noise and the sampling requirements of its shape.
Reports should state how scale was calibrated and whether magnification, cropping or resampling altered the image. A pixel count without a physical scale is inadequate for many dimensional conclusions.
7. Worked example: pixel interval is not feature resolution
Consider a fictional laboratory image covering twenty millimetres horizontally and containing one thousand pixel columns. The nominal sampling interval is 0.020 millimetres per pixel. If an object edge occupies ten columns, a naive width estimate is 10 × 0.020 = 0.20 millimetres, but its uncertainty depends on how the edge was located and calibrated.
Two nearby features separated by one pixel interval are not automatically resolvable. The lens may blur them together, or the sensor and image-processing steps may mix their signals. A valid measurement would require suitable reference features and testing of the complete pipeline.
This example illustrates a frequent reporting error: equating digital image dimensions with physical performance. Extra pixels help only when the rest of the acquisition system provides corresponding information.
| Measure | Illustrative value |
|---|---|
| Horizontal field of view | 20 mm |
| Sampling columns | 1,000 |
| Nominal sampling interval | 0.020 mm per pixel |
| Ten-column length before other errors | 0.20 mm |
8. Sampling too coarsely can create false patterns
When a repeated visual pattern varies faster than the sampling grid can capture, the digital image may show an incorrect lower-frequency pattern. This is one form of aliasing. A finely striped fabric can appear to contain broad waves or moiré patterns in a photograph even though those waves are not present on the fabric.
The sampling theorem provides a mathematical foundation for avoiding some forms of aliasing under suitable signal assumptions. Actual cameras and scanners also require consideration of optics, reconstruction, filtering and motion. A simple statement that ‘two pixels are always enough’ neglects those details.
An analyst should compare sampling and physical resolution to the feature being studied. When the original data cannot distinguish alternative structures, a smoother displayed image does not establish which structure was real.
9. Contrast reveals differences without defining their cause
Contrast concerns differences in recorded values that make objects or features distinguishable from their surroundings. Its physical meaning depends on the imaging modality. In an optical photograph, contrast can arise from illumination or reflectance. In MRI or CT, displayed differences represent other physical properties and processing choices.
Two objects with similar recorded values may still differ in relevant characteristics that the modality is insensitive to. Conversely, a striking contrast boundary may result from an artefact or reconstruction choice. The analyst should connect the observed differences to known measurement behaviour.
Describe what the display brightness or colour actually represents before using an image to classify material. Contrast is evidence of a measured difference, not universal proof of composition, identity or diagnosis.
10. Dynamic range and saturation limit available evidence
A detector can represent a finite range of signal values. If a bright region reaches the system’s upper limit, distinct signal intensities may collapse to one saturated value. At the lower end, weak signals can be difficult to separate from noise. A displayed image may hide both problems through automatic brightness adjustments.
Exposure and acquisition settings matter for the intended measurement. A photograph with attractive overall contrast may lose details in shadows or highlights. Making a region look clearer later cannot reconstruct exact original values that were clipped at acquisition.
An imaging report should document relevant acquisition settings and processing operations. Where some data are saturated or below reliable detection limits, state that boundary rather than treating the remaining image as a complete record.
11. Noise can imitate structure or hide useful detail
Noise is variation in the recorded signal not attributable to the intended feature, arising from factors such as detector electronics, photon statistics, environmental interference or processing. It can obscure weak features and make simple thresholding unreliable. The sources of noise differ among modalities and conditions.
A denoising method can smooth random variation while also removing fine legitimate structure. Sharpening can emphasise noise along with edges. The appropriate balance depends on whether the task is making a picture pleasant to view or measuring a particular property accurately.
The NIST research on image-feature measurement accuracy presents an example of validating processing choices against feature-measurement accuracy. That principle matters more than claiming that any one denoising filter is universally optimal.
12. A signal-to-noise ratio needs a defined model
Signal-to-noise ratio compares a specified measure of signal with a specified measure of noise. There are several conventions, and the result’s meaning depends on the definitions and units used. A simple linear classroom example might compare a mean signal amplitude of fifty arbitrary units with noise standard deviation of five units, giving 50 ÷ 5 = 10.
That number is a dimensionless ratio under the exercise’s assumptions. It is not automatically a ratio in decibels, nor does it tell us which tiny anatomical or material feature a medical image can resolve. Other background contributions and spatial effects may matter to a real task.
Before quoting SNR, identify what counts as signal, how noise was estimated, which region was sampled and how processing affected both. A label saying ‘SNR 10’ without a method is inadequate for a defensible comparison.
13. Illumination, calibration and reference objects matter
Imaging systems used for measurement benefit from known references that allow scale, response and stability to be checked. A ruler or standard test object may help evaluate geometry, while suitable response targets can support comparisons of intensity or colour under specific conditions.
Calibration is not one universal button. A scale reference corrects a different problem from background subtraction or detector response. An image recorded under changed illumination cannot automatically be compared with an older image simply because both were saved as the same file type.
The Measurement and Research roots explain the wider principle: the reference and method must be appropriate to the measurand. Imaging quality is an evidentiary property, not just an aesthetic judgement.
14. Colour can be measured or deliberately assigned
Many scientific images use false colour, mapping a numerical value or wavelength range to a display palette chosen for interpretation. A satellite image may use colours to distinguish measured bands, and a microscopy image may show a fluorescent marker rather than the natural visual colour of a specimen. Such displays can be accurate when their mappings are documented.
Confusion arises when a viewer assumes every red area depicts a visibly red object or interprets a colour boundary as a measured anatomical boundary without checking the scale. Legends, units and metadata are therefore parts of the scientific image.
A responsible caption says whether the colours are natural, enhanced or assigned and identifies what they encode. Colour should also be chosen for accessibility, including users who have difficulty distinguishing some palettes.
15. Microscopy depends on magnification and optical limits
Microscopy extends observation of small structures using lenses and other techniques. Greater magnification can help display features, but it does not guarantee better resolving power. The illumination wavelength, optical system, specimen preparation and detector behaviour can set practical limits.
A stained sample may reveal some structures while suppressing or altering others. A fluorescence signal can identify a labelled molecule under appropriate controls, but it does not automatically demonstrate every biological interaction inferred from the image. Specimen identity and preparation belong in the account.
The NIBIB optical-imaging overview describes microscopy and other optical techniques. Learners should ask which preparation and measurement produced a visible feature, rather than treating magnification as a universal quality score.
16. Ultrasound reconstructs structure from echoes
Diagnostic ultrasound uses high-frequency sound waves and the returning echoes from structures to form images. A transducer produces sound and detects reflections, while the imaging system uses timing and other assumptions to estimate locations or properties. The display is therefore a processed representation, not a photograph taken inside a body.
The NIBIB ultrasound explainer explains the distinction among anatomical and functional ultrasound methods. Image quality and suitability depend on the target, medium, operator and device. Some materials and regions are difficult to image well with ultrasound.
Clinical use requires qualified health professionals and appropriate practice. This educational account explains the physics and inference, not how to perform or interpret a medical examination.
17. X-ray imaging measures attenuation of ionising radiation
X-ray imaging uses ionising radiation passing through an object or body, with different materials attenuating the beam differently. Detectors record transmitted signals that can be displayed or processed into images. The meaning of a bright or dark feature depends on the modality and display convention.
The NIBIB medical X-ray topic explains how medical systems use these interactions. X-ray imaging can reveal structures not accessible through ordinary visible light, but it also involves radiation-related decisions and safety requirements.
Do not infer that a higher-resolution image or greater radiation exposure is automatically the better choice. Clinical justification and imaging settings belong to licensed specialists, while scientific explanations should distinguish physical evidence from interpretation.
18. Computed tomography reconstructs slices from projections
Computed tomography, or CT, commonly uses multiple X-ray measurements from different directions to reconstruct cross-sectional representations. Its mathematical problem differs from taking one ordinary photograph. A reconstruction combines measured information and a model to estimate spatial structure.
The NIBIB computed tomography guide describes how CT measurements are processed into slices that can be assembled into three-dimensional views. Artefacts, motion and reconstruction choices can affect appearance, so a sharp-looking reconstructed boundary is not automatically a directly observed edge.
Medical CT involves ionising radiation, and choice of examination must be made through appropriate professional assessment. This article does not offer diagnosis or individual imaging recommendations.
19. MRI obtains different information without X-rays
Magnetic resonance imaging uses strong magnetic fields, radiofrequency signals and the response of suitable nuclei in tissues to form detailed images. It does not rely on the same X-ray attenuation mechanism as CT. Contrast and appearance depend on the selected acquisition method and properties of the imaged material.
The NIBIB MRI explanation describes how signals are generated and measured. MRI has important safety considerations because of strong magnetic fields and other aspects of the equipment, even though it does not use ionising X-ray radiation.
The lesson is to compare modalities by the property they measure, the information required and their relevant limitations. Images generated by different modalities should not be treated as interchangeable photographs of one subject.
20. Remote sensing makes images of places from measured bands
Earth observation instruments can measure radiation from the land, ocean or atmosphere in selected wavelength ranges. The resulting images may use multiple bands, spatial sampling and processing to reveal patterns in vegetation, water or surface conditions. A colour-composite satellite image is not necessarily what a person would see looking down from the same location.
Atmosphere, cloud, viewing angle, spatial resolution and measurement timing can affect the image. A change in displayed colour might reflect a different sensor or processing method rather than a real change on the ground. Researchers therefore need metadata and calibration before comparing scenes across dates.
Connect imaging science with Astronomy and Environmental Science. Both use image-derived evidence, but scientific interpretation must still match the physical measurement.
21. Image processing cannot recreate all missing information
Filters, sharpening, segmentation and reconstruction can improve the usefulness of recorded images for particular tasks. But processing changes the representation, and some transformations discard information or create structures that resemble real detail. A pleasing before-and-after comparison is not enough to demonstrate measurement improvement.
NIST’s NIST research on image-feature measurement accuracy demonstrates evaluation of image-processing pipelines through reference signals, background noise and feature-measurement accuracy. The principle is to choose processing by a defined measurable objective and independent validation rather than visual preference alone.
Keep the raw or appropriately preserved original where possible, record processing steps and compare results under representative conditions. An image with no reproducible processing history can be difficult to interpret or audit.
22. Machine learning can detect patterns and make errors
Image analysis systems may classify objects, segment regions or rank candidate features. Their performance depends on labelled data, the task definition, imaging conditions and the population to which the system is applied. An algorithm can perform well on familiar examples and poorly when illumination, sensor type or specimen properties change.
A model’s confidence score should not automatically be interpreted as a calibrated probability or the certainty of a scientific fact. Ground truth may also be uncertain, particularly when experts disagree or the relevant feature is difficult to observe. Evaluation needs independent test data and clearly stated labels.
For consequential applications, qualified human oversight and appropriate regulation matter. This chapter addresses evaluation principles, not deployment guidance for clinical diagnostics or other safety-critical systems.
23. Worked classifier example: precision and sensitivity differ
Consider a fictional image classifier tested on a dataset with twelve genuinely positive examples. It correctly identifies ten of them and misses two. It also flags five truly negative examples as positive. The resulting positive predictions total fifteen, of which ten are correct.
Precision, also called positive predictive value in suitable contexts, is 10 ÷ 15 = 66.7%. Sensitivity or recall is 10 ÷ 12 = 83.3%. These measures answer different questions: what fraction of positive flags are correct, and what fraction of actual positives were found?
Neither figure gives the false-positive rate without knowing the total number of negatives, nor does the exercise establish performance for real patients or real scientific specimens. Test population, prevalence, operating threshold and independent validation are all necessary for consequential use.
| Measure | Value |
|---|---|
| True positives | 10 |
| False positives | 5 |
| False negatives | 2 |
| Precision | 10/15 = 66.7% |
| Sensitivity | 10/12 = 83.3% |
24. Metadata records what the image really represents
An image file should carry, through appropriate records, information about its source, acquisition date, scale, sensor, processing and relevant permissions. Cropping or resizing can change its relation to the original field of view. Removing a filename or caption can make an authentic image misleading even when the pixels have not been altered.
A reported measurement also needs the definition of the feature and method used to locate it. Two analysts can draw different boundaries around a fuzzy object; their disagreement may be about the measurement rule rather than the image quality. The result should state the actual rule and uncertainty where relevant.
The Information Science and Research roots explain why provenance and reproducibility matter. A scientifically useful image is both visual evidence and a traceable record.
25. Privacy, consent and responsible publication matter
Images can reveal identities, places and personal or medical information. A scientifically useful picture may still be inappropriate for unrestricted publication if it exposes a person without a legitimate basis. The fact that images are technically easy to copy does not remove privacy or confidentiality duties.
Organisations should define who can view and reuse sensitive images, whether de-identification is adequate and which access controls apply. Some imagery can remain identifying through unusual anatomy, context or metadata even after an obvious name is removed. Consent and legal bases require jurisdiction-specific evaluation.
The Information Ethics and Information Security roots develop these obligations. Scientific transparency can coexist with appropriate protection of personal data.
26. Diagnostic checklist: identify the claim the image can support
Ask what physical signal was measured, how it interacted with the object, how the detector sampled it and what processing followed. Then identify scale, resolution, contrast, noise and conditions that might limit interpretation. A claim about physical dimensions needs more than pixel counts; a claim about material identity needs an appropriate contrast mechanism.
Compare the processed image with relevant references or raw data where the method allows it. If a filter appears to reveal a new feature, test whether the feature survives independent measurement. An appealing image is not a substitute for a validated method.
Write the strongest plausible alternative explanation for a visual pattern: glare, motion, saturation, reconstruction artefact, contamination or a genuine structure. What observation could separate the alternatives?
27. Transfer the lesson into changed conditions
Take the fictional twenty-millimetre field sampled across one thousand columns. If the number of columns doubles with the physical field unchanged, nominal sampling becomes 20 ÷ 2,000 = 0.010 millimetres per column. Does this automatically double true spatial resolution? No. Optical blur, focus, noise and sensor behaviour may still limit resolvable detail.
Now change a classifier test from well-lit microscope slides to images acquired with a different device. Earlier precision and sensitivity do not automatically transfer, even if the algorithm is unchanged. New conditions call for representative evaluation and investigation of failure modes.
These examples demonstrate the gold-standard habit: preserve valid mathematics while updating the measurement model when the physical context changes.
28. Frequently asked questions about imaging science
Is a higher pixel count always a clearer image? No. Lens or sensor performance, motion, sampling and noise may limit usable detail. Is a sharpened image necessarily more accurate? No. Processing can create apparent structure or amplify artefacts.
Does MRI use the same ionising radiation as CT? No. They measure different physical signals, though each method has its own safety considerations. Is a false-colour image automatically fake? No. Assigned colours can faithfully represent measured quantities when the mapping is documented.
Can one image prove a clinical diagnosis or scientific cause? Not without appropriate context, validation and expert evaluation. Does a classifier with 83% sensitivity have 83% precision? Not necessarily; their denominators and meanings differ.
29. Continue through connected eduKate subject roots
For image formation, follow Physics, Optics, Engineering and Image Processing. For measurements and evidence, use Measurement, Statistics and Information Theory. The Astronomy root gives a different scientific setting for measured images.
The NIH/NIBIB imaging science topics, NIBIB optical imaging and NIST research on image-feature measurement accuracy supply primary reference routes. All numerical sampling and classifier examples here are fictional educational calculations, not medical outcomes or real device specifications.
Return to The Gold Standard of Education: Learning Transfers into Life. Explain the signal, test the measurement, recognise uncertainty and adapt when the acquisition conditions change. That is the foundation of imaging science.