
An industrial machine can look perfect until its failure stops an entire factory. The obvious response is to repair it quickly. The more useful question is why it failed, what the organisation learned, whether the repair restored safe service and which intervention is justified next.
The Gold Standard of Industrial Maintenance connects equipment function, failure evidence, workforce safety, condition monitoring, parts, planning and whole-life cost. It treats maintenance as an essential part of service and asset stewardship rather than a count of work orders.
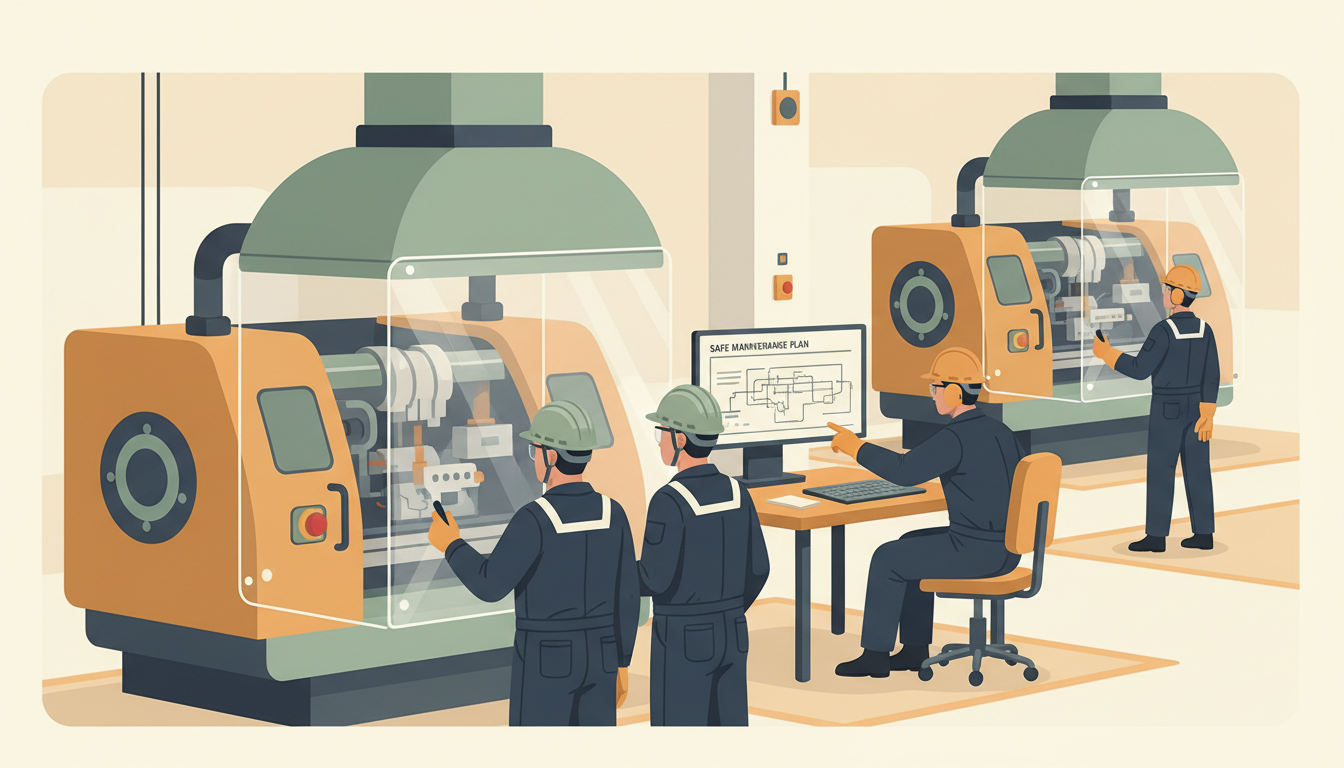
This 44-chapter guide uses ISO 55001:2024, ISO 17359:2018 and NIST’s condition-monitoring research. Three fictional worked cases compare MTBF and MTTR, spare coverage and failure rates. The reused factory illustration represents hazard-control review; it is not a photograph of a particular serviced machine.
Chapter index
Functions, failure modes and safe access · Chapters 1–14
- Maintenance preserves the ability to perform useful work
- Define the asset’s function before listing parts
- Separate maintenance from the wider asset lifecycle
- Build an asset register that can be trusted
- Classify criticality by consequences and exposure
- Distinguish failure modes from symptoms
- Reactive maintenance has legitimate but bounded uses
- Time-based preventive work should target real degradation
- Condition-based maintenance asks what the machine is doing
- Predictive maintenance is not synonymous with machine learning
- Reliability-centred maintenance links functions and consequences
- Use failure mode and effects analysis carefully
- Guard maintenance work against hazardous energy
- Safe access must be designed into maintainability
Condition monitoring, reliability metrics and scheduling · Chapters 15–28
- Inspectors need criteria for an actionable observation
- Plan lubrication with contamination and compatibility in mind
- Vibration monitoring needs comparable conditions
- Thermal inspection requires context
- Oil analysis can reveal trends but not certainty
- Maintenance data must separate failure, repair and delay
- Worked example: MTBF, MTTR and observed availability
- Avoid calculating ‘reliability’ from the wrong population
- Use planned downtime consistently in availability reporting
- Build a schedule around real work windows
- Backlogs should be risk-ranked and visible
- Spare parts strategy balances money and recovery
- Worked example: explain stock coverage without false certainty
- Contractors and manufacturers need clear handoffs
Recovery, cyber resilience, economic decisions and audit · Chapters 29–44
- Root-cause investigation should distinguish triggers and conditions
- Repeated problems justify design or process changes
- Condition-monitoring algorithms have false alarms
- Worked example: compare failures per operating hour
- Maintenance forecasts need uncertainty and action thresholds
- Protect OT systems during repairs and remote support
- Keep a controlled software and parameter history
- Design for rapid but safe recovery
- Emergency plans need known failure scenarios
- Measure work quality, not only labour utilisation
- Life-cycle economics must include production effects
- People and skills sustain physical assets
- Preserve evidence for replacements and retirement
- Conduct a record-to-restoration maintenance audit
- Frequently asked questions about industrial maintenance
- Continue through connected Gold Standard subjects
Quick information: select the intervention for the failure mode
| Approach | Appropriate question |
|---|---|
| Corrective | What failed, what must be restored, what caused it? |
| Preventive | Does this scheduled task reliably reduce degradation? |
| Condition-based | What verified condition calls for action? |
| Predictive | What forecast can improve a real decision? |
| Design change | Does the existing configuration cause repeated failure? |
1. Maintenance preserves the ability to perform useful work
Industrial maintenance plans, inspects, services, repairs and improves equipment so that a plant can operate safely and deliver required output. The objective is not simply preventing every stoppage. Some work requires a planned shutdown; some equipment must be replaced rather than repeatedly repaired. Good decisions balance safety, quality, availability, environment and whole-life cost.
The gold standard measures the service the asset continues to provide, the hazards it controls and the evidence supporting intervention. I begin by asking what a failure would change for people and production, not by counting completed work orders.
2. Define the asset’s function before listing parts
A conveyor moves material at a required rate; a pump delivers flow within a specified pressure range; a chiller removes heat; a protective interlock limits a hazardous state. Maintenance requirements should connect to each asset’s required function and performance standard.
An intact-looking component can have a functional failure if it cannot meet demand. Conversely, replacing a component that has harmless cosmetic wear may consume resources without improving service. Record operating limits, essential functions and failure consequences before prescribing tasks.
3. Separate maintenance from the wider asset lifecycle
Asset management considers needs from acquisition through operation, renewal and disposal. Maintenance is one important contributor, but cannot always compensate for poor selection, inadequate design, overloaded production or wrong location.
The ISO 55001:2024 asset-management requirements connect decision-making to asset value, risks and lifecycle processes. A preventive maintenance schedule is not itself a complete asset-management system.
4. Build an asset register that can be trusted
Every critical machine needs a stable identifier, location, manufacturer, configuration, relevant drawings, installation date, support contact, spares and safety information. Record components in an understandable hierarchy rather than relying on the nickname operators use on one shift.
A useful register also identifies who owns the asset and its data. Equipment reinstalled in a different position may have a new duty and risk profile; its history should move with the appropriate physical asset without losing the circumstances of earlier repairs.
5. Classify criticality by consequences and exposure
Criticality reflects the consequences and likelihood or exposure of failures for safety, environment, product quality, operations and cost. Two identical motors may warrant different maintenance attention when one is redundant and the other serves a single essential function.
Make the rating method explicit and review it after process changes. A large replacement cost does not automatically outrank a modest device whose failure could create dangerous conditions. Avoid a single opaque score that hides the risk category driving the decision.
6. Distinguish failure modes from symptoms
A symptom is what someone observes: unusual noise, vibration, heat, leakage or reduced throughput. A failure mode describes how a component or system fails to meet its requirement; causes may include wear, contamination, misalignment, design conditions or human error.
Investigate without assuming every symptom points to one familiar cause. The same elevated temperature might result from load, cooling failure or sensor error. A work order should preserve observations and verified findings separately so that later trends are interpretable.
7. Reactive maintenance has legitimate but bounded uses
Run-to-failure can be reasonable for inexpensive, noncritical and easily replaceable items where failure creates limited harm and recovery is straightforward. It is inappropriate to apply the same logic blindly to equipment whose failure threatens safety or causes major unplanned losses.
Document the chosen strategy and its justification. A team that repairs only after breakdown may appear to have low preventive spending while carrying high production, quality and safety costs not shown in its maintenance ledger.
8. Time-based preventive work should target real degradation
Preventive activities can include inspections, lubrication, cleaning, adjustment and planned replacement at defined intervals. They are useful when failure behaviour, operating conditions and risk support the selected tasks.
Not every failure is age-related, and opening a healthy system unnecessarily can introduce damage or contamination. Review task effectiveness and intervals using evidence rather than copying the same monthly checklist to every machine in the factory.
9. Condition-based maintenance asks what the machine is doing
Condition-based approaches use observations such as vibration, temperature, wear indicators, oil characteristics or performance trends to guide interventions. They require sensing methods, trustworthy baselines and a valid relation between observed conditions and potential failure.
The ISO 17359:2018 standard sets general guidelines for machine condition-monitoring programmes. Collecting sensor readings without a response process is not a functioning maintenance strategy.
10. Predictive maintenance is not synonymous with machine learning
Prediction can be based on engineering models, measured degradation trends, statistical methods or learned algorithms. The word ‘predictive’ should describe an actionable forecast with a known horizon and limitations, not merely a colourful dashboard.
The NIST 2025 systematic review discusses the need to evaluate engineering and financial benefits of condition-monitoring technologies. A model’s anomaly score does not guarantee it has found an impending failure.
11. Reliability-centred maintenance links functions and consequences
Reliability-centred maintenance approaches examine functions, potential failures, failure consequences and the suitability of available preventive, predictive or corrective tasks. The logic is risk-specific: some failure modes benefit from inspection while others need design change or protective functions.
Do not turn the method into a checklist that assumes every task reduces failure likelihood. Document the rationale for choosing or rejecting actions and revisit assumptions when duty cycles, equipment or service expectations change.
12. Use failure mode and effects analysis carefully
FMEA or similar methods can organise how a component might fail, its effects, controls and priorities. Scales for severity, occurrence and detectability need clear definitions; multiplying arbitrary scores can conceal a high-severity hazard.
Ensure critical risks remain visible separately from aggregate rankings. Engineers should test whether proposed controls actually address the identified failure mechanism, rather than merely lowering a subjective risk number in a worksheet.
13. Guard maintenance work against hazardous energy
Industrial equipment can retain electrical, pneumatic, hydraulic, thermal, gravitational and mechanical energy after shutdown. A normal stop button does not necessarily isolate every source. Servicing arrangements need authorised, tested energy-control procedures and competent personnel.
The US OSHA lockout/tagout guidance describes hazards from unexpected startup or stored energy. Its US-specific legal rules do not replace Singapore requirements. No generic article can supply isolation instructions for an actual machine.
14. Safe access must be designed into maintainability
Filters, bearings and wear parts may need periodic attention; their location affects whether a task can be completed safely. Poor access can encourage shortcuts, expose workers to moving parts or require awkward lifting and work at height.
Review maintainability when buying or modifying equipment. Examine lifting provisions, reach distances, lighting, guarding and safe work space under a qualified risk assessment. A machine’s price excludes many future risks if those features are ignored.
15. Inspectors need criteria for an actionable observation
An inspection should say what to observe, acceptable conditions, measurement method, frequency, limitations and response to abnormal findings. Vague checklist entries such as ‘check machine’ create paperwork without a repeatable assessment.
Record observations in standard language with relevant photographs or readings where safe. An issue should have severity, owner and target action. Do not count inspections completed as evidence that abnormalities were resolved.
16. Plan lubrication with contamination and compatibility in mind
Lubrication can reduce friction and wear, but the wrong product, volume or method can damage components. Clean storage, identification and compatible handling are often as important as nominal servicing frequency.
Follow equipment-appropriate professional instructions and verify that work does not introduce contamination. A maintenance record should distinguish planned service from evidence of improved performance. Do not infer bearing health from the mere fact that oil was added.
17. Vibration monitoring needs comparable conditions
Measured vibration varies with speed, loading, sensor location, mounting and processing. A trend from measurements taken at incompatible operating states may appear to show deterioration when the process changed instead.
Record the acquisition setup and machine condition with each measurement. Investigate possible misalignment, looseness and other causes with qualified engineers. An instrument reading is evidence to interpret, not a substitute for inspection and diagnostic reasoning.
18. Thermal inspection requires context
Infrared and contact temperature measurements can help reveal abnormal heat, but interpretation depends on emissivity, reflection, environment, load and measurement geometry. Apparent temperatures are not necessarily the physical temperatures at the suspected component.
Compare like-for-like equipment states, maintain instrument calibration and use appropriate electrical and mechanical safety precautions. Never open energised equipment based on a general article; specialised inspection requires approved work practices and qualified people.
19. Oil analysis can reveal trends but not certainty
Oil sampling may identify wear particles, contamination, viscosity changes or other conditions relevant to machinery. Sampling location, operating period and laboratory method strongly affect comparability. A single abnormal sample needs investigation rather than a reflexive component replacement.
Preserve method and chain-of-custody evidence. Trends are more useful when sampling conditions and fluid history are consistent. An oil-analysis score alone cannot establish an exact remaining useful life.
20. Maintenance data must separate failure, repair and delay
A breakdown can include fault detection, waiting for approval, waiting for parts, active repair, testing and return to production. These durations answer different questions. Mean repair time is not automatically the same as total calendar downtime.
Record start and end events consistently. A work order closed two days later might reflect a short technical repair and a long parts delay. The improvement response should address the limiting stage rather than treating all lost time as technician performance.
21. Worked example: MTBF, MTTR and observed availability
In a fictional 720-hour scheduled operating window, a machine suffers eight breakdowns and accumulates 48 hours of corrective downtime. Assume there is no other downtime, and operating time totals 672 hours. Mean operating time between failures is 672 ÷ 8 = 84 hours, while mean corrective downtime per breakdown is 48 ÷ 8 = 6 hours.
Under these definitions, 84 ÷ (84 + 6) = 93.33% availability, matching 672 ÷ 720. These are retrospective sample measures, not predictions for the next month, and the familiar ratio depends on consistent definitions and simplifying assumptions.
22. Avoid calculating ‘reliability’ from the wrong population
Failure rates differ with operating hours, starts, loads, age and environment. Comparing raw breakdown counts across machines running different schedules is misleading. Track an appropriate exposure measure, such as operating hours, cycles or kilometres.
Define what counts as failure and the at-risk population. Repaired units can return to service with different conditions. A statistical model requires more than dividing a count by a convenient time interval.
23. Use planned downtime consistently in availability reporting
Overall equipment availability and contractual availability may exclude or include planned shutdowns differently. Both can be useful if definitions are disclosed. A high availability figure that excludes all planned maintenance says little about total capacity available for customer demand.
Publish numerator, denominator, time window and exclusions. Avoid switching conventions from month to month. Users can then distinguish time lost to planned care from time lost to unexpected failure.
24. Build a schedule around real work windows
Maintenance planning needs task scope, estimated duration, competent staff, necessary permits, equipment isolation, parts, tools and operational access. Scheduling coordinates this approved work with production, rather than booking an impossible two-hour job into a one-hour window.
Confirm the machine is safely ready for servicing before work starts. A schedule’s apparent efficiency should not pressure people to skip hazard checks or functional tests during return to service.
25. Backlogs should be risk-ranked and visible
A maintenance backlog includes work that has been identified but not completed. Some items are legitimately planned far in advance, while others represent unresolved risk. A large backlog count alone cannot determine whether performance is improving or deteriorating.
Separate safety-critical, production-critical and low-risk tasks, and track overdue work against approved deadlines. Give every item a responsible owner and decision record. Repeatedly deferring one serious defect is not balanced by closing hundreds of cosmetic tasks.
26. Spare parts strategy balances money and recovery
A part that costs little but has a long supply lead time can cause expensive downtime. Conversely, stocking every possible replacement may waste space and capital or lead to obsolete inventory. Examine failure frequency, lead time, criticality, interchangeability and alternatives.
Document supplier reliability and storage requirements. Test whether stocked spares actually fit installed configurations and firmware. A nominal inventory number can conceal parts that are incompatible or degraded.
27. Worked example: explain stock coverage without false certainty
A fictional machine uses an average of two spare seals per month, and the normal replenishment lead time is three months. Six seals on hand equal 6 ÷ 2 = three months of coverage at the assumed average consumption. The expected lead-time requirement is also 2 × 3 = six seals.
That equality provides no safety buffer for demand bursts, supplier delays or defective stock. An actual reorder-point calculation must model variability and service consequences, not claim that average stock coverage guarantees uninterrupted service.
28. Contractors and manufacturers need clear handoffs
Maintenance may involve equipment manufacturers, specialist service firms and internal teams. Contracts should describe access, competencies, safety coordination, test results, parts ownership, documentation and post-repair obligations.
Do not accept an invoice as the sole evidence of restored machine performance. Require an authorised technical handover with fault findings, completed work, outstanding restrictions and verification of operating readiness.
29. Root-cause investigation should distinguish triggers and conditions
A failed bearing might be triggered by immediate overload while an underlying lubrication procedure or alignment issue contributed over months. Replacing the bearing alone may restore production without preventing recurrence.
Build a timeline and test competing explanations against actual evidence. Avoid attributing a problem automatically to the last person who touched the asset. Human actions occur within design, staffing, training and workload conditions that may need improvement.
30. Repeated problems justify design or process changes
Recurring failure may indicate that replacing parts faster is the wrong strategy. Options can include improved material selection, additional filtration, modified duty, vibration isolation or changed operating limits, subject to qualified engineering assessment.
Compare the expected benefit and risks of redesign with ongoing repair costs and downtime. A change can solve one mode while creating another, so validate the new configuration and update technical documentation.
31. Condition-monitoring algorithms have false alarms
Anomaly detectors can flag healthy machines or miss developing faults. The usefulness of an alert depends on validated operating populations and the relative consequences of missed and unnecessary interventions.
Compare precision, recall, time-to-detection and lead time under real operating conditions. A high ‘accuracy’ value is weak evidence when failures are rare, since a model that always predicts healthy could also score highly.
32. Worked example: compare failures per operating hour
Suppose a fictional production line experiences 18 failures over 1,800 operating hours before a programme, or 10 failures per 1,000 hours. Afterwards, it experiences 10 failures over 2,400 operating hours, or about 4.17 per 1,000 hours.
The observed failure-rate reduction is (10 − 4.17) ÷ 10 ≈ 58.3%, whereas raw failure count declined by 44.4%. Neither calculation alone proves the maintenance programme caused improvement: load, equipment age, definitions and other changes need assessment.
33. Maintenance forecasts need uncertainty and action thresholds
Predictive models may estimate time to failure, remaining useful life or probability of deterioration, but these quantities depend on data, assumptions and machine state. A probability forecast should have a known time horizon and operational response.
Document when staff must inspect, plan or replace and when prediction should be ignored or escalated. A confident chart that cannot support an actionable decision is an expensive reporting feature rather than useful maintenance.
34. Protect OT systems during repairs and remote support
Maintenance often requires access to controllers, drives, diagnostic laptops and vendor services. Poorly managed updates, shared credentials or removable media can disrupt the process or expose operational technology to security threats.
The NIST SP 800-82r3 guidance addresses OT constraints. Coordinate access, backups, patching and testing with qualified operations staff. Security improvements must preserve safe control and recovery.
35. Keep a controlled software and parameter history
Machine behaviour can depend on firmware, PLC programmes, control recipes, calibration values and interlock parameters. Record versions and approval evidence, and keep compatible backups that can actually be restored.
An old drive module may accept a configuration that behaves differently from the installed software. Validate compatibility before changes. Never treat an unauthorised download to a live controller as a routine maintenance shortcut.
36. Design for rapid but safe recovery
Mean time to repair can improve through accessible components, clear diagnostics, trained teams, proper spares and validated recovery procedures. However, reducing the recorded time is not success if it leads to an unsafe restart or repeated breakdown.
Return-to-service checks should verify required function, protection, product quality and communications. An asset should not be declared operational merely because its motor runs again.
37. Emergency plans need known failure scenarios
A critical pump, power system or ventilation unit may require a contingency plan for severe failure or prolonged outage. Identify essential loads, temporary alternatives, competent decision-makers, communication routes and circumstances requiring shutdown.
Test plans in safe exercises and update them when equipment or contractors change. A written emergency procedure that no one can execute under realistic constraints provides little assurance.
38. Measure work quality, not only labour utilisation
Technician utilisation and number of completed tasks can be easy to report, but they can reward superficial work orders or discourage diagnosis. Better outcomes include reduced repeat defects, verified machine function, safe servicing and fewer avoidable interruptions.
Maintain a balanced scorecard with safety, quality, reliability, response time and cost. Explain definitions and sampling. The gold standard is that work improves the asset’s service without creating hidden risk.
39. Life-cycle economics must include production effects
A low maintenance budget may coincide with high lost production, waste and expensive emergency replacement. Conversely, excessive intervention can spend money and introduce failures without meaningful benefit. Compare strategies on comparable output, risk and equipment duty.
Include direct labour, spares, vendor fees, planned interruption, lost margin where appropriate, energy and quality effects. Expose assumptions and use sensitivity cases rather than presenting one speculative savings figure as a guaranteed return.
40. People and skills sustain physical assets
Operators, planners, technicians, engineers and contractors hold different knowledge about what the equipment does. Training, handovers and accessible documentation reduce dependence on one experienced individual and help identify developing problems.
Invite operators to describe changes in sound, handling or throughput, then check reports against evidence. Staff feedback is a valuable input but not a substitute for qualified diagnostic work. Maintenance culture should support reporting before failure becomes dramatic.
41. Preserve evidence for replacements and retirement
When a machine approaches economic or technical end of life, compare continued repair with refurbishment or replacement under the intended service requirement. Obsolescence of parts and controls may matter as much as mechanical wear.
Document retirement criteria, safe decommissioning and preservation of relevant records. A fully depreciated accounting value does not mean a machine has no use, just as ongoing repairs do not automatically prove extending it is economical.
42. Conduct a record-to-restoration maintenance audit
Choose a consequential completed job and trace its initial symptom, asset history, risk assessment, safe work authorisation, diagnosis, parts, actions, functional tests, data updates and return to production. Verify which facts are observed, inferred or still uncertain.
Stress-test the evidence: what if the failure recurs tomorrow, a spare is unavailable or a controller version changes? Another competent team should be able to understand the decision and recover safely without relying on undocumented personal memory.
43. Frequently asked questions about industrial maintenance
Does preventive maintenance prevent every breakdown? No. Is predictive maintenance always artificial intelligence? No. Does a high availability percentage imply safe servicing? No. Can equipment be traceably monitored but still fail? Yes.
Are breakdown count and failure rate the same? No; operating exposure matters. Is a completed work order proof that the root cause was fixed? No. Can a spare in the warehouse guarantee rapid restoration? Not if it is incompatible, damaged or cannot be installed safely.
44. Continue through connected Gold Standard subjects
Read Industrial Safety, Industrial Hygiene, Industrial Automation, Instrumentation Engineering, Industrial Metrology and Risk Management for related decisions.
Primary references: ISO 55001:2024, ISO 17359:2018, NIST’s condition-monitoring evaluation review and OSHA hazardous-energy guidance. The numerical examples are fictional teaching calculations, not maintenance instructions or certification of an actual workplace.