
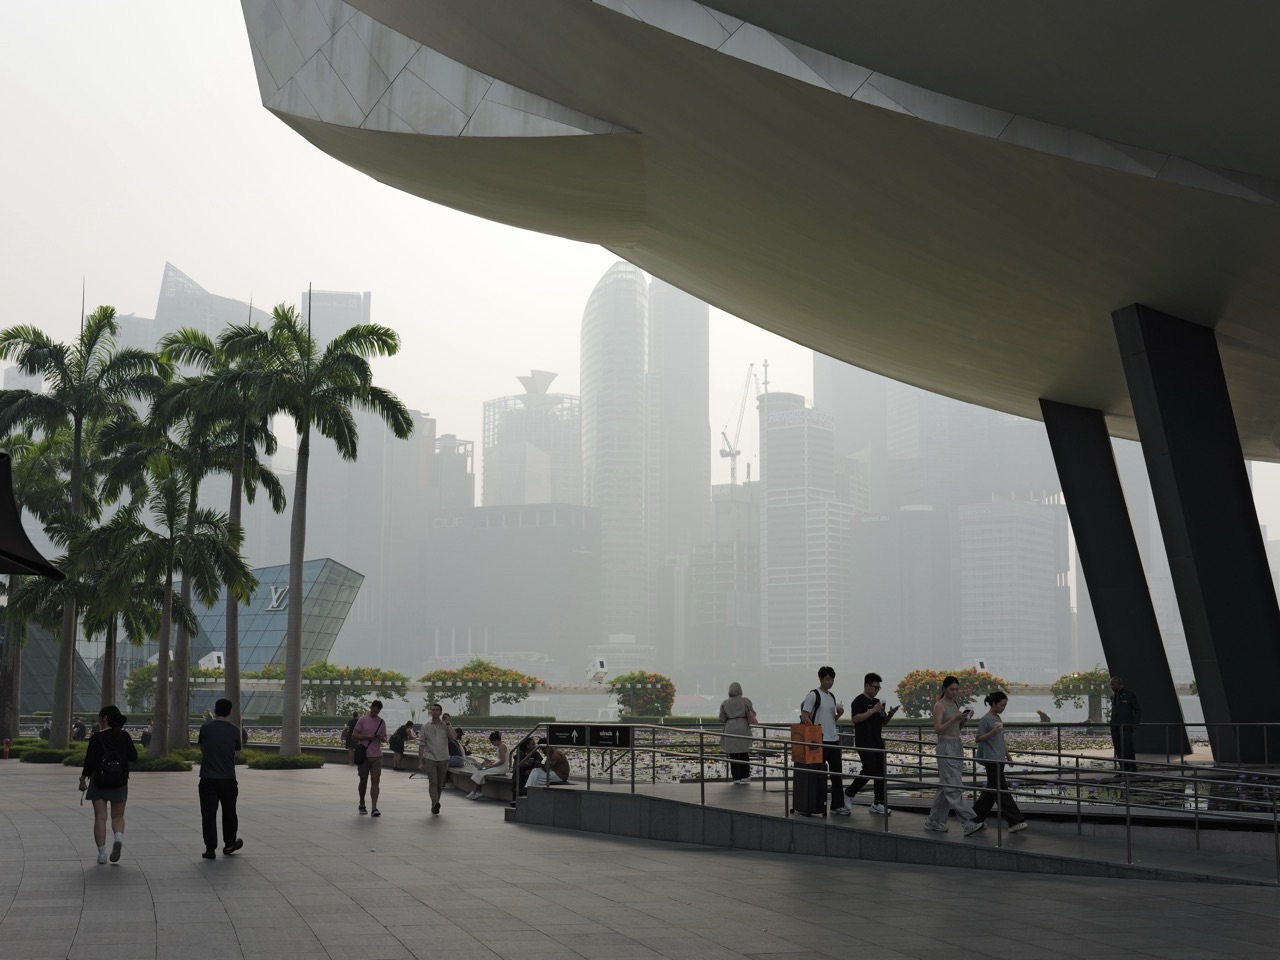
Should you buy a PM2.5 monitor for your HDB flat when Singapore’s haze returns? A reliable indoor sensor can help you notice changes in the room where your family actually spends time, but it does not replace NEA’s official one-hour PM2.5 and 24-hour PSI reporting, and a cheap numerical display cannot prove that a particular source caused a spike. Before buying anything, decide what question you need answered: whether your living room accumulates smoke, whether cooking briefly increases particles, or whether a correctly sized air purifier appears to reduce them. Follow MOH’s personal haze health guidance for outdoor activity decisions; use a consumer monitor as supplementary information, not medical clearance.
This Singapore haze home PM2.5 sensor guide explains what air-quality monitors measure, how optical particle sensors work, why humidity and placement affect readings, when a sensor’s number should not be compared directly with PSI, and how to test an air-cleaning setup without pretending your home is a laboratory. It is written for HDB residents, families with children, home-office workers, teachers, researchers and people with existing respiratory conditions. It includes worked examples of room volume, CADR, time-series readings and source investigation, plus questions to ask before purchasing or hiring professional indoor-air testing. The companion Singapore Haze HDB Windows, HEPA and CADR Guide focuses on home ventilation and air cleaning; this article focuses on measurement.
The US Environmental Protection Agency’s consumer indoor-monitor guidance notes that lower-cost monitors can help people identify changes in some pollutants, while their accuracy depends on placement, temperature, humidity, processing and the contaminants present. In Singapore, NEA’s public air-pollution FAQ explains why data from low-cost sensors or third-party websites may not be comparable with the official PSI. These are complementary facts: a household sensor may be useful for household patterns without becoming an official government air-quality station.
First, choose the question before the device
People buy sensors for different reasons. One parent wants to know whether closing a smoky balcony door changes their child’s bedroom particles. Another wants to understand why a purifier’s indicator turns red during cooking. A teacher wants pupils to explore environmental data. A third person wants to prove which neighbour is smoking. Those are not equivalent questions and cannot all be answered by one inexpensive monitor.
For a practical household question, start narrowly: “Does the PM2.5 display rise during cooking and fall afterward?” or “Are readings more consistent after we manage the outdoor-air entry point?” Keeping the question modest helps separate useful observation from unsupported inference.
A consumer monitor may detect fine-particle changes, but cannot identify the chemical composition, source, origin or medical significance of every reading. Elevated PM2.5 can come from outdoor smoke, cooking, incense, indoor smoking or other particle-producing activities. The device does not automatically know the story.
If the goal is a professional building assessment or a regulatory dispute, a consumer monitor may not be the appropriate evidence. Consult qualified professionals and the relevant authorities instead of promising courtroom-grade attribution from a household gadget.
PM2.5 is a concentration, PSI is an index
PM2.5 refers to particulate matter with aerodynamic diameter about 2.5 micrometres or less, measured as a mass concentration such as micrograms per cubic metre. The Singapore one-hour PM2.5 reading helps households make immediate outdoor-activity choices. The 24-hour PSI is a pollutant-based index and is not expressed in the same units.
MOH uses one-hour PM2.5 bands of Normal 0–55, Elevated 56–150, High 151–250 and Very High at 251 or more micrograms per cubic metre. This is the personal activity guide for the immediate hour. A consumer sensor that displays “18” may report an indoor PM2.5 estimate, but it is not the same thing as a regional PSI of 18 and cannot be substituted into all the official categories without considering the measurement system.
Some devices display a manufacturer-defined AQI or colour code instead of raw PM2.5. Different countries, products and apps may apply different index formulas or concentration breakpoints. A red indicator on one device does not necessarily mean Singapore’s official PSI is in the same colour category.
Choose a monitor that clearly identifies its measured pollutant, units, time averaging and display meaning. A large glowing number is not helpful if nobody knows what it represents.
Why a low-cost optical sensor can see particles
Many consumer PM2.5 monitors use an optical method. Air is drawn or allowed into a sensing chamber, particles scatter light, and the electronics estimate concentrations using a model. This can be useful for tracking changing particle levels, especially when the device is designed and calibrated appropriately.
But the sensor is not weighing every particle individually. Its conversion from optical signal to mass depends on assumptions about particle size, optical properties and the mixture in the air. Smoke, cooking aerosols, dust and water droplets can produce different responses. That is one reason monitors may disagree.
Two units of the same brand can also differ due to calibration, ageing, contamination or airflow. A unit that reports exactly the same number in every setting may simply be averaging or rounding strongly. A device that fluctuates with cooking may be detecting a real change, but that does not prove its absolute numerical accuracy.
The appropriate conclusion is that sensors provide estimates whose quality must be understood. A single reading is not a scientific verdict without context.
Singapore humidity is an important complication
Singapore’s humidity can affect some optical particle sensors because airborne droplets and moisture-related particle growth change how light is scattered. A sensor may respond differently when the relative humidity rises, even when the amount of dry particulate matter has not changed in the same proportion.
This does not mean all high readings on humid days are fake. Pollution can be real and humidity can affect measurement at the same time. The right approach is to record humidity where possible, avoid drawing conclusions from one dramatic jump and refer to the device’s performance information.
The US EPA sensor guide specifically identifies relative humidity and temperature as factors affecting measurement. This is especially relevant when moving a device between an air-conditioned bedroom and an open balcony. The environment and operating conditions change simultaneously.
Do not try to “correct” a consumer reading with a made-up percentage subtraction based solely on the fact that Singapore is humid. Proper sensor corrections require validation for the device and its conditions.
Where should a home PM2.5 sensor sit?
A useful starting position is where people actually spend time: a living room seating area, a desk or an appropriate safe location in a bedroom. The US EPA’s indoor sensor placement guide recommends representative placements near typical breathing height, with free airflow, away from walls, corners, direct draughts, doors, cooking equipment and air-cleaner outlets.
A monitor sitting immediately beside a kitchen stove may register a dramatic local peak that is not representative of the entire HDB flat. A monitor pressed against a purifier outlet may show unusually low values compared with the air where people are sitting. Both observations may be real but answer different questions.
If investigating a bedroom, choose a safe position that does not add trip hazards, dangling power cords, unstable furniture or objects near a baby’s sleep space. The reading is not worth creating an electrical or suffocation hazard.
Keep the placement consistent across a comparison. Moving the sensor to a different height or room during a test can create an apparent improvement that is actually a location change.
Why a monitor beside a purifier can mislead
Air purifiers draw air through filters and release cleaned air into the room. A sensor close to that outlet may show low PM2.5 even if the rest of the space has not mixed fully. Likewise, a sensor placed at a window opening may read more outdoor pollution than the centre of the room.
To compare an air-cleaning setup, keep the sensor in a representative location where occupants spend time, rather than optimising for the lowest number. Use the same position before and after any change, and allow for normal changes in background concentration. A single device cannot map every corner of a complex flat.
A portable purifier’s performance also depends on room volume, CADR, setting, filter condition, doors and continuing particle sources. A high-CADR model placed in the wrong room may achieve less than expected for the people it is meant to protect.
Our HDB Windows, HEPA and CADR Guide explains the practical device and room considerations.
What NEA’s official network can tell you
NEA’s national monitoring network uses specialised instruments to report ambient conditions and provide air-quality updates. The readings are designed for consistent public reporting and the official health advisory. They are not an hourly live measurement in every bedroom, MRT platform, shopping centre or park pavilion.
A Singapore resident might see an official PM2.5 band for their broad area and a different estimate inside the home. There is no contradiction: the locations, instruments, airflow and sources differ. The national system answers the regional outdoor question; the home device estimates conditions at its own sampling point.
The NEA public FAQ cautions that unofficial AQI values may follow different methods and low-cost sensors. Comparing their colour categories directly with Singapore’s PSI can be misleading.
Use official NEA measurements for outdoor health advice even if a household monitor shows a lower number. An indoor reading does not create a free pass for an outdoor run.
Can an air sensor reveal which neighbour is smoking?
Not reliably. The Singapore Ministry of Sustainability and the Environment stated in November 2024 that indoor monitors can detect fine particles and volatile organic compounds emitted by smoking, but cannot distinguish whether the particles came specifically from smoking or identify their origin or location. Cooking and incense can also elevate PM2.5.
This matters in HDB living because a sensor graph may rise around mealtime or when a window is open. The increase is a measurement of a signal, not direct evidence of a named person’s behaviour. Do not use a consumer sensor to publish allegations against neighbours without independent evidence.
If there is a genuine nuisance or health concern, keep factual observations and approach the appropriate channels. Do not install intrusive surveillance or use unverified air-sensor data to infer private household activity.
The goal of measurement is to make the home more comfortable and understand exposure, not to convert uncertainty into blame.
Cooking is a common reason for an indoor spike
Frying, grilling, toasting and other cooking activities can release particles indoors. A PM2.5 monitor may rise sharply while a meal is prepared, even if outdoor haze is moderate. This does not prove the outdoor air suddenly became worse; the timing and source are important clues.
The best first control is appropriate cooking ventilation and reducing unnecessary indoor smoke. A purifier may help particles in a suitable room, but it is not a replacement for safe kitchen exhaust or source control. Avoid turning on a questionable device that generates ozone as a supposed shortcut.
Record the time of cooking and what changed. When practical, compare a normal cooking session before and after a reasonable ventilation improvement while keeping the sensor location consistent. The aim is to understand patterns, not claim a laboratory-certified emission reduction from one meal.
A family can turn this into a science activity without exposing children deliberately to smoke. Use already occurring household events and discuss why a time series has peaks and baseline values.
Incense, cleaning sprays and indoor particles
Incense and candles generate combustion emissions, while aerosols and some cleaning processes can introduce particles or other indoor contaminants. When regional haze is already affecting comfort, adding these sources makes the household response more complicated.
A sensor designed for PM2.5 may register some particle-producing activities, but it may not detect many gases or volatile chemicals. A low numerical PM2.5 display does not mean the room is free of every pollutant. A device that measures volatile organic compounds may also respond broadly without identifying the chemical source.
Avoid unverified “smoke-neutralising” fragrances. They may cover an odour while adding other substances to indoor air. Source reduction, appropriate ventilation and effective particle filtration are a stronger foundation.
If there has been recent renovation, painting or furniture installation, the indoor-air problem may include formaldehyde or other chemical concerns not captured by a PM2.5 sensor. Seek qualified assessment for an actual chemical investigation.
Formaldehyde and TVOC readouts are not PM2.5
Some consumer monitors combine PM2.5 with “TVOC,” carbon dioxide or formaldehyde displays. These refer to different measurements. Fine particles, gases and carbon dioxide do not have identical sources, meanings or health interpretations. A single high PM2.5 value cannot be used to infer a specific formaldehyde concentration.
NEA’s January 2026 formaldehyde guidance cautions that low-cost formaldehyde sensors may have limited accuracy and recommends calibrated meters or appropriately accredited laboratory testing when reliable measurements are required. This is important for new furniture and renovation disputes.
Do not use an attractive all-in-one display as proof that the room meets every indoor-air guideline. Understand which pollutant is being measured and whether the instrument has credible independent performance evidence.
For building-specific investigations, a trained and appropriately accredited professional may be more appropriate than purchasing a series of consumer gadgets.
CO2 is useful for a different question
Carbon dioxide sensors can help evaluate aspects of ventilation in occupied spaces under appropriate conditions. But a CO2 value does not measure smoke PM2.5 concentration. A room can have adequate CO2 control and still admit outdoor fine particles during a haze episode, or have low particles while other ventilation concerns exist.
A monitor showing several coloured icons may encourage the user to collapse all measurements into “good” and “bad.” Resist that temptation. Each measurement answers a different question and has its own limitations.
For a school classroom or tuition room, it can be educational to compare CO2 and PM2.5 patterns during ordinary activities, without exposing students to pollutants as an experiment. The lesson is that indoor environments have multiple dimensions.
For office ventilation and filter maintenance, see Singapore Haze at the Office.
Worked example: PM2.5 readings before and after a change
Imagine a household monitor consistently positioned in an HDB living room. Before dinner, it displays 16 micrograms per cubic metre. During ordinary cooking, it rises to 64, and an hour later it falls to 22 after cooking stops and the room is managed appropriately. These are hypothetical readings for explanation, not measurements from a real flat.
The simplest justified observation is that the instrument reported a temporary increase and subsequent decrease. It is reasonable to investigate cooking as a likely contributor because the change aligned with the activity. It is not justified to announce a precise personal health risk, blame regional Sumatra smoke for the peak or claim a particular purifier removed a known percentage without controlled comparison.
Now repeat the general observation over several days, keeping the sensor position similar and noting opening of doors, fan operation, cooking and outdoor conditions. Patterns become more informative than one dramatic peak. An independent instrument can help validate concerns if accuracy matters.
The family should still avoid deliberately generating smoke for an experiment. Ordinary observation is enough to teach the basic method.
Worked example: room volume and CADR
Consider a bedroom measuring 4 metres by 3.5 metres, with a 2.7-metre ceiling. The volume is 4 × 3.5 × 2.7 = 37.8 cubic metres. A simple illustrative particle-cleaning target of three times the volume per hour gives 113.4 cubic metres per hour of smoke CADR, before accounting for other room and equipment factors.
This is a conceptual illustration, not a professional design specification or universal rule for every HDB room. A purifier’s actual cleaning depends on its tested smoke CADR, chosen fan setting, filter condition, air mixing, outside infiltration and particle sources. A sensor reading near the outlet cannot independently verify the full-room performance.
A person comparing devices should distinguish CADR from claimed floor area and from energy consumption. A higher wattage does not automatically mean a higher effective smoke CADR. A large number printed on a package is useful only when the test method and operating setting are understood.
For the full HEPA decision process, use Singapore Haze HDB Windows and Air Purifier Guide.
Why purifier indicator lights and separate sensors disagree
Some air purifiers have built-in sensors, while an independent monitor may sit elsewhere. Their readings can differ because of location, calibration, sensor method, averaging interval or room mixing. A device beside the purifier’s own air intake may detect a different particle concentration from one near a balcony door.
This difference does not automatically prove that one manufacturer is fraudulent. It does, however, mean that a consumer should be cautious about claiming a precise purification result from one light changing colour. The purifier’s CADR and maintenance may provide more reliable product-performance information than a glossy app animation.
To investigate, keep both sensors in comparable locations for a period if doing so is compatible with their instructions, and observe whether their trends broadly agree. A consistent difference in absolute values may reveal calibration differences. Do not substitute a casual comparison for a formal instrument evaluation.
For high-stakes indoor-air assessments, use qualified professionals and credible methods instead of a family argument about which screen is “correct.”
How long should a sensor settle before interpreting it?
Different products use different sampling intervals, averaging and warm-up behaviour. Some refresh quickly but smooth their displayed value; others require a stabilisation period. The manufacturer should explain the expected operating method. Do not invent one universal five-minute warm-up for every sensor.
A responsible home observation records the time, room, device placement, activities and major changes. Waiting for readings to become reasonably stable in an unchanged environment can be useful, but a device that repeatedly drifts or reports implausible numbers may need service, calibration or replacement.
Low-cost sensors also age. Dust, fan condition, optical contamination and environmental exposure may affect performance over time. A high-resolution graph does not guarantee accuracy if the underlying instrument is not maintained.
The EPA Enhanced Air Sensor Guidebook provides a broader framework for defining a question, setting up measurements, collecting data and evaluating performance.
Accuracy versus precision: an everyday explanation
Accuracy describes how close a measurement is to an appropriate reference value. Precision describes how repeatable readings are under comparable conditions. A device can consistently report values that are too high and therefore be precise without being accurate. Two devices may also agree by coincidence or share similar biases.
Imagine a reliable reference measured 20 micrograms per cubic metre, while a consumer monitor repeatedly reported 30. It may show useful trends but not the right absolute level. A second monitor jumping between 12 and 36 might have a different repeatability issue. The examples are hypothetical, and actual evaluation requires controlled conditions.
NEA’s research on low-cost sensors in Singapore conditions has recognised the importance of calibration and performance under local humidity and temperature. This is not a blanket approval of every commercial home monitor.
Before buying, look for credible independent testing, a defined pollutant and units, meaningful operating limits and maintenance support.
What should parents do with high readings in a child’s room?
First check whether the sensor is operating as intended and placed appropriately. Was it beside a humidifier, window, purifier outlet or cooking source? Has someone used aerosol spray? Is the reading persistent or a brief spike? Make a practical source-control check without asking the child to remain in a room that is clearly uncomfortable or smoky.
Children are a vulnerable group under MOH haze advice for outdoor activity. Indoor sensor data may support household decisions, but they do not diagnose the child’s asthma or establish medical safety. Symptoms and any clinician-prescribed plan remain central. If a child has worsening wheeze or severe difficulty breathing, seek medical attention promptly.
A suitable air cleaner may help reduce particles when correctly sized and maintained. But do not surround an infant’s cot with improvised filters, plastic sheeting or unsafe electrical devices. Physical safety remains essential.
For infant-specific care, use Singapore Haze and Babies.
Small-group classrooms and educational use of sensors
A science class can learn a great deal from a properly explained PM2.5 time series without deliberately creating smoke. Students can compare official NEA readings to the questions answered by a classroom device and practise describing measurement uncertainty. They can observe how placement, airflow and timing affect a dataset.
Teachers should not claim a low-cost classroom monitor is certified equivalent to NEA’s network or use one room reading to override official child activity guidance. The most useful lesson is exactly why the two systems are different.
Students can calculate an average of repeated readings, recognise outliers and discuss possible causes. They should be warned against inferring sources from a single spike. In English, they can write a short evidence-based explanation distinguishing observation from hypothesis.
The MOE Environmental Monitoring Literacy Reference and Why Mathematics? Air Quality and PSI are natural companion lessons.
Choosing a monitor without buying a false promise
Ask whether the product measures PM2.5, reports identifiable units, explains calibration or performance, and has usable maintenance guidance. Consider how it is powered, whether the display is legible, whether app connectivity is required and what happens if its software stops being supported.
A monitor that only shows a mysterious overall “air score” may be less useful for haze than a device with a clear PM2.5 trend and credible evidence about its accuracy. But a more expensive monitor is not automatically better. The EPA cautions that price can reflect displays and connectivity rather than measurement quality.
Do not assume a device can measure formaldehyde, CO2, PM2.5 and every other pollutant with laboratory accuracy just because all four icons appear on a screen. Review each sensing function separately.
If the goal is simply to follow government outdoor health advice, the free official NEA dashboard may be sufficient. A home sensor is optional supplementary equipment, not a condition of being a responsible parent.
When professional indoor-air testing is appropriate
Consider qualified professional assessment when the concern is persistent, substantial or linked to building defects, a workplace obligation or a chemical exposure that a low-cost particle sensor cannot identify. A formaldehyde complaint, for example, may require calibrated or accredited measurement methods under NEA’s guidance, not an unverified multi-function gadget.
A professional should explain the measurement objective, chosen pollutants, methods, instrument calibration, sampling conditions and interpretation. Beware of services that promise a single universal “safe” result without discussing uncertainty or the type of contaminant.
A household PM2.5 sensor may still be useful for everyday trends, but it cannot guarantee compliance with every indoor-air standard or assign a source. Do not confuse the convenience of measurement with the authority of a professional investigation.
For office or school-specific systems, consult the facilities manager and qualified building professionals about ventilation and filtration rather than modifying equipment without approval.
Home PM2.5 monitoring mistakes at a glance
| Common mistake | Why it misleads | Better approach |
|---|---|---|
| Comparing indoor PM2.5 directly with 24-hour PSI | Different measurements and units | Use official NEA for outdoor advice |
| Measuring beside purifier outlet | May show unusually clean local air | Use representative occupied-room position |
| Measuring beside frying pan | Records an extreme local source | Note source and location separately |
| Treating a sensor peak as proof of neighbour smoking | PM2.5 has multiple possible sources | Record facts, avoid attribution without evidence |
| Ignoring humidity | Can affect optical particle estimates | Check device performance and conditions |
| Assuming TVOC is PM2.5 | Measures different contaminant families | Identify the sensor and units |
| Trusting a single flashy colour | Manufacturer-specific thresholds vary | Examine time series and measured pollutant |
| Treating low indoor number as permission to run outdoors | Indoor reading is not outside exposure | Follow official one-hour PM2.5 guide |
Frequently asked questions about Singapore PM2.5 home monitors
Is a home PM2.5 sensor the same as NEA’s official PSI?
No. A consumer PM2.5 monitor estimates particles at its sampling point, while NEA’s PSI is an index based on official pollutant reporting. Their units, methods and averaging can differ. Use NEA for outdoor health advice.
Does a low-cost sensor tell me whether my indoor air is safe?
It may help identify trends in pollutants it can detect but does not measure all indoor hazards or diagnose medical safety. Read accuracy limitations and seek qualified evaluation when the situation requires it.
Where should I put the sensor in my HDB flat?
Choose a representative space where people spend time, allow airflow and avoid placing it directly at windows, purifier outlets, cooking sources or strong drafts. Follow the manufacturer’s instructions and keep cables safely managed.
Does Singapore humidity make the reading inaccurate?
Relative humidity can affect some optical sensors, but it does not make every high reading false. Product-specific performance and environmental conditions matter. Avoid applying invented corrections without validation.
Why does my purifier show green while another monitor shows orange?
They may use different sensors, locations, averaging, calibration and colour thresholds. Investigate the pollutant and units rather than assuming one light is definitive.
Can a PM2.5 sensor identify cigarette smoke from a neighbour?
Not reliably. Singapore’s Ministry of Sustainability and the Environment says indoor monitors cannot distinguish the exact source or location of particles and gases. Cooking, incense and other activities can also cause elevated readings.
Can an air sensor detect all smoke gases?
No. A PM2.5 sensor measures a particle-related signal, not every gas. A device may include separate sensors for other substances, but their accuracy and limits must be evaluated independently.
Do I need an air sensor before buying a purifier?
Not necessarily. A properly chosen particle air cleaner can be selected using credible smoke CADR, room volume and needs. A sensor may help track trends but is not a prerequisite for following basic exposure controls.
Does PM2.5 at home rise during cooking?
It can. Cooking can generate particles, and a monitor may show peaks near the activity. Use proper source control and ventilation, and do not interpret every peak as regional haze.
Is a low reading next to a baby’s cot enough to prove the room is safe?
No. The monitor may have accuracy limitations and does not assess all indoor hazards. Continue safe sleep, appropriate ventilation and medical advice where relevant. Never build an unsafe sealed enclosure around the cot.
Should I calibrate my home device?
Follow the manufacturer’s guidance and look for credible performance or independent evaluation. Some sensors need maintenance, correction or replacement over time. A casual comparison with another unknown device is not formal calibration.
Can schools use cheap sensors to override MOE haze advice?
No. Educational sensors can support learning but do not replace NEA’s official data or school operational guidance. The valuable lesson is recognising uncertainty and matching the tool to the question.
What about formaldehyde and TVOC readings on the same device?
They measure different substances or estimates and should not be confused with PM2.5. NEA cautions that low-cost formaldehyde sensors may be unreliable for formal evaluation; calibrated or accredited testing may be needed.
Should I buy a monitor for every room?
Not automatically. Decide what questions need answering and whether a monitor is reliable enough to provide useful information. A well-placed device can sometimes reveal useful patterns without an expensive whole-flat network.
Continue through eduKate’s connected haze ecosystem
Start with How Haze Works | SEA 2026 and How Singapore Connects: PSI, Haze and Air Monitoring. For home decisions use Singapore Haze HDB Windows, HEPA and CADR, Singapore Haze Home Renovation and Singapore Haze at the Office.
For family health, see Singapore Haze Health and Singapore Haze and Babies. The learning connections are MOE Reference 86: Environmental Monitoring Literacy, Why Science? Air Quality and Environmental Data and Why Mathematics? PSI and Particulate Matter.
Primary sources and editorial note
Primary sources: NEA Haze Portal, NEA Air Pollution FAQ, MOH Haze Advisory, US EPA Low-Cost Monitors and Indoor Air Quality, US EPA Sensor Siting Guide, US EPA Enhanced Air Sensor Guidebook, Singapore MSE on Smoke Attribution and NEA Formaldehyde Guidance.
Prepared in October 2026 as environmental measurement literacy and household guidance. It is not a professional indoor-air certification, product endorsement, substitute for clinical advice or source attribution report. A good monitor helps answer a limited question well; a good family plan still depends on reliable official reporting, appropriate filtration and sound judgement.