
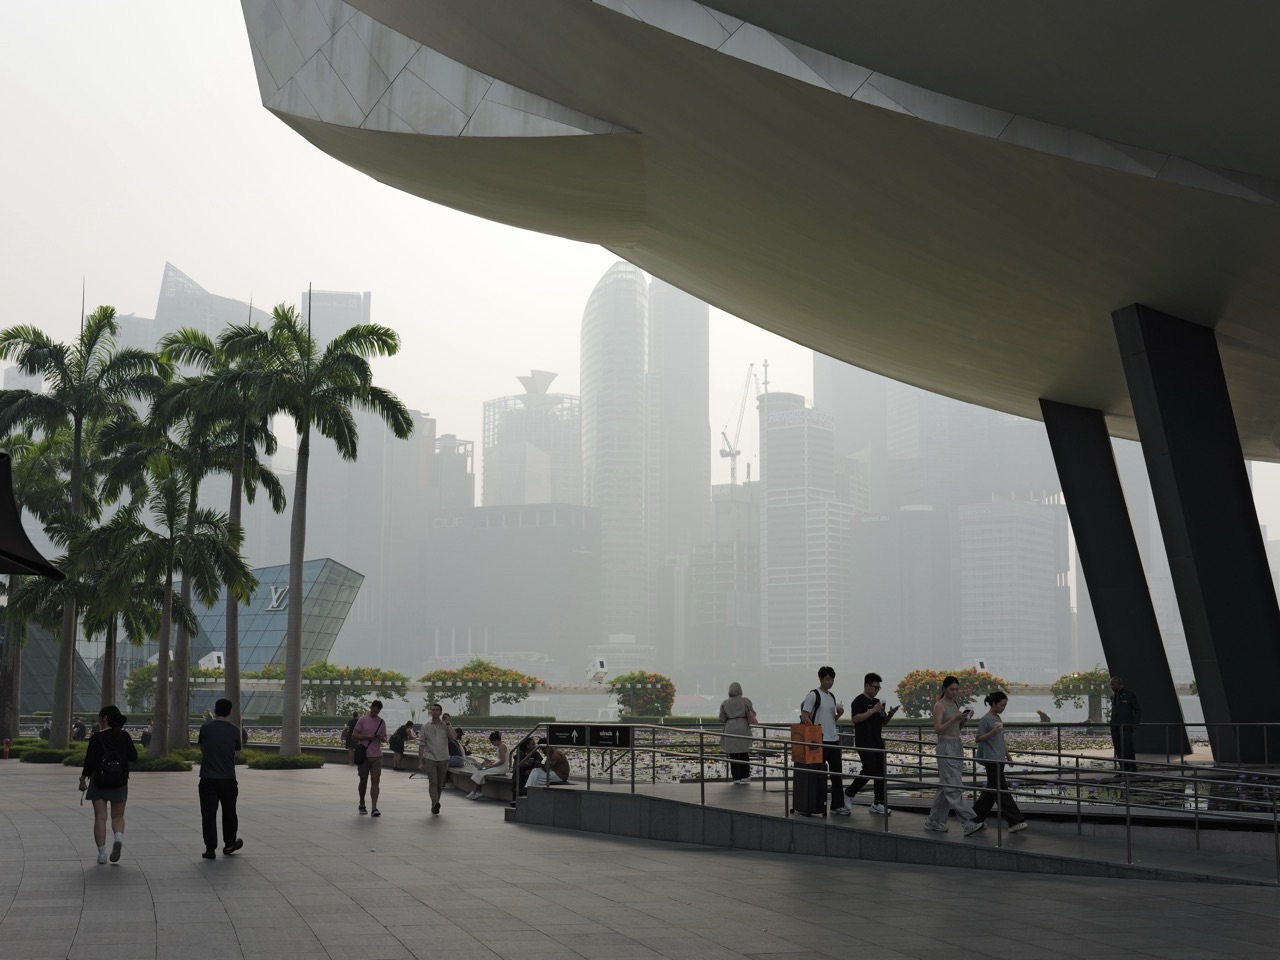
How do you check whether Singapore’s haze is safe for your plans today? Open the official NEA Haze Portal or myENV app. Use the latest one-hour PM2.5 concentration and its personal advisory for an outdoor activity you are about to do. Use the 24-hour PSI forecast and its separate health advice when organising tomorrow’s school, exercise, work or family plans. These numbers are not interchangeable. If you are taking a child or someone with chronic heart or lung disease outdoors, follow the more cautious MOH haze guide, not the healthy adult’s table. A hazy-looking skyline, social-media photograph or unverified international AQI screenshot is not a substitute for those official readings.
This step-by-step Singapore haze guide is for parents, students, commuters, runners, older residents and anyone confused by the changing numbers during October 2026. It explains what one-hour PM2.5 measures, how a 24-hour PSI is calculated from six pollutants, why Singapore has five reporting regions, how to interpret the four immediate bands and the five PSI categories, what a forecast really means, why one value may improve while another stays Unhealthy, and how to make a decision without refreshing an app all day. It includes original worked numerical examples, a quick reference table, reader questions and connected eduKate learning links. The goal follows the immutable Clementi teaching standard: answer first, reveal the logic, test an example, and make the next action obvious.
NEA’s Air Pollution FAQ is especially useful. It says Singapore has published one-hour PM2.5 hourly across five regions since 2014; it introduced the current descriptive bands in 2016, and developed the personal guide with MOH in 2020. That history explains why people may still encounter outdated advice focusing on a single PSI number. The 16 October 2026 haze situation update is a useful example: at 8pm it reported one-hour PM2.5 of 44–148 micrograms per cubic metre across reporting areas, even while the 24-hour PSI remained 159–222. Those are different measurements over different time horizons, not evidence that one agency had made a mistake.
Your first 30 seconds: select the right number
If you are leaving for a jog, a playground, a park walk, outdoor school PE or a bicycle ride in the next hour, look for the current 1-hour PM2.5 reading and its band. Check when it was updated. Then read the personal recommendations for your health group.
If you are deciding whether to keep tomorrow’s outdoor wedding, school trip, sports training or family picnic, use the 24-hour PSI forecast as a planning tool. Keep a backup option and review the current PM2.5 when tomorrow actually arrives.
If somebody is seriously unwell, do not use either reading as a diagnosis or as permission to delay healthcare. Chest pain, severe breathlessness, sudden weakness or collapse requires immediate medical assessment; in Singapore, call 995 for an emergency.
These three paths answer different questions: current environment, future planning and the person’s health.
Find the official Singapore haze information
The authoritative public starting point is haze.gov.sg, the Government of Singapore haze portal. NEA also publishes information through its official site, myENV mobile app and dated media advisories. The Meteorological Service Singapore provides relevant weather information, while the ASEAN Specialised Meteorological Centre provides regional hotspot and smoke context.
A good reader checks the source, number, unit, region and timestamp. Screenshots lose context quickly. A photo forwarded from an old family chat might display the correct number for a completely different date; that does not tell you what is happening now.
Do not confuse “official Singapore haze data” with a privately branded air-pollution app that presents data using another country’s AQI thresholds. Such apps can be useful supplementary sources, but their scale and methodology may differ. For Singapore public-health activity decisions, match NEA’s reported readings to the official MOH guide.
The simplest habit is to bookmark two links: the NEA haze portal and MOH’s haze advice.
What exactly is PM2.5?
PM2.5 refers to particulate matter with an aerodynamic diameter of 2.5 micrometres or less. These tiny particles may originate from combustion and other processes, and can remain suspended in air. During transboundary haze in Singapore, fine particles are a central pollutant of concern.
The one-hour PM2.5 number is an average concentration for the preceding hour, measured in micrograms per cubic metre. That unit describes the mass of fine particles in a volume of air. It is not a percentage of oxygen, not a count of invisible specks, and not a direct measurement of how much one person has inhaled.
The individual’s actual exposure depends on breathing rate, time outdoors, activity intensity, indoor surroundings and individual conditions. Two neighbours may see the same regional reading while making different decisions about an outdoor workout because their health status differs.
For a school student, the unit is a valuable lesson in scientific measurement: concentration is not the same as cumulative personal dose or a medical outcome.
Singapore’s four immediate PM2.5 bands
Under MOH’s personal guide, the one-hour PM2.5 categories are Normal from 0 to 55 micrograms per cubic metre, Elevated from 56 to 150, High from 151 to 250, and Very High at 251 or higher.
For healthy persons, the guidance is normal activity at Normal, reduce strenuous outdoor activity at Elevated, avoid strenuous outdoor activity at High, and minimise outdoor activity at Very High.
For vulnerable people, including children, pregnant women, older adults and those with chronic heart or lung disease, the advice is more cautious. At Elevated they should avoid strenuous outdoor activity. At High and Very High they should avoid outdoor activity.
This is general precautionary advice, not a substitute for a doctor’s individual instructions. A person who is coughing badly should not force outdoor sport because the regional band is Normal. Equally, a brief necessary errand is different from a lengthy strenuous leisure session.
Why NEA uses one-hour readings for immediate choices
During haze, particle concentrations can change significantly within a day as winds, showers and smoke transport shift. A 24-hour average is helpful for a longer exposure period but may respond more slowly to a sudden spike or temporary improvement.
NEA’s FAQ explains that one-hour concentrations and the personal guide were introduced to help people make decisions about their immediate outdoor activities. This allows a runner to check what is occurring now rather than assume that yesterday’s average captures the next hour exactly.
This does not turn one hour into a guarantee for a whole day. A three-hour cycling route may span several reporting periods. If the exercise is optional and readings are unstable, postponement or a suitable indoor alternative may be simpler than trying to outguess the weather.
Shorter averaging periods can fluctuate more. This volatility is a reason to interpret the data correctly, not to accuse the monitoring system of inconsistency.
What the 24-hour Pollutant Standards Index means
The Pollutant Standards Index, or PSI, is Singapore’s broader air-quality index. According to NEA’s published methodology, it is calculated using 24-hour average concentrations of six pollutants: PM10, PM2.5, sulphur dioxide, nitrogen dioxide, ozone and carbon monoxide. A sub-index is calculated for each pollutant, and the highest sub-index determines the PSI.
That method explains why PSI is not simply another way of writing one-hour PM2.5 concentration. One is a composite index over a longer period; the other is a concentration with physical units over a shorter period.
Singapore’s PSI categories are Good (0–50), Moderate (51–100), Unhealthy (101–200), Very Unhealthy (201–300) and Hazardous (above 300). Health advisories become more restrictive as categories worsen, with differences by health group and outdoor exertion.
A 24-hour PSI of 160 does not mean “160 micrograms per cubic metre” and cannot be compared numerically with a PM2.5 of 160 as if they were the same quantity.
A forecast is not the same as a measured past value
A 24-hour PSI reading describes the index calculated for an observed period, while the PSI forecast communicates expected air quality for the upcoming period. They are related information products, but their time frames and uncertainty are different.
A forecast may be revised as meteorological conditions change. In October 2026, NEA explained how fires in Kalimantan and Sumatra, regional winds, clouds and showers affected haze transport. If those conditions change, the forecast can change as well.
Therefore, a family can use the forecast to choose whether a birthday gathering needs an indoor backup, then use the later one-hour PM2.5 to assess the immediate outdoor plan. This is a responsible updating process, not indecision.
Do not use the forecast to state that a specific neighbourhood will have exactly one numerical reading at 4pm tomorrow. A national or regional range is not a street-level guarantee.
Singapore’s five regional readings
NEA has historically published one-hour PM2.5 across five reporting regions: North, South, East, West and Central. Those regional readings help members of the public understand broad patterns, but they are not measurements at every doorway, playground or classroom.
If you live in Queenstown, a reading for the South or Central region, as shown on the official portal, may be useful context for planning. It cannot certify a specific bedroom’s indoor-air concentration. Similarly, one reading labelled East does not prove the air at every East Coast Park food stall is identical.
A local consumer sensor can add supplementary information but should not be mistaken for an NEA reference monitor. Placement, humidity, calibration and other factors can influence consumer measurements.
People should use the actual official regional presentation rather than assume a particular town belongs to a named sensor or that a single reading is always closest geographically.
How to read a nationwide range in a news release
An NEA advisory may report one-hour PM2.5 as a range across Singapore’s reporting areas. That range is not a claim that the concentration changed from the lower number to the higher number in one person’s flat over the hour. It tells readers the spread of readings across the referenced monitoring areas at that time.
For example, on 16 October 2026 at 8pm, NEA reported one-hour PM2.5 values of 44 to 148 micrograms per cubic metre. That means some reported areas were Normal and some Elevated under the band’s thresholds. At the same time, the 24-hour PSI ranged from 159 to 222, which covered Unhealthy and Very Unhealthy categories.
Do not subtract 44 from 148 and call the resulting 104 a “national haze increase”. The two endpoints refer to a regional range at the same reporting time, not a before-and-after comparison for one station.
This is a simple but important numeracy lesson for adults and students reading fast-moving news.
Worked Mathematics example: PM2.5 minus PSI is not valid
A student sees a one-hour PM2.5 value of 180 micrograms per cubic metre and a 24-hour PSI value of 150. They write 180 − 150 = 30 and conclude that air quality has changed by 30. The arithmetic is mechanically correct but the interpretation is invalid.
Step one: Identify the quantities. PM2.5 concentration is measured as mass per volume. PSI is a dimensionless index derived from sub-index values based on several pollutants. Their averaging periods differ too.
Step two: Ask whether subtraction is meaningful. Subtracting a dimensionless index from micrograms per cubic metre does not yield a valid concentration change or a health-risk measure.
Step three: Compare genuinely comparable data. If two one-hour PM2.5 readings from a comparable area and method are 180 and 130, their difference is 50 micrograms per cubic metre. That is a concentration difference, not a diagnosis or a measured inhaled dose.
Transfer question: If the two displayed numbers are both 100 but come from PSI and PM2.5, are they the same quantity? No. Identical numerals do not make units and methods interchangeable.
This follows the Clementi teaching approach: find the first mistaken assumption, repair the principle, work a valid example, then check whether the learner can apply it elsewhere.
Worked example: a parent with two different readings
Suppose a parent checked a 24-hour PSI forecast of Unhealthy the previous evening, then sees one-hour PM2.5 in the Normal band before a necessary short journey to school. These observations can coexist because they answer different timing questions.
The immediate reading, personal health advice and actual journey help the parent decide what to do now. The forecast is still relevant to broader plans and later changes. Neither observation proves that a child with asthma can ignore a medical action plan.
The family should also consider the destination’s own instructions. A school can operate indoors while modifying outdoor PE or CCA. The parent cannot infer that every school has closed merely from the earlier forecast.
The correct answer is not “one government number is wrong”. The correct answer is “identify which data product matches the decision”.
Why Singapore does not publish a one-hour PSI for this purpose
NEA’s air-pollution FAQ explains that the PSI health evidence is based on pollutant exposure averaged over longer periods, and Singapore does not use a one-hour PSI for its current personal haze guidance. The one-hour PM2.5 concentration was developed as a separate immediate indicator.
A commercial air-quality application may display “hourly AQI” or a coloured number based on other countries’ scales. That does not make it the same as Singapore’s PSI. Readers should identify the method before comparing labels such as Unhealthy, Poor or Hazardous across services.
No international standard requires every country to calculate and label air-quality indices in one identical way. Different averaging periods, pollutant choices and thresholds can yield different colours for the same broad event.
For household decisions in Singapore, MOH’s personal guide and NEA’s own indicators provide a coherent matching system. Using those together avoids many apparent contradictions.
US AQI, API and PSI: don’t combine incompatible scales
An overseas AQI value, Malaysia’s Air Pollutant Index (API) and Singapore’s PSI may all describe air pollution, but they need not use identical pollutant averaging periods, sub-index formulas or category thresholds. Copying a number from one country’s app into another country’s MOH activity table can produce an incorrect conclusion.
A Singapore parent should not claim that “US AQI 160 equals Singapore PSI 160” without a justified method. The values may coincide numerically while referring to different systems. Similarly, comparing a one-hour PM2.5 concentration with an international 24-hour particulate benchmark as though they use the same duration can be misleading.
If a student is doing a geography project, they can research each system’s methodology and identify whether a comparison is scientifically meaningful. That is a good exercise in interpreting units and conventions.
For immediate Singapore activity choices, keep the public-health process simple: NEA one-hour PM2.5 plus MOH personal advice.
A hazy-looking skyline may not match the number
Visibility depends on light, water droplets, humidity and particles. NEA specifically warns that smell or visible haze is not a reliable indicator of actual air quality. A photograph taken facing bright sunlight may look greyer than another captured from a different direction.
People sometimes interpret the arrival of a breeze as a guarantee of cleaner air. Wind can transport regional smoke as well as disperse it. A coastal view and an inland park can both be affected during a transboundary haze episode.
The right response is to use the timestamped official reading rather than evaluate safety from how far you can see across Marina Bay. Photographs can document visual atmosphere, but not numerical PM2.5 concentration on their own.
The Singapore Haze Photography Guide explores that difference and the importance of accurate captions.
Why household sensors can disagree with NEA
A consumer PM2.5 monitor may sit beside a window, purifier, kitchen or air conditioner. It samples one immediate indoor environment and may use an optical method affected by humidity and particle characteristics. NEA’s regional measurement system serves a different monitoring purpose.
A household monitor reading lower than NEA’s regional value does not automatically prove that the government is wrong. It may indicate lower indoor concentration, a different sensor location, a device limitation or other factors. Conversely, frying can produce a higher local indoor reading than outdoors.
Avoid presenting an uncalibrated small device as official public data. Look at trends, place sensors thoughtfully and understand the units and limitations before using them to make claims.
Our Singapore Haze Home PM2.5 Sensor Guide explains consumer accuracy and indoor testing more fully.
School, PE and after-school activity decisions
An MOE school can continue academic lessons while modifying outdoor PE or CCA. Private tuition centres have separate arrangements. A one-hour reading informs the current outdoor exposure, while the school or operator must also decide actual programme operations.
Parents should follow the institution’s dated communication rather than assume that every class is cancelled because a neighbour forwarded a screenshot. A student with asthma may need individual precautions under the prescribed action plan even if the group programme continues.
The important question is whether the actual child and activity fit the current guidance. A normal indoor Mathematics lesson, strenuous outdoor football game and long open-air excursion are different.
See Singapore Haze Schools and Exams and Singapore Haze Tuition and Enrichment for operational detail.
Running, cycling and gym choices
A healthy runner at Elevated one-hour PM2.5 should reduce strenuous outdoor activity under MOH’s guide; at High, avoid strenuous outdoor activity. A person with chronic heart or lung disease needs more cautious recommendations. A long cycling loop or football match also requires considering total duration and effort.
An appropriate enclosed indoor gym may reduce outdoor exposure, but an air-conditioned room is not a guarantee of HEPA filtration. If someone has significant symptoms, a better gym location is not a substitute for medical attention.
A forecast can help a runner decide whether to arrange a possible indoor session tomorrow, but the actual current reading is needed before today’s run. Training should be adaptable and recoverable.
For choices and the eventual return, read Singapore Haze Exercise and Return to Running After Haze.
Older persons and chronic diseases
MOH treats older adults and people with chronic heart or lung conditions as more vulnerable for outdoor decisions. A healthy adult’s apparent tolerance is not evidence that their older parent should take the same prolonged walk. Nor does a normal regional reading certify that someone with chest pain is medically stable.
Keep prescribed medicines accessible, follow individual care plans and make necessary clinic journeys practical. A person with severe breathlessness, chest pain or stroke warning signs requires urgent medical assessment regardless of air-quality categories.
If a resident must travel to a care centre, an accessible route and actual service operation matter alongside pollution exposure. A short essential appointment is different from an optional afternoon in an open park.
The Singapore Haze Seniors Guide and Heart Health Guide address individual needs.
Keep a small family decision routine
A practical routine can have three checkpoints: the evening before, the hour before departure, and any meaningful official update that changes the plan. At the evening checkpoint, review the forecast and prepare alternatives for major optional outdoor activities. At departure, read current PM2.5 and the real venue notice.
Do not check continuously for the sake of checking. Constantly reopening the same screen may add stress without changing any action. The most useful information is the one connected to a real decision: whether to leave, change intensity, alter a route or seek help.
Share a short factual family message including source, time, personal relevance and action. Avoid forwarding a dated screen capture as though it were a live alert. Make one person responsible for checking the official page when necessary.
For a complete family template, use Singapore Haze Family Preparedness.
An October 2026 example with actual official numbers
On 16 October 2026, NEA reported a 24-hour PSI in the Unhealthy to Very Unhealthy range while the one-hour PM2.5 varied across the Normal and Elevated bands at its 8pm update. A parent who saw only “PSI 222” might assume that the current one-hour PM2.5 was at least 222 micrograms per cubic metre in every estate. That conclusion would be incorrect.
The two figures came from different measures and geographic reporting ranges. The family could use the 24-hour PSI forecast to plan whether tomorrow’s trip needed modification and then use the later current PM2.5 reading for immediate outdoor activity. The child’s health remained an additional consideration.
This example is dated. It does not state the user’s current local air or forecast. To check tonight, use the official portal rather than repeating October 16 values as if they were live.
That is how accurate, useful information should work: a dated example teaches the method, while fresh monitoring supports the current decision.
Comparison table: four questions, four different sources
| Question | Best evidence | Unit or format | Common error |
|---|---|---|---|
| Can I jog in the next hour? | NEA one-hour PM2.5 + MOH guide | µg/m³ and personal activity band | Use yesterday’s PSI screenshot |
| Should we plan tomorrow’s outdoor event? | 24-hour PSI forecast and advisory | PSI category and forecast range | Assume precise hour-by-hour guarantee |
| Is my bedroom air filtered well? | Suitable indoor measurement and system information | Indoor PM2.5, CADR, ventilation | Treat outdoor PSI as an indoor sensor |
| Is my child medically fit for sport? | Symptoms, prescribed plan, healthcare advice | Individual clinical judgement | A favourable air reading gives clearance |
| Where did regional smoke come from? | NEA advisories and ASMC hotspot data | Dated meteorology and fire observations | Infer precise source from sky colour |
| Are all public pools open? | Facility/operator notices | Location and opening status | Air band alone controls maintenance |
| Does a US AQI number equal Singapore PSI? | Methodology of each index | Different scales may apply | Compare raw numbers without conversion |
| Is a photograph evidence of the PSI? | Only separate dated official measurement | Image versus measurement | Convert pixels into a pollution reading |
Frequently asked questions about Singapore PSI and PM2.5
What is the PSI in Singapore today?
Check the current 24-hour PSI on haze.gov.sg. This article explains the method but does not embed a live reading. For an outdoor activity in the next hour, check the separate one-hour PM2.5.
Is PM2.5 the same as PSI?
No. PM2.5 is a measured fine-particle concentration in micrograms per cubic metre. PSI is a composite index using 24-hour averages of six pollutants, with the highest calculated sub-index determining the reported PSI.
Which number should parents use before playground time?
Use the latest one-hour PM2.5 and MOH’s guide for children, who are a vulnerable group. Consider duration, exertion, health and the actual setting; a covered outdoor playground is not necessarily filtered.
Can a PSI of 200 coexist with Normal one-hour PM2.5?
Yes. Different averaging periods and pollutant contributions mean the current fine-particle concentration may improve before a longer index has fully responded. The actual observed values and times should be checked rather than assumed.
Why does Singapore use five regional readings?
NEA reports one-hour PM2.5 across North, South, East, West and Central regions, providing broad geographic information. Those readings are not sensors located in every apartment or park.
Is the highest regional value automatically the value near my front door?
No. Regional reporting does not give exact micro-scale conditions at each address, and indoor air can differ. Use the official regional data as guidance without inventing precise home exposure.
What are the one-hour PM2.5 bands?
Normal 0–55, Elevated 56–150, High 151–250, and Very High 251 or more micrograms per cubic metre. MOH provides separate immediate outdoor recommendations by band and health group.
What is considered Unhealthy PSI?
A 24-hour PSI from 101 to 200 is Unhealthy under Singapore’s categories. Very Unhealthy is 201–300, while above 300 is Hazardous. A current PM2.5 band is a different system.
Why isn’t one-hour PSI published in the same way?
NEA explains that health evidence underlying PSI uses longer averaging periods. Singapore uses a separate one-hour PM2.5 concentration guide for immediate outdoor decisions instead.
Can I compare Singapore PSI directly with US AQI?
Not reliably without considering differences in index calculation, pollutants and averaging periods. Do not assume identical numbers or colours represent identical methods or health guidance.
Does a grey sky prove the air is High PM2.5?
No. Visibility depends on light, humidity, water droplets and pollutants. NEA warns that sight and smell are unreliable indicators of numerical pollution levels.
Should I wear an N95 whenever PSI exceeds 100?
MOH generally does not recommend N95-equivalent masks for ordinary short commutes or indoors. Specific necessary prolonged outdoor exposures at higher PM2.5 bands may warrant considering an appropriately fitted respirator, with individual health precautions.
Are current readings guaranteed for the next two hours?
No. One-hour concentrations can change with weather and smoke movement. Check again before a significant outdoor activity if conditions are unstable, and preserve a practical alternative.
Is a 24-hour PSI forecast a live reading?
No. A forecast is an expectation for future conditions; the observed 24-hour PSI is a calculated index for the reporting period. The one-hour PM2.5 is a separate more immediate concentration indicator.
Does drinking extra water make it safe to exercise during High PM2.5?
No. Ordinary hydration supports comfort and heat management but does not filter smoke particles from the lungs. Follow current outdoor activity advice and individual medical instructions.
Can an air purifier lower indoor PM2.5 while outdoor PSI stays Unhealthy?
A suitable purifier and indoor source controls can reduce indoor particles in some rooms, but the outcome depends on actual ventilation and filtration. The outdoor PSI does not directly measure an apartment’s indoor result.
Is a person with chronic asthma cleared if the one-hour band becomes Normal?
The outdoor guide may become less restrictive, but symptoms and the person’s prescribed asthma plan still matter. A regional reading cannot provide clinical clearance.
Is a reading sent on WhatsApp usable?
Only if its original source, date, region and time still match your decision. For fast-changing information, opening NEA’s live portal is safer than relying on an old screenshot.
Can I subtract a PSI of 160 from PM2.5 of 180?
No meaningful physical unit results from subtracting these distinct quantities. Compare corresponding measures under comparable time frames instead.
How can students use this in Mathematics or Science?
Students can practise unit analysis, understanding averages, matching evidence to questions and distinguishing observation from inference. They can explain why a numerical calculation may be invalid even when the arithmetic itself is correct.
More from eduKate’s connected haze information network
The regional master is How Haze Works | SEA 2026. The measurement system is explored in How Singapore Connects: PSI and Air Quality Monitoring and Singapore Haze Home Sensors.
For the decision that follows the measurement, read Singapore Haze Family Preparedness, Singapore Haze Exercise, Singapore Haze Schools and Singapore Haze Community Shelters.
For learning see MOE Reference 86: Haze and Environmental Monitoring Literacy, Why Science? Environmental Data and Why Mathematics? PSI and PM2.5. The immutable Clementi Mathematics tutor guide demonstrates the same principle of fixing misconceptions before asking learners to memorise more rules.
Official sources and review date
Primary references: NEA Haze Portal, MOH Haze Guidance, updated 17 October 2026, NEA Air Pollution FAQ, NEA and MOH 2020 One-Hour PM2.5 Guide, NEA 16 October 2026 Situation Update, Meteorological Service Singapore and ASMC.
Prepared October 2026 as a durable guide to interpreting government data—not a live pollutant reading, medical diagnosis or guarantee about an individual place. The best information answers the reader’s actual question at the right time scale: current PM2.5 for immediate outdoor choices, forecast PSI for planning, and individual clinical advice whenever health concerns demand it.